Estimated zip code population in 2022: 4,350 Zip code population in 2010: 4,095 Zip code population in 2000: 4,439
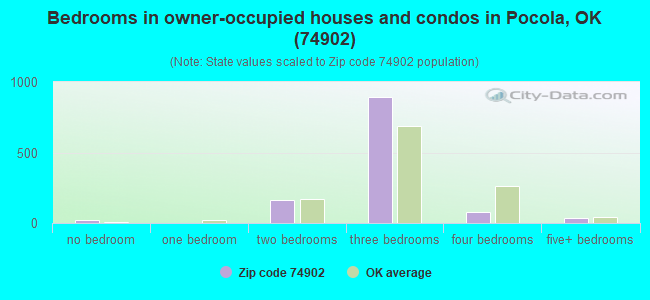
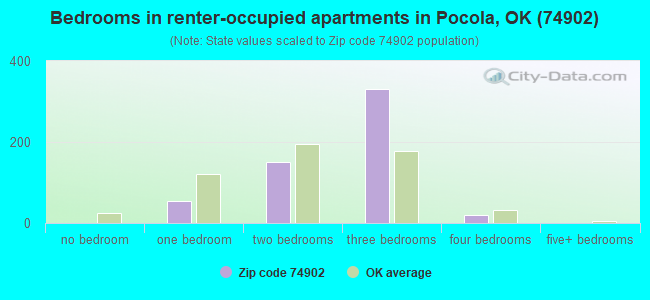
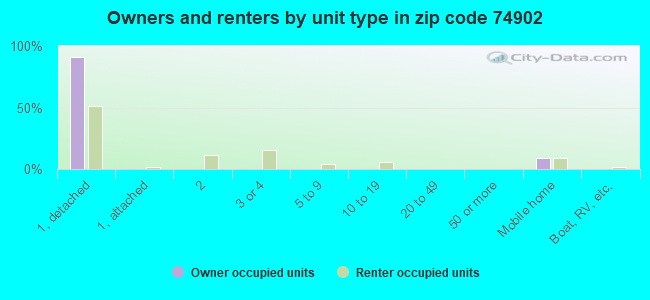
Houses and condos: 1,839 Renter-occupied apartments: 562
% of renters here:
32%
State:
35%
March 2022 cost of living index in zip code 74902: 79.1 (low, U.S. average is 100)
Land area: 30.4 sq. mi. Water area: 0.3 sq. mi.
Population density: 143 people per square mile
(very low).
OSM Map
General Map
Google Map
MSN Map
OSM Map
General Map
Google Map
MSN Map
OSM Map
General Map
Google Map
MSN Map
OSM Map
General Map
Google Map
MSN Map
Please wait while loading the map...
Real estate property taxes paid for housing units in 2022:
This zip code:
0.7% ($860)
Oklahoma:
0.8% ($1,501)
Median real estate property taxes paid for housing units with mortgages in 2022: $1,251 (0.8%) Median real estate property taxes paid for housing units with no mortgage in 2022: $560 (0.5%)
Business Search- 14 Million verified businesses
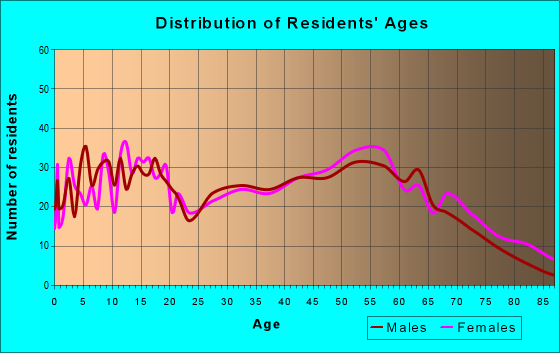
Males: 2,045
(47.0%)
Females: 2,305
(53.0%)
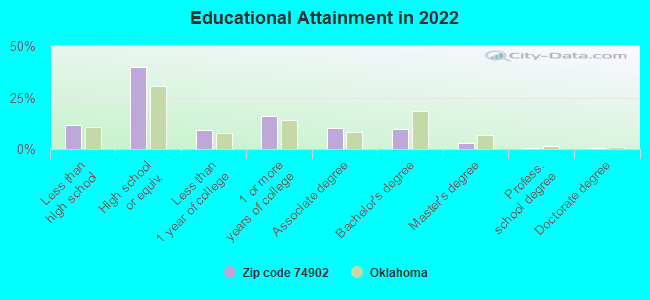
For population 25 years and over in 74902:
High school or higher: 87.6%
Bachelor's degree or higher: 12.9%
Graduate or professional degree: 3.5%
Unemployed: 2.2%
Mean travel time to work (commute): 17.0 minutes
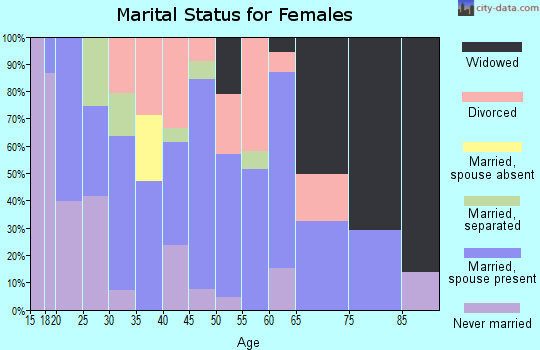
For population 15 years and over in 74902:
Never married: 25.1%
Now married: 49.1%
Separated: 4.1%
Widowed: 6.5%
Divorced: 15.1%
Zip code 74902 compared to state average:
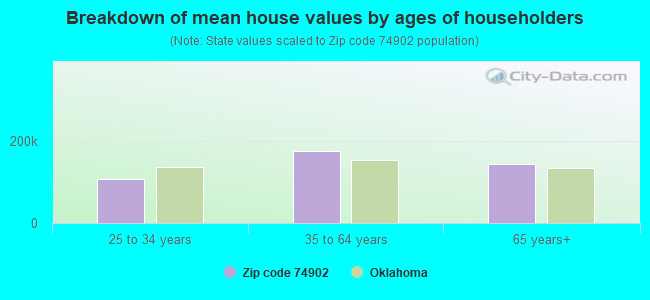
Median house value below state average.
Unemployed percentage below state average.
Black race population percentage significantly below state average.
Hispanic race population percentage significantly below state average.
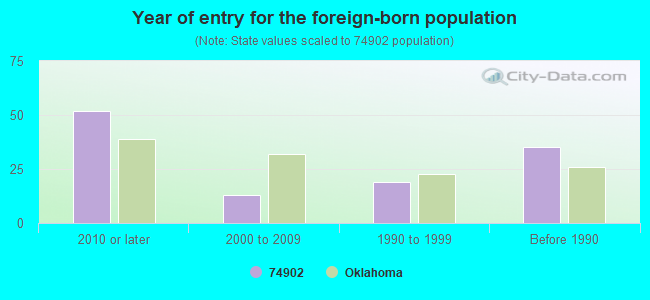
Foreign-born population percentage significantly below state average.
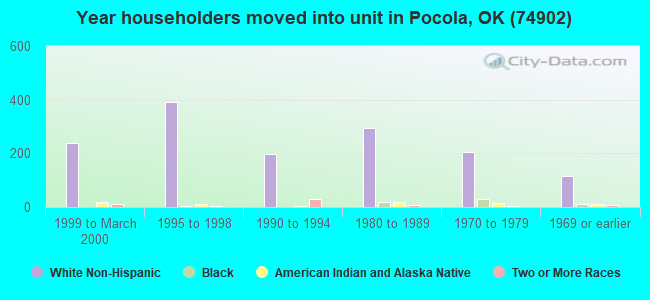
Length of stay since moving in significantly above state average.
Number of college students below state average.
Percentage of population with a bachelor's degree or higher below state average.
Averages for the 2020 tax year for zip code 74902, filed in 2021:
Average Adjusted Gross Income (AGI) in 2020: $45,903 (Individual Income Tax Returns)
Here:
$45,903
State:
$63,060
Salary/wage: $40,979 (reported on 81.4% of returns)
Here:
$40,979
State:
$52,427
(% of AGI for various income ranges: 1147.5% for AGIs below $25k, 3632.1% for AGIs $25k-50k, 6869.0% for AGIs $50k-75k, 9051.8% for AGIs $75k-100k, 16563.0% for AGIs $100k-200k)
Taxable interest for individuals: $726 (reported on 20.8% of returns)
This zip code:
$726
Oklahoma:
$1,603
(% of AGI for various income ranges: 11.5% for AGIs below $25k, 15.3% for AGIs $25k-50k, 17.1% for AGIs $50k-75k, 18.2% for AGIs $75k-100k, 99.0% for AGIs $100k-200k)
Ordinary dividends: $2,869 (reported on 7.1% of returns)
Here:
$2,869
State:
$7,001
(% of AGI for various income ranges: 1.8% for AGIs below $25k, 9.2% for AGIs $25k-50k, 51.4% for AGIs $50k-75k, 220.0% for AGIs $100k-200k)
Net capital gain/loss in AGI: +$6,485 (reported on 7.1% of returns)
Here:
+$6,485
State:
+$19,855
(% of AGI for various income ranges: 3.5% for AGIs below $25k, 5.3% for AGIs $25k-50k, 95.2% for AGIs $50k-75k, 604.0% for AGIs $100k-200k)
Profit/loss from business: +$6,761 (reported on 15.3% of returns)
Here:
+$6,761
State:
+$9,904
(% of AGI for various income ranges: 122.9% for AGIs below $25k, 194.2% for AGIs $25k-50k, 52.9% for AGIs $50k-75k, 54.5% for AGIs $75k-100k, 308.0% for AGIs $100k-200k)
Taxable individual retirement arrangement distribution: $19,642 (reported on 6.6% of returns)
74902:
$19,642
Oklahoma:
$20,476
(% of AGI for various income ranges: 76.0% for AGIs below $25k, 76.3% for AGIs $25k-50k, 291.0% for AGIs $50k-75k, 1038.0% for AGIs $100k-200k)
Total itemized deductions: $40,360 (reported on 2.7% of returns)
Here:
$40,360
State:
$39,736
(% of AGI for various income ranges: 411.9% for AGIs $50k-75k, 1153.0% for AGIs $100k-200k)
Charity contributions: $6,733 (reported on 1.6% of returns)
Here:
$6,733
State:
$17,288
(% of AGI for various income ranges: 183.6% for AGIs $75k-100k)
Taxes paid: $5,300 (reported on 2.7% of returns)
74902:
$5,300
State:
$7,046
(% of AGI for various income ranges: 42.4% for AGIs $50k-75k, 176.0% for AGIs $100k-200k)
Earned income credit: $2,439 (reported on 22.4% of returns)
Here:
$2,439
State:
$2,435
(% of AGI for various income ranges: 114.2% for AGIs below $25k, 97.9% for AGIs $25k-50k)
Percentage of individuals using paid preparers for their 2020 taxes: 96.2%
Here:
96%
State:
94%
(% for various income ranges: 97.3% for AGIs below $25k, 95.8% for AGIs $25k-50k, 96.6% for AGIs $50k-75k, 93.3% for AGIs $75k-100k, 93.3% for AGIs $100k-200k, 100.0% for AGIs over 200k)
Averages for the 2012 tax year for zip code 74902, filed in 2013:
Average Adjusted Gross Income (AGI) in 2012: $40,916 (Individual Income Tax Returns)
Here:
$40,916
State:
$58,581
Salary/wage: $36,410 (reported on 83.1% of returns)
Here:
$36,410
State:
$45,973
(% of AGI for various income ranges: 73.5% for AGIs below $25k, 79.8% for AGIs $25k-50k, 79.1% for AGIs $50k-75k, 84.4% for AGIs $75k-100k, 100.2% for AGIs $100k-200k)
Taxable interest for individuals: $731 (reported on 22.7% of returns)
This zip code:
$731
Oklahoma:
$1,625
(% of AGI for various income ranges: 1.1% for AGIs below $25k, 0.3% for AGIs $25k-50k, 0.3% for AGIs $50k-75k, 0.3% for AGIs $75k-100k, 0.5% for AGIs $100k-200k)
Ordinary dividends: $2,267 (reported on 7.0% of returns)
Here:
$2,267
State:
$6,374
(% of AGI for various income ranges: 0.3% for AGIs below $25k, 0.3% for AGIs $25k-50k, 0.3% for AGIs $50k-75k, 1.5% for AGIs $100k-200k)
Net capital gain/loss in AGI: +$956 (reported on 5.2% of returns)
Here:
+$956
State:
+$24,023
(% of AGI for various income ranges: 0.1% for AGIs $25k-50k, 0.3% for AGIs $50k-75k, 0.4% for AGIs $100k-200k)
Profit/loss from business: +$6,042 (reported on 15.1% of returns)
Here:
+$6,042
State:
+$11,913
(% of AGI for various income ranges: 7.6% for AGIs below $25k, 3.7% for AGIs $25k-50k, 1.0% for AGIs $50k-75k, 0.8% for AGIs $75k-100k)
Taxable individual retirement arrangement distribution: $11,386 (reported on 8.1% of returns)
74902:
$11,386
Oklahoma:
$15,242
(% of AGI for various income ranges: 3.4% for AGIs below $25k, 2.2% for AGIs $25k-50k, 2.5% for AGIs $50k-75k, 5.1% for AGIs $75k-100k)
Total itemized deductions: $21,842 (25% of AGI, reported on 18.0% of returns)
Here:
$21,842
State:
$24,882
Here:
25.5% of AGI
State:
18.8% of AGI
(% of AGI for various income ranges: 3.9% for AGIs below $25k, 7.6% for AGIs $25k-50k, 10.0% for AGIs $50k-75k, 8.8% for AGIs $75k-100k, 24.9% for AGIs $100k-200k)
Charity contributions: $4,619 (reported on 12.2% of returns)
Here:
$4,619
State:
$6,591
(% of AGI for various income ranges: 1.4% for AGIs $25k-50k, 1.2% for AGIs $50k-75k, 1.7% for AGIs $75k-100k, 3.5% for AGIs $100k-200k)
Taxes paid: $4,797 (reported on 18.0% of returns)
74902:
$4,797
State:
$7,196
(% of AGI for various income ranges: 0.4% for AGIs below $25k, 1.2% for AGIs $25k-50k, 1.8% for AGIs $50k-75k, 2.4% for AGIs $75k-100k, 6.7% for AGIs $100k-200k)
Earned income credit: $2,453 (reported on 26.2% of returns)
Here:
$2,453
State:
$2,354
(% of AGI for various income ranges: 9.0% for AGIs below $25k, 1.5% for AGIs $25k-50k)
Percentage of individuals using paid preparers for their 2012 taxes: 69.2%
Here:
69%
State:
56%
(% for various income ranges: 64.9% for AGIs below $25k, 67.4% for AGIs $25k-50k, 73.1% for AGIs $50k-75k, 83.3% for AGIs $75k-100k, 100.0% for AGIs $100k-200k)
Averages for the 2004 tax year for zip code 74902, filed in 2005:
Average Adjusted Gross Income (AGI) in 2004: $32,570 (Individual Income Tax Returns)
Here:
$32,570
State:
$41,245
Salary/wage: $31,345 (reported on 87.7% of returns)
Here:
$31,345
State:
$35,318
(% of AGI for various income ranges: 114.5% for AGIs below $10k, 79.7% for AGIs $10k-25k, 88.9% for AGIs $25k-50k, 88.3% for AGIs $50k-75k, 81.5% for AGIs $75k-100k, 62.0% for AGIs over 100k)
Taxable interest for individuals: $1,135 (reported on 29.4% of returns)
This zip code:
$1,135
Oklahoma:
$1,745
(% of AGI for various income ranges: 5.3% for AGIs below $10k, 1.7% for AGIs $10k-25k, 0.7% for AGIs $25k-50k, 1.1% for AGIs $50k-75k, 0.3% for AGIs $75k-100k, 0.9% for AGIs over 100k)
Taxable dividends: $884 (reported on 9.6% of returns)
Here:
$884
State:
$2,920
(% of AGI for various income ranges: 1.0% for AGIs below $10k, 0.5% for AGIs $10k-25k, 0.1% for AGIs $25k-50k, 0.1% for AGIs $50k-75k, 0.3% for AGIs $75k-100k, 0.8% for AGIs over 100k)
Net capital gain/loss: +$1,581 (reported on 7.3% of returns)
Here:
+$1,581
State:
+$10,653
(% of AGI for various income ranges: 1.4% for AGIs below $10k, -0.1% for AGIs $10k-25k, -0.0% for AGIs $25k-50k, 0.1% for AGIs $50k-75k, 0.7% for AGIs $75k-100k, 2.5% for AGIs over 100k)
Profit/loss from business: +$3,726 (reported on 16.1% of returns)
Here:
+$3,726
State:
+$8,532
(% of AGI for various income ranges: 3.9% for AGIs below $10k, 7.5% for AGIs $10k-25k, 1.9% for AGIs $25k-50k, -0.3% for AGIs $50k-75k, 1.4% for AGIs over 100k)
IRA payment deduction: $3,211 (reported on 2.2% of returns)
74902:
$3,211
Oklahoma:
$3,127
Total itemized deductions: $13,677 (23% of AGI, reported on 21.8% of returns)
Here:
$13,677
State:
$17,093
Here:
23.4% of AGI
State:
20.5% of AGI
(% of AGI for various income ranges: 6.0% for AGIs $10k-25k, 8.1% for AGIs $25k-50k, 9.7% for AGIs $50k-75k, 13.1% for AGIs $75k-100k, 12.9% for AGIs over 100k)
Charity contributions deductions: $2,862 (5% of AGI, reported on 18.3% of returns)
Here:
$2,862
State:
$4,240
Here:
4.7% of AGI
State:
4.8% of AGI
(% of AGI for various income ranges: 0.9% for AGIs $10k-25k, 1.6% for AGIs $25k-50k, 1.5% for AGIs $50k-75k, 2.3% for AGIs $75k-100k, 2.4% for AGIs over 100k)
Total tax: $3,528 (reported on 70.8% of returns)
74902:
$3,528
State:
$6,542
(% of AGI for various income ranges: 4.3% for AGIs below $10k, 3.7% for AGIs $10k-25k, 5.7% for AGIs $25k-50k, 8.0% for AGIs $50k-75k, 10.3% for AGIs $75k-100k, 16.4% for AGIs over 100k)
Earned income credit: $1,889 (reported on 24.8% of returns)
Here:
$1,889
State:
$1,830
Percentage of individuals using paid preparers for their 2004 taxes: 79.2%
Here:
79%
State:
63%
(% for various income ranges: 72.5% for AGIs below $10k, 78.6% for AGIs $10k-25k, 81.2% for AGIs $25k-50k, 83.1% for AGIs $50k-75k, 83.1% for AGIs $75k-100k, 83.3% for AGIs over 100k)
Household received Food Stamps/SNAP in the past 12 months: 410 Household did not receive Food Stamps/SNAP in the past 12 months: 1,375
Women who had a birth in the past 12 months: 57 (33 now married, 23 unmarried) Women who did not have a birth in the past 12 months: 957 (445 now married, 511 unmarried)
Housing units in zip code 74902 with a mortgage: 543 Median monthly owner costs for units with a mortgage: $1,026 Median monthly owner costs for units without a mortgage: $328
Residents with income below the poverty level in 2022:
This zip code:
16.9%
Whole state:
15.7%
Residents with income below 50% of the poverty level in 2022:
This zip code:
8.6%
Whole state:
8.3%
Median number of rooms in houses and condos:
Here:
5.4
State:
6.1
Median number of rooms in apartments:
Here:
4.8
State:
4.5
Notable locations in this zip code not listed on our city pages
Notable locations in zip code 74902: Emergency Medical Services of Le Flore County Station 4 Pocola (A), Pocola Fire Department (B). Display/hide their locations on the map
Churches in zip code 74902 include: Christian Grove Church (A), Macedonia Church (B), Light House Church (C), Union Church (D). Display/hide their locations on the map
In group quarters: 76 (-1 institutionalized population)
Size of family households: 573 2-persons, 312 3-persons, 148 4-persons, 64 5-persons, 30 6-persons, 50 7-or-more-persons
Size of nonfamily households: 429 1-person, 167 2-persons
576 married couples with children.
229 single-parent households (20 men, 209 women).
96.7% of residents of 74902 zip code speak English at home.
1.9% of residents speak Spanish at home (59% very well, 41% well).
1.2% of residents speak other Indo-European language at home (64% very well, 26% well, 10% not well).
0.1% of residents speak other language at home (100% very well).
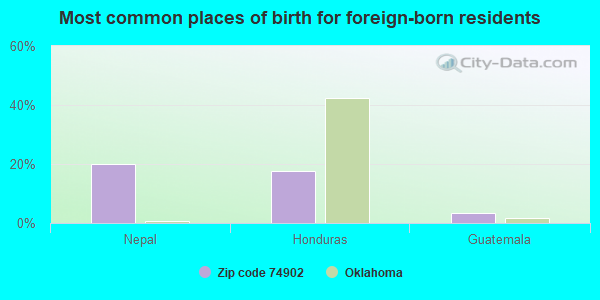
Foreign born population: 85 (2.0%) (33.9% of them are naturalized citizens)
This zip code:
2.0%
Whole state:
6.0%
20%Nepal
18%Honduras
4%Guatemala
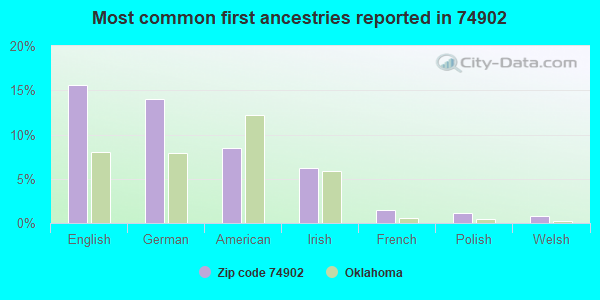
16%English
14%German
9%American
6%Irish
1%French
1%Polish
1%Welsh
Year of entry for the foreign-born population
522010 or later
132000 to 2009
191990 to 1999
35Before 1990
Facilities with environmental interests located in this zip code:
COLEMAN CO INC POCOLA SITE THE (201 DURHAM ST in POCOLA, OK) . Tribal Land
(Resource Conservation and Recovery Act (tracking hazardous waste)) Organizations: THE COLEMAN COMPANY INC (CONTACT/OWNER)
CHOCTAW TRAVEL PLAZA POCOLA (3402 A HWY 271 SERVICE ROAD in POCOLA, OK) . Tribal Land
ENFORCEMENT/COMPLIANCE ACTIVITY (Integrated Compliance Information System)
GENERAL ARCHERY INDUSTRIES (1 ARCHERY LANE in POCOLA, OK) . Tribal Land
TRI REPORTER (Tracking of toxic chemicals releasing facilities) Business SIC classification: SPORTING AND ATHLETIC GOODS
Housing units lacking complete plumbing facilities: 0.5% Housing units lacking complete kitchen facilities: 0.9%
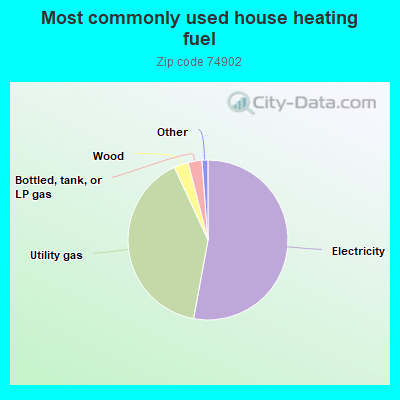
53.0%Electricity
40.3%Utility gas
2.9%Wood
2.8%Bottled, tank, or LP gas
0.7%Other fuel
0.5%Coal or coke
Population in 1990: 3,575. Population change in the 1990s: +864 (+24.2%).
Place of birth for U.S.-born residents:
This state: 1,129
Northeast: 4
Midwest: 189
South: 2,343
West: 610
65% of the 74902 zip code residents lived in the same house 5 years ago. Out of people who lived in different houses, 54% lived in this county. Out of people who lived in different counties, 50% lived in Oklahoma.
86% of the 74902 zip code residents lived in the same house 1 year ago. Out of people who lived in different houses, 49% moved from this county. Out of people who lived in different houses, 15% moved from different county within same state. Out of people who lived in different houses, 35% moved from different state.
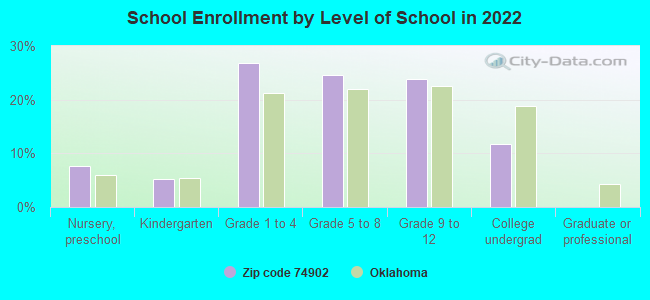
Private vs. public school enrollment:
Students in private schools in grades 1 to 8 (elementary and middle school): 14
Here:
2.8%
Oklahoma:
11.7%
Students in private schools in grades 9 to 12 (high school):
Here:
0.0%
Oklahoma:
11.7%
Students in private undergraduate colleges:
Here:
0.0%
Oklahoma:
19.3%
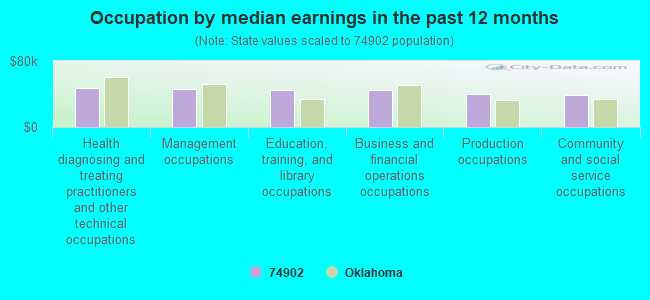
Occupation by median earnings in the past 12 months ($)
47,171Health diagnosing and treating practitioners and other technical occupations
46,511Management occupations
45,306Education, training, and library occupations
45,121Business and financial operations occupations
40,008Production occupations
38,467Community and social service occupations
Companies with federal contracts located in this zip code:
ARKANSAS BOX LLC (#1 ARCHERY LANE in POCOLA, OK; small business) : $68,366 in 4 contractsfrom 2003 to 2005
$34,655 with Army for Boxes, Cartons, and Crates. Taking place in AR. Signed on 2005-09-28. Completion date: 2005-10-28.
$18,735, same as above.Signed on 2005-12-21. Completion date: 2005-10-28.
$11,440, same as above.Signed on 2003-05-30. Completion date: 2003-08-01.
$3,536, same as above.Signed on 2003-03-25. Completion date: 2003-03-31.
SPEAKER TRAILER SALES (4105 SOUTH POCOLA BLVD in POCOLA, OK; small business)
$7,359 with Army for Trailers. Taking place in AR. Signed on 2004-09-15. Completion date: 2004-10-30.
Top industries in this zip code by the number of employees in 2005:
Other Services (except Public Administration): Commercial and Industrial Machinery and Equipment (except Automotive and Electronic) Repair and Maintenance (50-99 employees: 1 establishment, 20-49 employees: 1 establishment, 10-19 employees: 1 establishment)
Health Care and Social Assistance: Nursing Care Facilities (50-99: 1)
Accommodation and Food Services: Limited-Service Restaurants (10-19: 3)
Management of Companies and Enterprises: Corporate, Subsidiary, and Regional Managing Offices (20-49: 1)
Administrative and Support and Waste Management and Remediation Services: Security Systems Services (except Locksmiths) (20-49: 1)
Construction: Poured Concrete Foundation and Structure Contractors (20-49: 1)
Mining: Support Activities for Oil and Gas Operations (10-19: 2)
People in group quarters in 2010:
73 people in nursing facilities/skilled-nursing facilities
People in group quarters in 2000:
65 people in nursing homes
Fatal accident statistics in 2014:
Fatal accident count: 2
Vehicles involved in fatal accidents: 3
Fatal accidents caused by drunken drivers: 3
Fatalities: 2
Persons involved in fatal accidents: 3
Pedestrians involved in fatal accidents: 0
Home Mortgage Disclosure Act Aggregated Statistics For Year 2009 (Based on 2 full and 2 partial tracts)
A) FHA, FSA/RHS & VA Home Purchase Loans
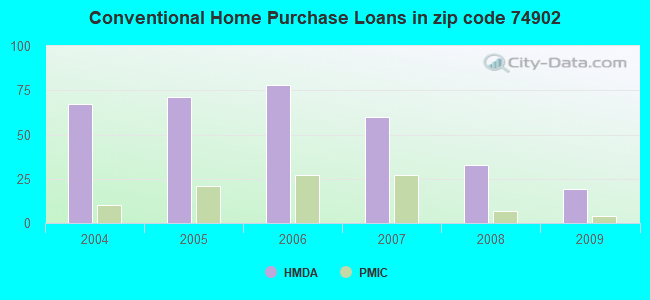
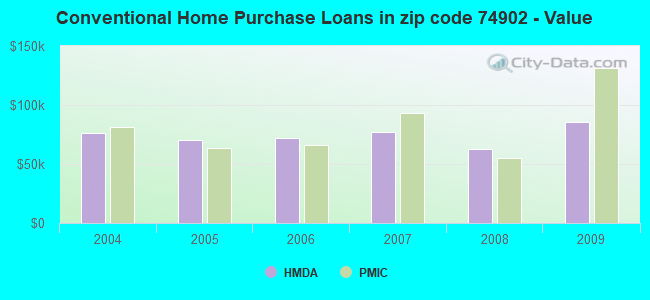
B) Conventional Home Purchase Loans
C) Refinancings
D) Home Improvement Loans
F) Non-occupant Loans on < 5 Family Dwellings (A B C & D)
G) Loans On Manufactured Home Dwelling (A B C & D)
Number
Average Value
Number
Average Value
Number
Average Value
Number
Average Value
Number
Average Value
Number
Average Value
LOANS ORIGINATED
33
$97,028
19
$85,349
80
$93,960
25
$29,533
6
$61,565
6
$8,178
APPLICATIONS APPROVED, NOT ACCEPTED
0
$0
2
$72,990
2
$88,935
3
$5,993
0
$0
2
$72,990
APPLICATIONS DENIED
9
$60,047
11
$70,178
51
$93,906
15
$34,363
0
$0
6
$39,577
APPLICATIONS WITHDRAWN
0
$0
4
$90,995
30
$106,284
6
$56,770
4
$72,990
0
$0
FILES CLOSED FOR INCOMPLETENESS
0
$0
2
$162,525
14
$74,102
0
$0
0
$0
0
$0
Aggregated Statistics For Year 2008 (Based on 2 full and 2 partial tracts)
A) FHA, FSA/RHS & VA Home Purchase Loans
B) Conventional Home Purchase Loans
C) Refinancings
D) Home Improvement Loans
F) Non-occupant Loans on < 5 Family Dwellings (A B C & D)
G) Loans On Manufactured Home Dwelling (A B C & D)
Number
Average Value
Number
Average Value
Number
Average Value
Number
Average Value
Number
Average Value
Number
Average Value
LOANS ORIGINATED
36
$90,417
33
$62,469
81
$81,286
35
$27,064
14
$50,054
12
$39,114
APPLICATIONS APPROVED, NOT ACCEPTED
0
$0
6
$56,030
9
$74,678
8
$13,838
0
$0
6
$57,208
APPLICATIONS DENIED
10
$64,464
20
$89,188
32
$87,527
22
$14,773
2
$29,190
8
$54,639
APPLICATIONS WITHDRAWN
6
$109,647
8
$66,645
27
$97,239
3
$41,770
6
$47,362
0
$0
FILES CLOSED FOR INCOMPLETENESS
0
$0
1
$83,080
4
$66,305
0
$0
2
$40,875
0
$0
Aggregated Statistics For Year 2007 (Based on 2 full and 2 partial tracts)
A) FHA, FSA/RHS & VA Home Purchase Loans
B) Conventional Home Purchase Loans
C) Refinancings
D) Home Improvement Loans
F) Non-occupant Loans on < 5 Family Dwellings (A B C & D)
G) Loans On Manufactured Home Dwelling (A B C & D)
Number
Average Value
Number
Average Value
Number
Average Value
Number
Average Value
Number
Average Value
Number
Average Value
LOANS ORIGINATED
31
$91,045
60
$77,494
84
$81,882
35
$25,996
14
$65,844
12
$52,552
APPLICATIONS APPROVED, NOT ACCEPTED
0
$0
4
$49,112
12
$74,288
12
$29,181
0
$0
4
$47,640
APPLICATIONS DENIED
7
$75,544
37
$77,405
83
$72,427
41
$21,527
2
$72,280
13
$51,501
APPLICATIONS WITHDRAWN
3
$97,757
8
$38,976
41
$74,768
1
$38,890
2
$30,170
4
$65,690
FILES CLOSED FOR INCOMPLETENESS
0
$0
4
$111,985
10
$87,190
0
$0
2
$72,990
0
$0
Aggregated Statistics For Year 2006 (Based on 2 full and 2 partial tracts)
A) FHA, FSA/RHS & VA Home Purchase Loans
B) Conventional Home Purchase Loans
C) Refinancings
D) Home Improvement Loans
F) Non-occupant Loans on < 5 Family Dwellings (A B C & D)
G) Loans On Manufactured Home Dwelling (A B C & D)
Number
Average Value
Number
Average Value
Number
Average Value
Number
Average Value
Number
Average Value
Number
Average Value
LOANS ORIGINATED
27
$80,517
78
$72,240
95
$77,056
40
$26,146
28
$49,523
14
$53,171
APPLICATIONS APPROVED, NOT ACCEPTED
0
$0
12
$47,703
12
$81,851
4
$24,818
0
$0
6
$52,228
APPLICATIONS DENIED
5
$86,962
47
$61,854
65
$77,306
24
$23,042
2
$72,015
24
$48,974
APPLICATIONS WITHDRAWN
2
$150,845
9
$90,084
42
$73,881
13
$22,004
0
$0
0
$0
FILES CLOSED FOR INCOMPLETENESS
0
$0
4
$73,172
14
$108,769
0
$0
2
$68,125
0
$0
Aggregated Statistics For Year 2005 (Based on 2 full and 2 partial tracts)
A) FHA, FSA/RHS & VA Home Purchase Loans
B) Conventional Home Purchase Loans
C) Refinancings
D) Home Improvement Loans
F) Non-occupant Loans on < 5 Family Dwellings (A B C & D)
G) Loans On Manufactured Home Dwelling (A B C & D)
Number
Average Value
Number
Average Value
Number
Average Value
Number
Average Value
Number
Average Value
Number
Average Value
LOANS ORIGINATED
31
$75,353
71
$69,991
86
$76,992
53
$22,341
16
$52,975
8
$27,492
APPLICATIONS APPROVED, NOT ACCEPTED
0
$0
9
$53,760
17
$59,560
5
$25,038
0
$0
12
$51,971
APPLICATIONS DENIED
10
$67,001
38
$57,528
74
$69,540
38
$35,288
2
$68,125
27
$54,843
APPLICATIONS WITHDRAWN
1
$69,230
13
$51,242
96
$73,759
16
$30,817
1
$113,720
4
$28,812
FILES CLOSED FOR INCOMPLETENESS
0
$0
0
$0
10
$95,317
0
$0
0
$0
0
$0
Aggregated Statistics For Year 2004 (Based on 2 full and 2 partial tracts)
A) FHA, FSA/RHS & VA Home Purchase Loans
B) Conventional Home Purchase Loans
C) Refinancings
D) Home Improvement Loans
F) Non-occupant Loans on < 5 Family Dwellings (A B C & D)
G) Loans On Manufactured Home Dwelling (A B C & D)
Detailed PMIC statistics for the following Tracts:0401.02
, 0401.98
2005 - 2018 National Fire Incident Reporting System (NFIRS) incidents
Based on the data from the years 2005 - 2018 the average number of fires per year is 18. The highest number of fire incidents - 48 took place in 2006, and the least - 4 in 2009. The data has a declining trend.
When looking into fire subcategories, the most incidents belonged to: Outside Fires (57.3%), and Structure Fires (31.4%).
Fire incident types reported to NFIRS in Zip Code 74902
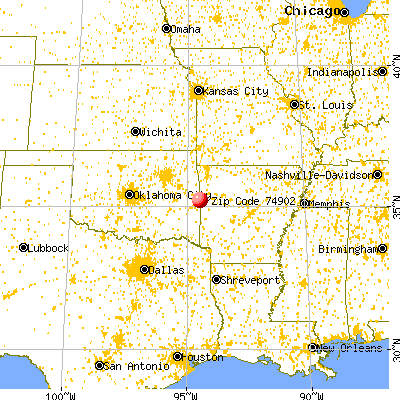


 Nearest zip codes: 72916, 72908, 74932, 74901, 72901, 74959.


 . Tribal Land
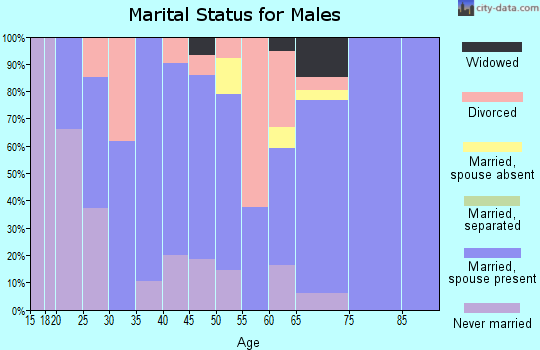
 Based on the data from the years 2005 - 2018 the average number of fires per year is 18. The highest number of fire incidents - 48 took place in 2006, and the least - 4 in 2009. The data has a declining trend.
 When looking into fire subcategories, the most incidents belonged to: Outside Fires (57.3%), and Structure Fires (31.4%).