Estimated zip code population in 2022: 11,390 Zip code population in 2010: 7,131 Zip code population in 2000: 5,243
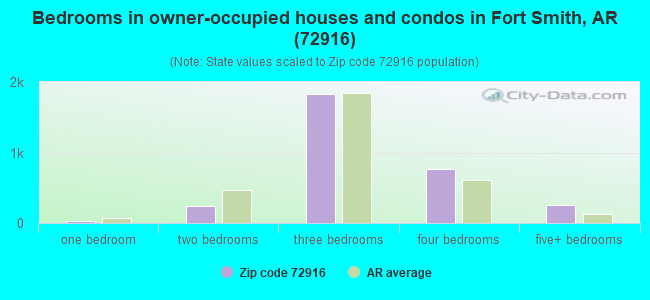
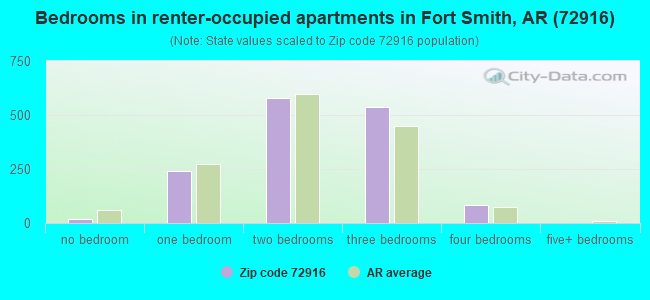
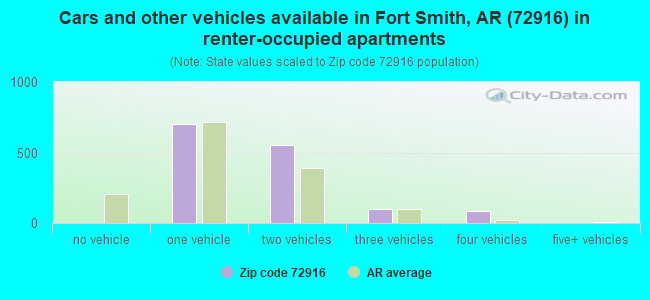
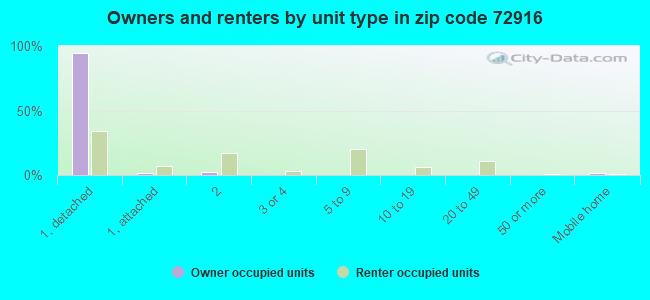
Houses and condos: 4,806 Renter-occupied apartments: 1,469
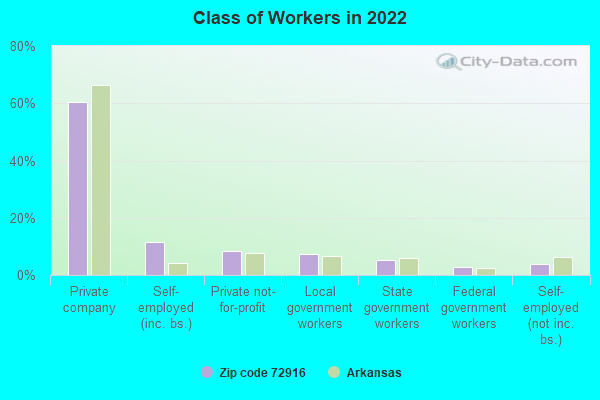
% of renters here:
32%
State:
34%
March 2022 cost of living index in zip code 72916: 80.7 (low, U.S. average is 100)
Land area: 34.6 sq. mi. Water area: 0.3 sq. mi.
Population density: 329 people per square mile
(very low).
OSM Map
General Map
Google Map
MSN Map
OSM Map
General Map
Google Map
MSN Map
OSM Map
General Map
Google Map
MSN Map
OSM Map
General Map
Google Map
MSN Map
Please wait while loading the map...
Real estate property taxes paid for housing units in 2022:
This zip code:
0.7% ($1,730)
Arkansas:
0.5% ($977)
Median real estate property taxes paid for housing units with mortgages in 2022: $1,855 (0.6%) Median real estate property taxes paid for housing units with no mortgage in 2022: $1,518 (0.6%)
Business Search- 14 Million verified businesses
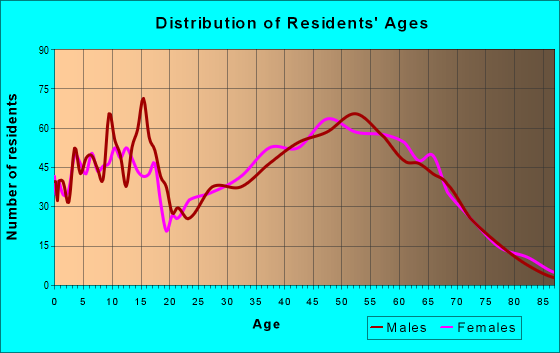
Males: 5,528
(48.5%)
Females: 5,862
(51.5%)
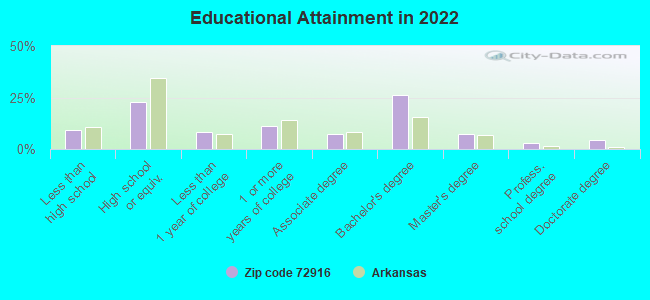
For population 25 years and over in 72916:
High school or higher: 92.3%
Bachelor's degree or higher: 41.5%
Graduate or professional degree: 14.8%
Unemployed: 0.9%
Mean travel time to work (commute): 21.9 minutes
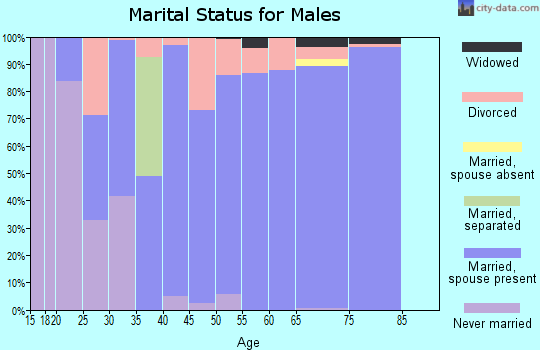
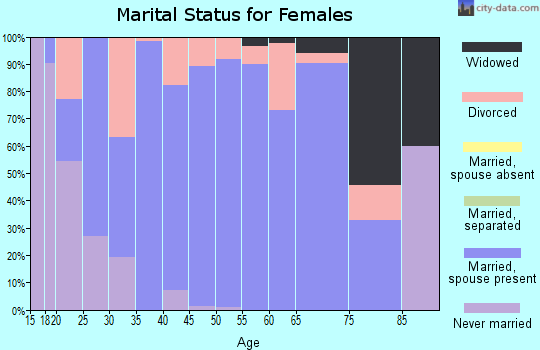
For population 15 years and over in 72916:
Never married: 20.9%
Now married: 61.4%
Separated: 0.9%
Widowed: 6.5%
Divorced: 10.4%
Zip code 72916 compared to state average:
Unemployed percentage significantly below state average.
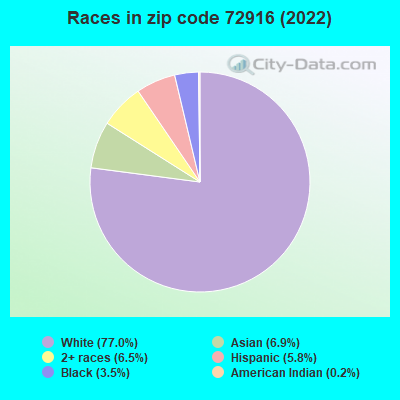
Black race population percentage significantly below state average.
Length of stay since moving in significantly below state average.
House age significantly below state average.
Percentage of population with a bachelor's degree or higher above state average.
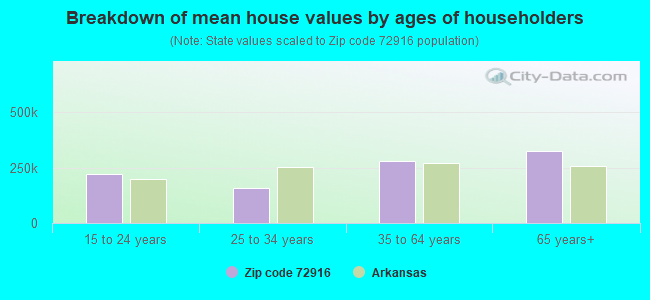
Estimated median house/condo value in 2022: $265,382
72916:
$265,382
Arkansas:
$179,800
According to our research of Arkansas and other state lists, there were 17 registered sex offenders living in 72916 zip code as of May 09, 2024. The ratio of all residents to sex offenders in zip code 72916 is 467 to 1. The ratio of registered sex offenders to all residents in this zip code is near the state average.
Median resident age:
This zip code:
38.5 years
Arkansas median age:
38.9 years
Average household size:
This zip code:
2.5 people
Arkansas:
2.4 people
Averages for the 2020 tax year for zip code 72916, filed in 2021:
Average Adjusted Gross Income (AGI) in 2020: $91,371 (Individual Income Tax Returns)
Here:
$91,371
State:
$64,872
Salary/wage: $76,189 (reported on 79.2% of returns)
Here:
$76,189
State:
$50,644
(% of AGI for various income ranges: 1155.3% for AGIs below $25k, 3514.0% for AGIs $25k-50k, 6381.3% for AGIs $50k-75k, 10131.0% for AGIs $75k-100k, 18043.9% for AGIs $100k-200k, 68455.0% for AGIs over 200k)
Taxable interest for individuals: $2,056 (reported on 40.3% of returns)
This zip code:
$2,056
Arkansas:
$1,857
(% of AGI for various income ranges: 33.8% for AGIs below $25k, 44.6% for AGIs $25k-50k, 68.3% for AGIs $50k-75k, 135.2% for AGIs $75k-100k, 204.7% for AGIs $100k-200k, 1060.7% for AGIs over 200k)
Ordinary dividends: $7,980 (reported on 22.5% of returns)
Here:
$7,980
State:
$21,681
(% of AGI for various income ranges: 36.4% for AGIs below $25k, 67.0% for AGIs $25k-50k, 104.7% for AGIs $50k-75k, 245.2% for AGIs $75k-100k, 307.8% for AGIs $100k-200k, 3417.1% for AGIs over 200k)
Net capital gain/loss in AGI: +$18,506 (reported on 21.9% of returns)
Here:
+$18,506
State:
+$22,815
(% of AGI for various income ranges: 11.1% for AGIs below $25k, 43.6% for AGIs $25k-50k, 68.5% for AGIs $50k-75k, 229.3% for AGIs $75k-100k, 710.6% for AGIs $100k-200k, 9867.9% for AGIs over 200k)
Profit/loss from business: +$11,790 (reported on 17.1% of returns)
Here:
+$11,790
State:
+$9,743
(% of AGI for various income ranges: 120.1% for AGIs below $25k, 148.7% for AGIs $25k-50k, 145.1% for AGIs $50k-75k, 223.4% for AGIs $75k-100k, 361.6% for AGIs $100k-200k, 2904.3% for AGIs over 200k)
Taxable individual retirement arrangement distribution: $25,207 (reported on 12.3% of returns)
72916:
$25,207
Arkansas:
$18,502
(% of AGI for various income ranges: 84.6% for AGIs below $25k, 180.4% for AGIs $25k-50k, 324.3% for AGIs $50k-75k, 481.4% for AGIs $75k-100k, 1080.2% for AGIs $100k-200k, 2938.6% for AGIs over 200k)
Total itemized deductions: $45,028 (reported on 10.8% of returns)
Here:
$45,028
State:
$52,840
(% of AGI for various income ranges: 135.9% for AGIs $25k-50k, 182.1% for AGIs $50k-75k, 605.2% for AGIs $75k-100k, 1291.8% for AGIs $100k-200k, 9015.7% for AGIs over 200k)
Charity contributions: $15,259 (reported on 9.5% of returns)
Here:
$15,259
State:
$35,735
(% of AGI for various income ranges: 23.8% for AGIs below $25k, 36.6% for AGIs $50k-75k, 165.5% for AGIs $75k-100k, 391.6% for AGIs $100k-200k, 2802.9% for AGIs over 200k)
Taxes paid: $8,142 (reported on 10.8% of returns)
72916:
$8,142
State:
$7,196
(% of AGI for various income ranges: 23.1% for AGIs $25k-50k, 33.8% for AGIs $50k-75k, 119.3% for AGIs $75k-100k, 323.3% for AGIs $100k-200k, 1300.0% for AGIs over 200k)
Earned income credit: $2,128 (reported on 11.7% of returns)
Here:
$2,128
State:
$2,546
(% of AGI for various income ranges: 79.5% for AGIs below $25k, 59.7% for AGIs $25k-50k)
Percentage of individuals using paid preparers for their 2020 taxes: 95.5%
Here:
95%
State:
94%
(% for various income ranges: 95.3% for AGIs below $25k, 94.6% for AGIs $25k-50k, 95.5% for AGIs $50k-75k, 95.8% for AGIs $75k-100k, 95.5% for AGIs $100k-200k, 97.4% for AGIs over 200k)
Averages for the 2012 tax year for zip code 72916, filed in 2013:
Average Adjusted Gross Income (AGI) in 2012: $83,908 (Individual Income Tax Returns)
Here:
$83,908
State:
$52,148
Salary/wage: $64,743 (reported on 84.3% of returns)
Here:
$64,743
State:
$41,669
(% of AGI for various income ranges: 73.2% for AGIs below $25k, 76.6% for AGIs $25k-50k, 76.3% for AGIs $50k-75k, 79.2% for AGIs $75k-100k, 76.7% for AGIs $100k-200k, 44.6% for AGIs over 200k)
Taxable interest for individuals: $1,961 (reported on 43.4% of returns)
This zip code:
$1,961
Arkansas:
$1,648
(% of AGI for various income ranges: 2.6% for AGIs below $25k, 0.8% for AGIs $25k-50k, 0.7% for AGIs $50k-75k, 0.8% for AGIs $75k-100k, 0.8% for AGIs $100k-200k, 1.2% for AGIs over 200k)
Ordinary dividends: $6,311 (reported on 22.9% of returns)
Here:
$6,311
State:
$20,675
(% of AGI for various income ranges: 1.8% for AGIs below $25k, 1.0% for AGIs $25k-50k, 1.1% for AGIs $50k-75k, 0.8% for AGIs $75k-100k, 1.2% for AGIs $100k-200k, 2.8% for AGIs over 200k)
Net capital gain/loss in AGI: +$16,443 (reported on 18.0% of returns)
Here:
+$16,443
State:
+$15,222
(% of AGI for various income ranges: 0.3% for AGIs $50k-75k, 1.5% for AGIs $100k-200k, 8.5% for AGIs over 200k)
Profit/loss from business: +$11,456 (reported on 16.3% of returns)
Here:
+$11,456
State:
+$9,665
(% of AGI for various income ranges: 6.0% for AGIs below $25k, 3.4% for AGIs $25k-50k, 2.3% for AGIs $50k-75k, 1.5% for AGIs $75k-100k, 1.2% for AGIs $100k-200k, 2.5% for AGIs over 200k)
Taxable individual retirement arrangement distribution: $17,443 (reported on 12.0% of returns)
72916:
$17,443
Arkansas:
$13,644
(% of AGI for various income ranges: 5.7% for AGIs below $25k, 3.9% for AGIs $25k-50k, 2.8% for AGIs $50k-75k, 2.7% for AGIs $75k-100k, 2.8% for AGIs $100k-200k, 1.4% for AGIs over 200k)
Total itemized deductions: $30,455 (21% of AGI, reported on 43.4% of returns)
Here:
$30,455
State:
$23,276
Here:
20.8% of AGI
State:
19.1% of AGI
(% of AGI for various income ranges: 10.3% for AGIs below $25k, 10.6% for AGIs $25k-50k, 13.4% for AGIs $50k-75k, 14.3% for AGIs $75k-100k, 16.5% for AGIs $100k-200k, 18.4% for AGIs over 200k)
Charity contributions: $7,321 (reported on 36.0% of returns)
Here:
$7,321
State:
$5,996
(% of AGI for various income ranges: 1.3% for AGIs below $25k, 1.6% for AGIs $25k-50k, 2.3% for AGIs $50k-75k, 3.0% for AGIs $75k-100k, 3.5% for AGIs $100k-200k, 3.8% for AGIs over 200k)
Taxes paid: $10,511 (reported on 43.4% of returns)
72916:
$10,511
State:
$7,941
(% of AGI for various income ranges: 1.7% for AGIs below $25k, 2.2% for AGIs $25k-50k, 3.9% for AGIs $50k-75k, 4.5% for AGIs $75k-100k, 6.3% for AGIs $100k-200k, 7.0% for AGIs over 200k)
Earned income credit: $2,130 (reported on 11.4% of returns)
Here:
$2,130
State:
$2,455
(% of AGI for various income ranges: 4.9% for AGIs below $25k, 0.9% for AGIs $25k-50k)
Percentage of individuals using paid preparers for their 2012 taxes: 62.9%
Here:
63%
State:
61%
(% for various income ranges: 56.3% for AGIs below $25k, 63.4% for AGIs $25k-50k, 61.8% for AGIs $50k-75k, 64.4% for AGIs $75k-100k, 65.5% for AGIs $100k-200k, 85.7% for AGIs over 200k)
Averages for the 2004 tax year for zip code 72916, filed in 2005:
Average Adjusted Gross Income (AGI) in 2004: $62,255 (Individual Income Tax Returns)
Here:
$62,255
State:
$39,270
Salary/wage: $53,557 (reported on 86.2% of returns)
Here:
$53,557
State:
$34,079
(% of AGI for various income ranges: 120.7% for AGIs below $10k, 73.2% for AGIs $10k-25k, 82.3% for AGIs $25k-50k, 86.4% for AGIs $50k-75k, 81.5% for AGIs $75k-100k, 63.7% for AGIs over 100k)
Taxable interest for individuals: $2,134 (reported on 51.6% of returns)
This zip code:
$2,134
Arkansas:
$1,904
(% of AGI for various income ranges: 5.9% for AGIs below $10k, 3.2% for AGIs $10k-25k, 2.0% for AGIs $25k-50k, 1.0% for AGIs $50k-75k, 1.1% for AGIs $75k-100k, 2.0% for AGIs over 100k)
Taxable dividends: $2,889 (reported on 25.1% of returns)
Here:
$2,889
State:
$5,995
(% of AGI for various income ranges: 2.1% for AGIs below $10k, 1.5% for AGIs $10k-25k, 0.7% for AGIs $25k-50k, 0.8% for AGIs $50k-75k, 0.7% for AGIs $75k-100k, 1.6% for AGIs over 100k)
Net capital gain/loss: +$9,728 (reported on 21.6% of returns)
Here:
+$9,728
State:
+$10,430
(% of AGI for various income ranges: -2.6% for AGIs below $10k, 0.7% for AGIs $10k-25k, 0.9% for AGIs $25k-50k, 0.8% for AGIs $50k-75k, 0.8% for AGIs $75k-100k, 6.4% for AGIs over 100k)
Profit/loss from business: +$5,831 (reported on 17.2% of returns)
Here:
+$5,831
State:
+$7,823
(% of AGI for various income ranges: 14.4% for AGIs below $10k, 4.9% for AGIs $10k-25k, 3.3% for AGIs $25k-50k, 2.2% for AGIs $50k-75k, 1.6% for AGIs $75k-100k, 0.3% for AGIs over 100k)
IRA payment deduction: $3,470 (reported on 4.3% of returns)
72916:
$3,470
Arkansas:
$3,204
(% of AGI for various income ranges: 1.9% for AGIs below $10k, 0.5% for AGIs $25k-50k, 0.4% for AGIs $50k-75k, 0.2% for AGIs $75k-100k, 0.1% for AGIs over 100k)
Total itemized deductions: $21,116 (20% of AGI, reported on 42.6% of returns)
Here:
$21,116
State:
$18,389
Here:
19.8% of AGI
State:
21.0% of AGI
(% of AGI for various income ranges: 17.5% for AGIs below $10k, 11.3% for AGIs $10k-25k, 11.1% for AGIs $25k-50k, 13.3% for AGIs $50k-75k, 16.6% for AGIs $75k-100k, 15.4% for AGIs over 100k)
Charity contributions deductions: $4,876 (4% of AGI, reported on 38.3% of returns)
Here:
$4,876
State:
$4,725
Here:
4.4% of AGI
State:
5.1% of AGI
(% of AGI for various income ranges: 1.8% for AGIs below $10k, 2.1% for AGIs $10k-25k, 1.9% for AGIs $25k-50k, 2.4% for AGIs $50k-75k, 3.2% for AGIs $75k-100k, 3.6% for AGIs over 100k)
Total tax: $10,449 (reported on 80.9% of returns)
72916:
$10,449
State:
$6,047
(% of AGI for various income ranges: 4.3% for AGIs below $10k, 4.1% for AGIs $10k-25k, 6.5% for AGIs $25k-50k, 8.6% for AGIs $50k-75k, 10.2% for AGIs $75k-100k, 19.9% for AGIs over 100k)
Earned income credit: $1,702 (reported on 10.3% of returns)
Here:
$1,702
State:
$1,909
Percentage of individuals using paid preparers for their 2004 taxes: 68.7%
Here:
69%
State:
67%
(% for various income ranges: 63.3% for AGIs below $10k, 70.6% for AGIs $10k-25k, 71.0% for AGIs $25k-50k, 64.9% for AGIs $50k-75k, 69.5% for AGIs $75k-100k, 73.2% for AGIs over 100k)
Likely homosexual households (counted as self-reported same-sex unmarried-partner households)
Lesbian couples: 0.0% of all households
Gay men: 0.4% of all households
Household received Food Stamps/SNAP in the past 12 months: 124 Household did not receive Food Stamps/SNAP in the past 12 months: 4,474
Women who had a birth in the past 12 months: 386 (361 now married, 32 unmarried) Women who did not have a birth in the past 12 months: 2,095 (1,259 now married, 840 unmarried)
Housing units in zip code 72916 with a mortgage: 1,656 (183 second mortgage, 1 home equity loan, 77 both second mortgage and home equity loan) Houses without a mortgage: 252
Median monthly owner costs for units with a mortgage: $1,572 Median monthly owner costs for units without a mortgage: $490
Residents with income below the poverty level in 2022:
This zip code:
8.4%
Whole state:
16.8%
Residents with income below 50% of the poverty level in 2022:
This zip code:
4.7%
Whole state:
8.5%
Median number of rooms in houses and condos:
Here:
6.2
State:
6.1
Median number of rooms in apartments:
Here:
4.3
State:
4.3
Notable locations in this zip code not listed on our city pages
Notable locations in zip code 72916: Rye Hill (A), City of Fort Smith Landfill (B), Bonanza Police Department (C), Bonanza Fire Station (D), White Bluff - Rye Hill Fire Department Station A (E), White Bluff - Rye Hill Fire Department Station B (F), Fort Smith Fire Department Station 10 (G). Display/hide their locations on the map
In group quarters: 26 (-1 institutionalized population)
Size of family households: 1,677 2-persons, 644 3-persons, 502 4-persons, 165 5-persons, 186 6-persons, 18 7-or-more-persons
Size of nonfamily households: 1,136 1-person, 214 2-persons, 19 4-persons
1,779 married couples with children.
604 single-parent households (165 men, 439 women).
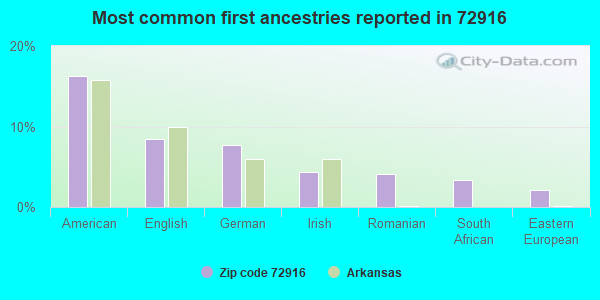
89.3% of residents of 72916 zip code speak English at home.
2.9% of residents speak Spanish at home (88% very well, 12% well).
3.1% of residents speak other Indo-European language at home (100% very well).
4.6% of residents speak Asian or Pacific Island language at home (62% very well, 21% well, 18% not well).
0.1% of residents speak other language at home (100% very well).
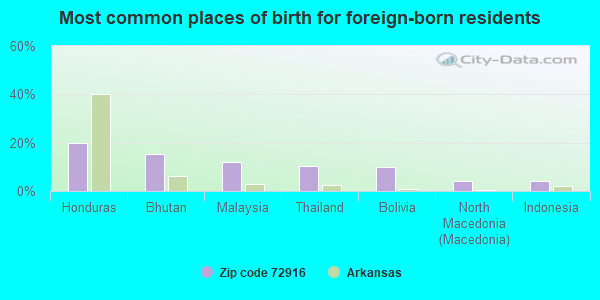
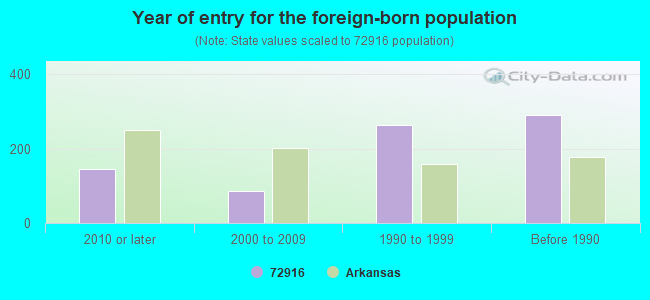
Foreign born population: 742 (6.5%) (74.1% of them are naturalized citizens)
Facilities with environmental interests located in this zip code:
AMERICAN STANDARD AIRESYSTEMS DIVISION (9900 AIRE CIRCLE in FORT SMITH, AR)
HAZARDOUS WASTE BIENNIAL REPORTER (Resource Conservation and Recovery Act (tracking hazardous waste)) Small Quantity Generators, between 100 kg and 1000 kg of hazardous waste/month (Resource Conservation and Recovery Act (tracking hazardous waste)) - notification TRI REPORTER (Tracking of toxic chemicals releasing facilities) Business SIC and NAICS classification: AIR-CONDITIONING AND WARM AIR HEATING EQUIPMENT AND COMMERCIAL AND INDUSTRIAL REFRIGERATION EQUIPMENT Organizations: AMERICAN STANDARD INC (CONTACT/OPERATOR)
, AIRESYSTEMS-AMERICAN STANDARD (CONTACT/OPERATOR)
Alternative names: AIRE SYSTEMS A DIV OF AMERICAN STANDARD, AMERICAN STANDARD INC. AIRESYSTEMS, AMERICAN STANDARD INC. AIRESYSTEMS DIV., AMERICAN STANDARD INC. AIRESYSTEMS
BLACK STONE RESIDENTIAL DEV. (SOUTH/HIGHWAY 45 (CRYSTAL CRT) in FORT SMITH, AR)
National Pollutant Discharge Elimination System NON-MAJOR (Tracking pollutant discharge elimination systems) - permit Business SIC classification: LAND SUBDIVIDERS AND DEVELOPERS, EXCEPT CEMETERIES Alternative names: SOUTHERN HILLS LLC - BLACK, SOUTHERN HILLS LLC-BLACK STONE
BOB IKENBERRY CUSTOM HOMES (3600 COVENTRY LANE in FORT SMITH, AR)
National Pollutant Discharge Elimination System NON-MAJOR (Tracking pollutant discharge elimination systems) - permit Business SIC classification: MANAGEMENT SERVICES
FORT SMITH OFFICE & SHOP (800 OLD HWY. 271 SOUTH in FORT SMITH, AR)
National Pollutant Discharge Elimination System NON-MAJOR (Tracking pollutant discharge elimination systems) - permit Business SIC classification: OIL AND GAS FIELD SERVICES
SOUTH 71 PROPERTIES (14904 HWY. 71 SOUTH in FORT SMITH, AR)
National Pollutant Discharge Elimination System NON-MAJOR (Tracking pollutant discharge elimination systems) - permit Business SIC classification: MANAGEMENT SERVICES
CENTERPOINT ENERGY/BONANZA CENTRAL POINT (2.1 MILES EAST BEAR HOLLOW RD. in BONANZA, AR, AR)
AIR SYNTHETIC MINOR (AIRS/AFS) Business SIC classification: NATURAL GAS TRANSMISSION
FORT SMITH LANDFILL (9702 45 HWY in FORT SMITH, AR)
CRITERIA AND HAZARDOUS AIR POLLUTANT INVENTORY (Inventory of air pollution sources) Business SIC classification: REFUSE SYSTEMS Business NAICS classification: SOLID WASTE LANDFILL.
FORT SMITH SANITARY LANDFILL, CITY OF (5900 COMMERCE ROAD in FORT SMITH, AR)
AIR SYNTHETIC MINOR (AIRS/AFS) Business SIC classification: REFUSE SYSTEMS Alternative names: CITY OF FORT SMITH SANITARY LANDFILL
INTERNATIONAL MILL SERVICE (5225 PLANTERS RD FORT SMITH, AR 72916 in FORT SMITH, AR)
CRITERIA AND HAZARDOUS AIR POLLUTANT INVENTORY (Inventory of air pollution sources) Business SIC classification: STEEL WORKS, BLAST FURNACES (INCLUDING COKE OVENS), AND ROLLING MILLS
Housing units lacking complete plumbing facilities: 0.1% Housing units lacking complete kitchen facilities: 3.1%
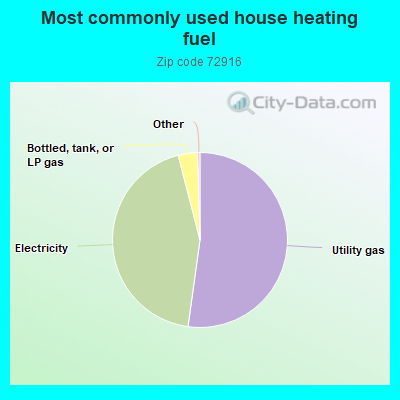
52.2%Utility gas
43.8%Electricity
3.6%Bottled, tank, or LP gas
Population in 1990: 3,494. Population change in the 1990s: +1,749 (+50.1%).
Place of birth for U.S.-born residents:
This state: 6,476
Northeast: 172
Midwest: 1,684
South: 1,628
West: 623
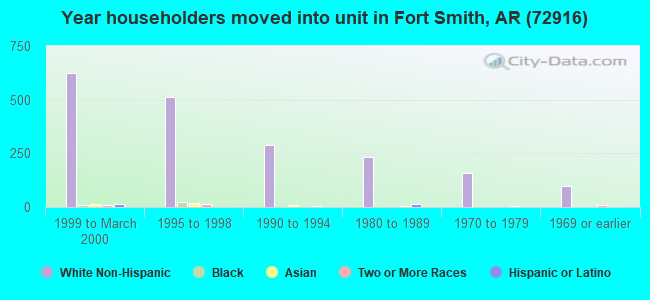
45% of the 72916 zip code residents lived in the same house 5 years ago. Out of people who lived in different houses, 61% lived in this county. Out of people who lived in different counties, 50% lived in Arkansas.
85% of the 72916 zip code residents lived in the same house 1 year ago. Out of people who lived in different houses, 35% moved from this county. Out of people who lived in different houses, 23% moved from different county within same state. Out of people who lived in different houses, 47% moved from different state.
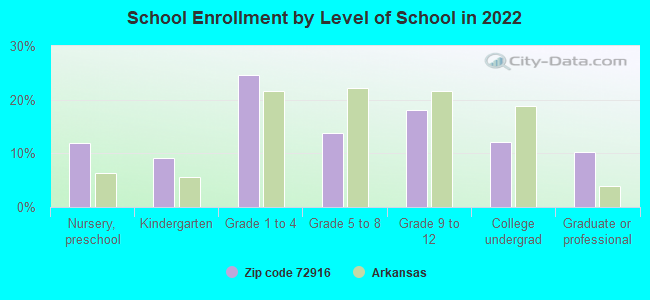
Private vs. public school enrollment:
Students in private schools in grades 1 to 8 (elementary and middle school): 153
Here:
16.6%
Arkansas:
10.5%
Students in private schools in grades 9 to 12 (high school): 17
Here:
4.1%
Arkansas:
8.7%
Students in private undergraduate colleges: 62
Here:
21.1%
Arkansas:
19.4%
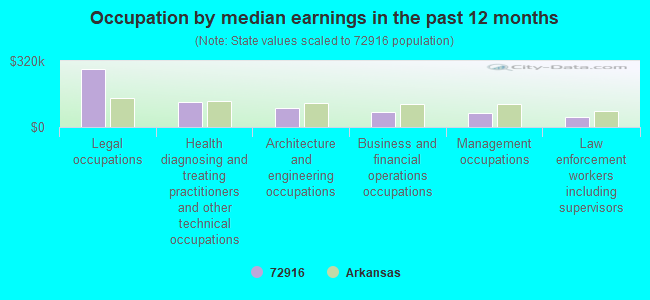
Occupation by median earnings in the past 12 months ($)
282,635Legal occupations
119,810Health diagnosing and treating practitioners and other technical occupations
93,568Architecture and engineering occupations
71,135Business and financial operations occupations
67,482Management occupations
47,547Law enforcement workers including supervisors
Companies with federal contracts located in this zip code (FORT SMITH, AR):
LOVVORN WHOLESALE LUMBER CORPO (515 PHOENIX AVENUE; small business) : $85,225 in 5 contractsfrom 2001 to 2003
Contracts for Maintenance, Repair and Rebuilding of Equipment -- Containers, Packaging, and Packing Supplies by Army Signed by year:2000: $0; 2001: $105,464; 2002: $7,100; 2003: -$27,339; 2004: $0; 2005: $0; 2006: $0.
Biggest contracts:
$91,263 with Army for Maintenance, Repair and Rebuilding of Equipment -- Containers, Packaging, and Packing Supplies. Signed on 2001-10-24. Completion date: 2002-09-30.
$14,201, same as above.Signed on 2001-12-06. Completion date: 2002-09-30.
$7,100, same as above.Signed on 2002-05-08. Completion date: 2002-09-30.
-$6,480, same as above.Signed on 2003-09-22. Completion date: 2002-09-30.
COOPER CLINIC PA (4300 REGIONS PARK DR; small business) : $28,625 in 5 contractsfrom 2003 to 2004
Contracts for Medical and Surgical Instruments, Equipment, and Supplies, Other Medical Services, Invalid code: AN47 by Army Signed by year:2000: $0; 2001: $0; 2002: $0; 2003: $6,661; 2004: $21,964; 2005: $0; 2006: $0.
Biggest contracts:
$7,341 with Army for Medical and Surgical Instruments, Equipment, and Supplies. Signed on 2004-12-17. Completion date: 2005-09-30.
$7,153, same as above.Signed on 2004-04-26. Completion date: 2004-04-26.
$7,015 with Army for Other Medical Services. Signed on 2004-01-08. Completion date: 2004-01-02.
$6,661 with Army for Invalid code: AN47. Signed on 2003-02-04. Completion date: 2002-12-01.
HASSETT, PHIL INCORPORATED (10614 HWY 253; small business)
$22,394 with Army for Maintenance, Repair and Rebuilding of Equipment -- Ground Effect Vehicles, Motor Vehicles, Trailers, and Cycles. Signed on 2005-09-10. Completion date: 2005-11-10.
DCS RADIO COMMUNICATION INC (6637 OLD HARRISON LANE; small business)
$17,722 with Army for Radio and Television Communication Equipment, Except Airborne. Signed on 2003-06-06. Completion date: 2003-06-06.
J F H EQUIPMENT & SERVICE INC (12417 HIGHWAY 71 S; small business)
$6,555 with Army for Motor Vehicle Maintenance and Repair Shop Specialized Equipment. Signed on 2005-06-27. Completion date: 2005-07-15.
RESTORATION SPECIALISTS (5504 STEEP HILL RD; small business)
$4,697 with Army for Custodial Janitorial Services. Signed on 2003-09-24. Completion date: 2003-11-28.
ECONOMY FEED & TACK (11318 HIGHWAY 71 S; small business)
$2,930 with Army for Trailers. Signed on 2002-08-26. Completion date: 2002-08-30.
ACE FENCE COMPANY INC (11418 OLD HWY 71 SO; small business)
$2,600 with Army for Fencing, Fences, Gates and Components. Signed on 2002-05-03. Completion date: 2002-06-02.
Top industries in this zip code by the number of employees in 2005:
Health Care and Social Assistance: Specialty (except Psychiatric and Substance Abuse) Hospitals (100-249 employees: 1 establishment)
Administrative and Support and Waste Management and Remediation Services: Temporary Help Services (50-99: 1, 20-49: 1)
Wholesale Trade: Tobacco and Tobacco Product Merchant Wholesalers (50-99: 1)
Construction: Commercial and Institutional Building Construction (20-49: 2)
Fatal accident statistics in 2014:
Fatal accident count: 1
Vehicles involved in fatal accidents: 2
Fatal accidents caused by drunken drivers: 0
Fatalities: 1
Persons involved in fatal accidents: 2
Pedestrians involved in fatal accidents: 0
Fatal accident statistics in 2013:
Fatal accident count: 1
Vehicles involved in fatal accidents: 2
Fatal accidents caused by drunken drivers: 0
Fatalities: 1
Persons involved in fatal accidents: 2
Pedestrians involved in fatal accidents: 0
Home Mortgage Disclosure Act Aggregated Statistics For Year 2009 (Based on 8 partial tracts)
A) FHA, FSA/RHS & VA Home Purchase Loans
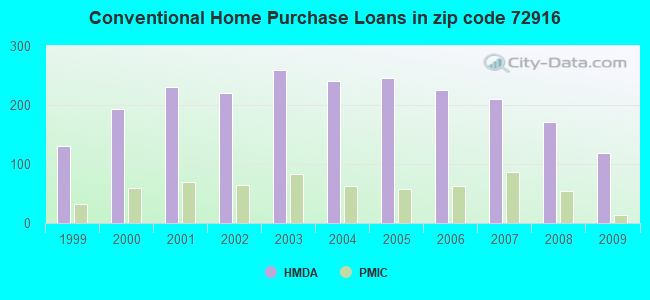
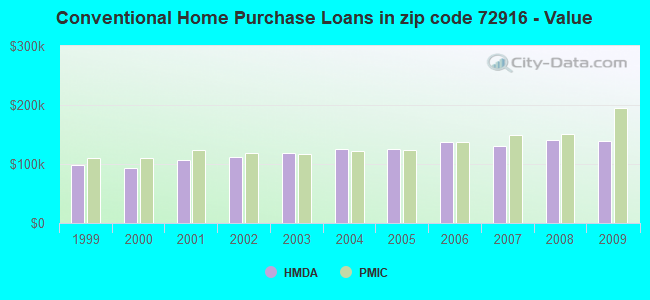
B) Conventional Home Purchase Loans
C) Refinancings
D) Home Improvement Loans
F) Non-occupant Loans on < 5 Family Dwellings (A B C & D)
G) Loans On Manufactured Home Dwelling (A B C & D)
Number
Average Value
Number
Average Value
Number
Average Value
Number
Average Value
Number
Average Value
Number
Average Value
LOANS ORIGINATED
149
$136,158
119
$139,666
343
$145,776
55
$37,596
45
$112,580
16
$30,933
APPLICATIONS APPROVED, NOT ACCEPTED
4
$112,925
8
$107,954
12
$144,610
8
$31,941
3
$56,617
2
$39,255
APPLICATIONS DENIED
15
$126,365
19
$78,676
90
$138,834
22
$32,255
4
$135,640
11
$43,543
APPLICATIONS WITHDRAWN
9
$87,446
9
$103,016
61
$139,218
5
$44,090
3
$121,013
1
$41,730
FILES CLOSED FOR INCOMPLETENESS
1
$84,890
0
$0
11
$149,513
0
$0
1
$36,950
0
$0
Aggregated Statistics For Year 2008 (Based on 8 partial tracts)
A) FHA, FSA/RHS & VA Home Purchase Loans
B) Conventional Home Purchase Loans
C) Refinancings
D) Home Improvement Loans
F) Non-occupant Loans on < 5 Family Dwellings (A B C & D)
G) Loans On Manufactured Home Dwelling (A B C & D)
Number
Average Value
Number
Average Value
Number
Average Value
Number
Average Value
Number
Average Value
Number
Average Value
LOANS ORIGINATED
122
$126,174
171
$141,155
200
$142,804
77
$38,492
61
$108,921
11
$37,040
APPLICATIONS APPROVED, NOT ACCEPTED
3
$159,960
8
$83,696
9
$173,861
3
$28,153
0
$0
6
$48,495
APPLICATIONS DENIED
16
$125,595
26
$90,940
74
$129,917
18
$23,192
4
$108,598
13
$47,427
APPLICATIONS WITHDRAWN
6
$108,160
15
$135,705
45
$128,543
5
$47,518
8
$85,006
0
$0
FILES CLOSED FOR INCOMPLETENESS
1
$185,500
3
$135,743
13
$220,931
0
$0
0
$0
0
$0
Aggregated Statistics For Year 2007 (Based on 8 partial tracts)
A) FHA, FSA/RHS & VA Home Purchase Loans
B) Conventional Home Purchase Loans
C) Refinancings
D) Home Improvement Loans
E) Loans on Dwellings For 5+ Families
F) Non-occupant Loans on < 5 Family Dwellings (A B C & D)
G) Loans On Manufactured Home Dwelling (A B C & D)
Number
Average Value
Number
Average Value
Number
Average Value
Number
Average Value
Number
Average Value
Number
Average Value
Number
Average Value
LOANS ORIGINATED
88
$115,836
211
$129,729
202
$136,715
98
$39,691
4
$496,398
51
$94,140
17
$39,202
APPLICATIONS APPROVED, NOT ACCEPTED
1
$104,500
11
$112,429
19
$127,687
7
$33,564
0
$0
2
$64,825
5
$65,482
APPLICATIONS DENIED
7
$107,384
36
$91,825
79
$121,066
25
$21,804
0
$0
10
$97,643
11
$49,105
APPLICATIONS WITHDRAWN
2
$92,510
17
$147,718
48
$132,223
13
$29,412
1
$121,600
7
$108,171
3
$41,540
FILES CLOSED FOR INCOMPLETENESS
0
$0
1
$175,390
12
$157,937
2
$83,370
0
$0
1
$85,550
0
$0
Aggregated Statistics For Year 2006 (Based on 8 partial tracts)
A) FHA, FSA/RHS & VA Home Purchase Loans
B) Conventional Home Purchase Loans
C) Refinancings
D) Home Improvement Loans
E) Loans on Dwellings For 5+ Families
F) Non-occupant Loans on < 5 Family Dwellings (A B C & D)
G) Loans On Manufactured Home Dwelling (A B C & D)
Number
Average Value
Number
Average Value
Number
Average Value
Number
Average Value
Number
Average Value
Number
Average Value
Number
Average Value
LOANS ORIGINATED
83
$96,870
226
$137,233
209
$130,828
102
$40,060
1
$88,420
53
$87,486
15
$42,281
APPLICATIONS APPROVED, NOT ACCEPTED
3
$67,290
22
$102,288
23
$98,062
10
$42,324
0
$0
1
$102,170
12
$40,075
APPLICATIONS DENIED
10
$82,190
46
$86,445
94
$104,162
36
$25,818
0
$0
6
$46,365
18
$49,034
APPLICATIONS WITHDRAWN
4
$96,028
27
$110,261
65
$131,396
10
$27,581
0
$0
8
$76,612
1
$68,780
FILES CLOSED FOR INCOMPLETENESS
1
$142,070
6
$125,785
17
$94,182
0
$0
0
$0
0
$0
0
$0
Aggregated Statistics For Year 2005 (Based on 8 partial tracts)
A) FHA, FSA/RHS & VA Home Purchase Loans
B) Conventional Home Purchase Loans
C) Refinancings
D) Home Improvement Loans
E) Loans on Dwellings For 5+ Families
F) Non-occupant Loans on < 5 Family Dwellings (A B C & D)
G) Loans On Manufactured Home Dwelling (A B C & D)
Number
Average Value
Number
Average Value
Number
Average Value
Number
Average Value
Number
Average Value
Number
Average Value
Number
Average Value
LOANS ORIGINATED
79
$97,433
245
$124,836
261
$112,839
129
$40,645
1
$309,870
71
$74,607
23
$43,684
APPLICATIONS APPROVED, NOT ACCEPTED
2
$61,920
16
$96,156
26
$113,285
7
$28,047
0
$0
3
$57,583
7
$42,886
APPLICATIONS DENIED
8
$89,332
46
$89,434
98
$101,809
38
$23,490
0
$0
10
$85,259
21
$37,290
APPLICATIONS WITHDRAWN
10
$105,459
29
$133,168
87
$109,805
16
$111,582
0
$0
6
$142,100
3
$67,757
FILES CLOSED FOR INCOMPLETENESS
2
$82,940
6
$263,740
16
$122,934
0
$0
0
$0
3
$71,143
0
$0
Aggregated Statistics For Year 2004 (Based on 8 partial tracts)
A) FHA, FSA/RHS & VA Home Purchase Loans
B) Conventional Home Purchase Loans
C) Refinancings
D) Home Improvement Loans
E) Loans on Dwellings For 5+ Families
F) Non-occupant Loans on < 5 Family Dwellings (A B C & D)
G) Loans On Manufactured Home Dwelling (A B C & D)
Number
Average Value
Number
Average Value
Number
Average Value
Number
Average Value
Number
Average Value
Number
Average Value
Number
Average Value
LOANS ORIGINATED
82
$91,013
240
$125,444
321
$103,872
95
$35,102
2
$77,805
66
$85,918
17
$43,122
APPLICATIONS APPROVED, NOT ACCEPTED
1
$47,380
17
$129,872
41
$98,786
6
$27,133
0
$0
3
$56,090
8
$36,241
APPLICATIONS DENIED
11
$76,389
67
$106,943
115
$91,943
34
$24,541
0
$0
12
$78,375
24
$49,354
APPLICATIONS WITHDRAWN
7
$98,996
28
$114,826
78
$116,739
7
$18,203
0
$0
6
$50,073
1
$64,100
FILES CLOSED FOR INCOMPLETENESS
3
$87,193
4
$121,340
22
$123,723
0
$0
0
$0
0
$0
0
$0
Aggregated Statistics For Year 2003 (Based on 8 partial tracts)
A) FHA, FSA/RHS & VA Home Purchase Loans
B) Conventional Home Purchase Loans
C) Refinancings
D) Home Improvement Loans
E) Loans on Dwellings For 5+ Families
F) Non-occupant Loans on < 5 Family Dwellings (A B C & D)
Number
Average Value
Number
Average Value
Number
Average Value
Number
Average Value
Number
Average Value
Number
Average Value
LOANS ORIGINATED
90
$90,267
259
$117,981
608
$111,394
86
$32,660
1
$231,720
77
$90,830
APPLICATIONS APPROVED, NOT ACCEPTED
3
$128,107
16
$87,082
57
$81,941
3
$82,150
0
$0
2
$62,700
APPLICATIONS DENIED
10
$71,309
40
$72,910
114
$85,737
20
$22,582
0
$0
6
$53,480
APPLICATIONS WITHDRAWN
10
$96,758
25
$103,756
76
$106,958
10
$26,822
0
$0
5
$59,208
FILES CLOSED FOR INCOMPLETENESS
2
$117,865
5
$101,148
21
$87,097
1
$11,670
0
$0
1
$47,890
Aggregated Statistics For Year 2002 (Based on 8 partial tracts)
A) FHA, FSA/RHS & VA Home Purchase Loans
B) Conventional Home Purchase Loans
C) Refinancings
D) Home Improvement Loans
E) Loans on Dwellings For 5+ Families
F) Non-occupant Loans on < 5 Family Dwellings (A B C & D)
Number
Average Value
Number
Average Value
Number
Average Value
Number
Average Value
Number
Average Value
Number
Average Value
LOANS ORIGINATED
99
$97,073
221
$112,246
417
$108,661
135
$23,562
1
$159,980
61
$71,598
APPLICATIONS APPROVED, NOT ACCEPTED
3
$92,437
16
$75,006
45
$115,742
12
$23,733
0
$0
0
$0
APPLICATIONS DENIED
8
$68,929
42
$74,815
79
$83,143
33
$11,634
0
$0
7
$39,900
APPLICATIONS WITHDRAWN
15
$78,880
15
$89,423
48
$100,501
8
$20,431
0
$0
4
$92,802
FILES CLOSED FOR INCOMPLETENESS
1
$113,100
1
$85,070
19
$116,081
4
$56,775
0
$0
2
$66,655
Aggregated Statistics For Year 2001 (Based on 8 partial tracts)
A) FHA, FSA/RHS & VA Home Purchase Loans
B) Conventional Home Purchase Loans
C) Refinancings
D) Home Improvement Loans
F) Non-occupant Loans on < 5 Family Dwellings (A B C & D)
Number
Average Value
Number
Average Value
Number
Average Value
Number
Average Value
Number
Average Value
LOANS ORIGINATED
98
$84,688
231
$106,376
307
$102,091
114
$20,290
47
$72,586
APPLICATIONS APPROVED, NOT ACCEPTED
3
$65,347
17
$65,181
27
$69,463
5
$22,928
1
$96,310
APPLICATIONS DENIED
7
$66,367
81
$44,398
113
$64,963
24
$20,056
3
$63,630
APPLICATIONS WITHDRAWN
8
$84,525
23
$98,425
64
$66,612
9
$16,430
4
$46,822
FILES CLOSED FOR INCOMPLETENESS
2
$51,365
4
$56,985
13
$70,006
1
$24,040
0
$0
Aggregated Statistics For Year 2000 (Based on 8 partial tracts)
A) FHA, FSA/RHS & VA Home Purchase Loans
B) Conventional Home Purchase Loans
C) Refinancings
D) Home Improvement Loans
E) Loans on Dwellings For 5+ Families
F) Non-occupant Loans on < 5 Family Dwellings (A B C & D)
Number
Average Value
Number
Average Value
Number
Average Value
Number
Average Value
Number
Average Value
Number
Average Value
LOANS ORIGINATED
74
$80,599
194
$93,581
118
$90,547
98
$17,360
2
$121,015
22
$58,378
APPLICATIONS APPROVED, NOT ACCEPTED
3
$68,393
43
$52,458
12
$55,312
9
$27,646
0
$0
2
$10,690
APPLICATIONS DENIED
14
$59,161
101
$43,620
95
$58,189
36
$13,794
0
$0
3
$28,790
APPLICATIONS WITHDRAWN
16
$73,820
19
$94,705
52
$74,942
15
$27,649
0
$0
1
$88,740
FILES CLOSED FOR INCOMPLETENESS
2
$42,100
0
$0
11
$73,490
1
$22,620
0
$0
0
$0
Aggregated Statistics For Year 1999 (Based on 5 partial tracts)
A) FHA, FSA/RHS & VA Home Purchase Loans
B) Conventional Home Purchase Loans
C) Refinancings
D) Home Improvement Loans
E) Loans on Dwellings For 5+ Families
F) Non-occupant Loans on < 5 Family Dwellings (A B C & D)
2002 - 2018 National Fire Incident Reporting System (NFIRS) incidents
Based on the data from the years 2002 - 2018 the average number of fires per year is 42. The highest number of fire incidents - 109 took place in 2011, and the least - 6 in 2007. The data has an increasing trend.
When looking into fire subcategories, the most incidents belonged to: Outside Fires (56.0%), and Structure Fires (32.4%).
Fire incident types reported to NFIRS in Zip Code 72916
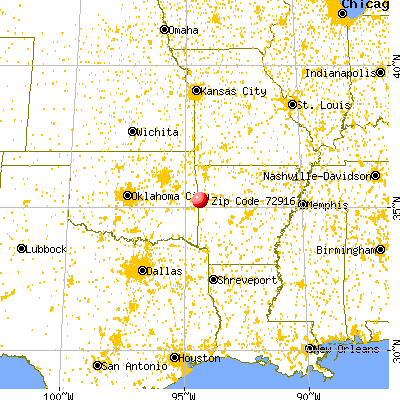


 Nearest zip codes: 72908, 72903, 74902, 72923, 72901, 74901.
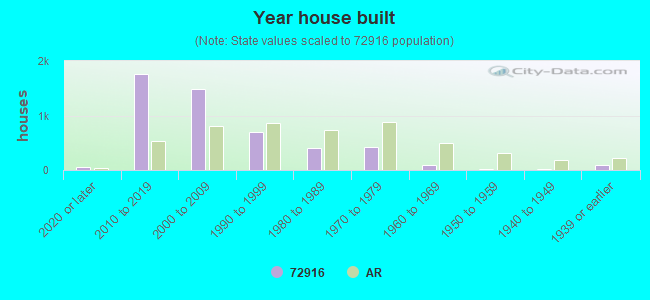


 Based on the data from the years 2002 - 2018 the average number of fires per year is 42. The highest number of fire incidents - 109 took place in 2011, and the least - 6 in 2007. The data has an increasing trend.
 When looking into fire subcategories, the most incidents belonged to: Outside Fires (56.0%), and Structure Fires (32.4%).