Estimated zip code population in 2022: 1,411 Zip code population in 2010: 1,243 Zip code population in 2000: 1,143
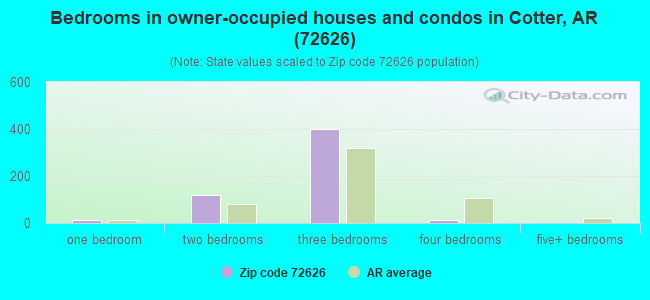
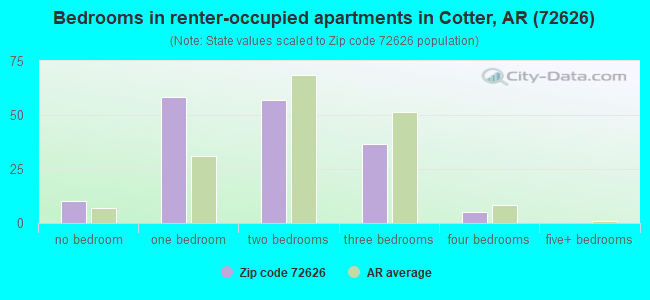
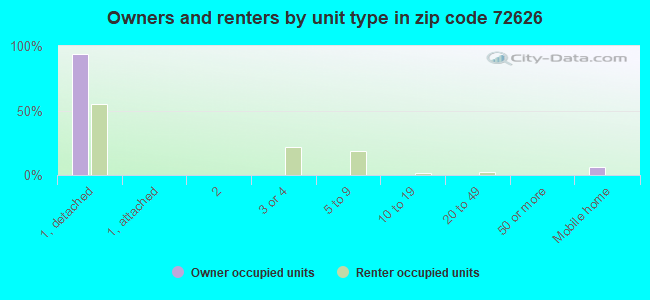
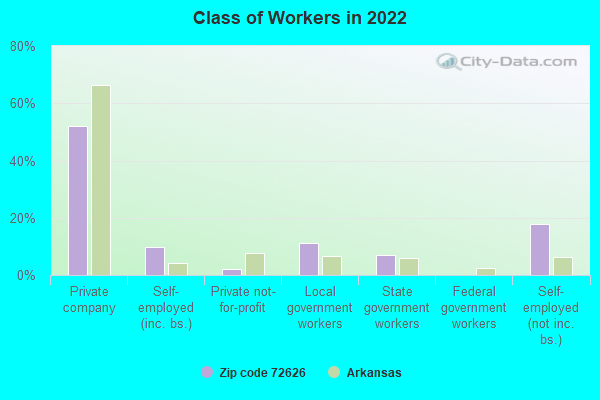
Houses and condos: 904 Renter-occupied apartments: 163
% of renters here:
23%
State:
34%
March 2022 cost of living index in zip code 72626: 79.3 (low, U.S. average is 100)
Land area: 5.6 sq. mi. Water area: 0.5 sq. mi.
Population density: 250 people per square mile
(very low).
OSM Map
General Map
Google Map
MSN Map
OSM Map
General Map
Google Map
MSN Map
OSM Map
General Map
Google Map
MSN Map
OSM Map
General Map
Google Map
MSN Map
Please wait while loading the map...
Real estate property taxes paid for housing units in 2022:
This zip code:
0.5% ($932)
Arkansas:
0.5% ($977)
Median real estate property taxes paid for housing units with mortgages in 2022: $1,066 (0.4%) Median real estate property taxes paid for housing units with no mortgage in 2022: $771 (0.4%)
Business Search- 14 Million verified businesses
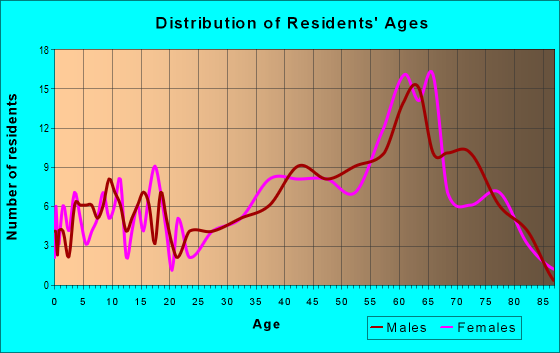
Males: 609
(43.2%)
Females: 802
(56.8%)
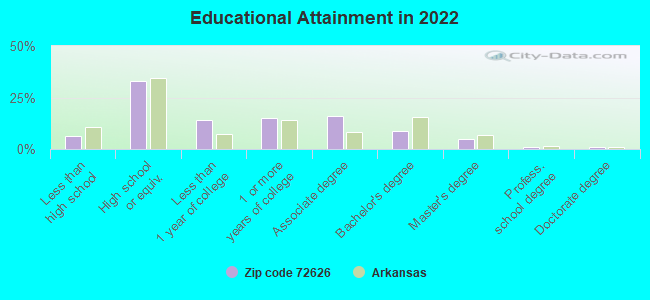
For population 25 years and over in 72626:
High school or higher: 94.0%
Bachelor's degree or higher: 15.7%
Graduate or professional degree: 6.8%
Unemployed: 3.4%
Mean travel time to work (commute): 24.7 minutes
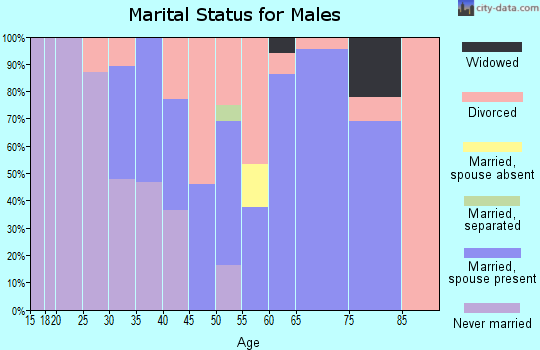
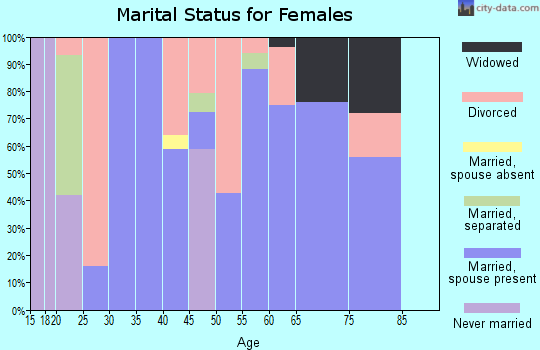
For population 15 years and over in 72626:
Never married: 12.2%
Now married: 63.3%
Separated: 2.0%
Widowed: 7.3%
Divorced: 15.1%
Zip code 72626 compared to state average:
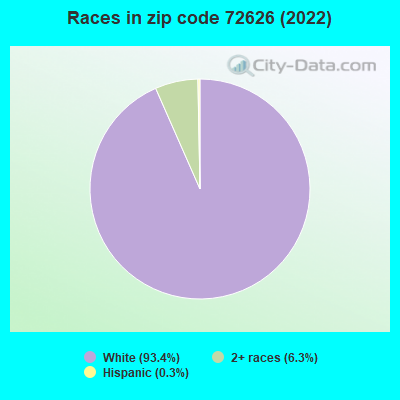
Black race population percentage significantly below state average.
Hispanic race population percentage significantly below state average.
Median age significantly above state average.
Foreign-born population percentage significantly below state average.
Length of stay since moving in significantly above state average.
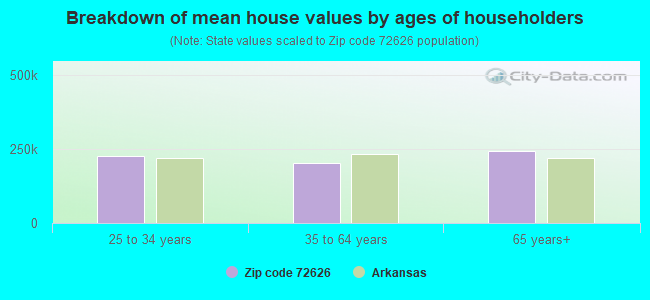
Estimated median house/condo value in 2022: $186,000
72626:
$186,000
Arkansas:
$179,800
According to our research of Arkansas and other state lists, there was 1 registered sex offender living in 72626 zip code as of May 05, 2024. The ratio of all residents to sex offenders in zip code 72626 is 1,218 to 1. The ratio of registered sex offenders to all residents in this zip code is much lower than the state average.
Median resident age:
This zip code:
63.9 years
Arkansas median age:
38.9 years
Average household size:
This zip code:
2.0 people
Arkansas:
2.4 people
Averages for the 2020 tax year for zip code 72626, filed in 2021:
Average Adjusted Gross Income (AGI) in 2020: $54,563 (Individual Income Tax Returns)
Here:
$54,563
State:
$64,872
Salary/wage: $43,478 (reported on 70.6% of returns)
Here:
$43,478
State:
$50,644
(% of AGI for various income ranges: 1127.7% for AGIs below $25k, 3358.0% for AGIs $25k-50k, 3971.7% for AGIs $50k-75k, 22123.3% for AGIs $100k-200k)
Taxable interest for individuals: $867 (reported on 35.3% of returns)
This zip code:
$867
Arkansas:
$1,857
(% of AGI for various income ranges: 11.5% for AGIs below $25k, 35.0% for AGIs $25k-50k, 111.7% for AGIs $50k-75k, 130.0% for AGIs $100k-200k)
Ordinary dividends: $3,775 (reported on 23.5% of returns)
Here:
$3,775
State:
$21,681
(% of AGI for various income ranges: 53.8% for AGIs below $25k, 271.7% for AGIs $50k-75k, 733.3% for AGIs $100k-200k)
Net capital gain/loss in AGI: +$7,364 (reported on 21.6% of returns)
Here:
+$7,364
State:
+$22,815
(% of AGI for various income ranges: 25.4% for AGIs below $25k, 540.0% for AGIs $50k-75k, 1510.0% for AGIs $100k-200k)
Profit/loss from business: +$7,644 (reported on 17.6% of returns)
Here:
+$7,644
State:
+$9,743
(% of AGI for various income ranges: 149.2% for AGIs below $25k, 320.0% for AGIs $25k-50k)
Taxable individual retirement arrangement distribution: $16,812 (reported on 15.7% of returns)
72626:
$16,812
Arkansas:
$18,502
(% of AGI for various income ranges: 230.0% for AGIs below $25k, 481.7% for AGIs $50k-75k, 2523.3% for AGIs $100k-200k)
Earned income credit: $2,111 (reported on 17.6% of returns)
Here:
$2,111
State:
$2,546
(% of AGI for various income ranges: 86.9% for AGIs below $25k, 77.0% for AGIs $25k-50k)
Percentage of individuals using paid preparers for their 2020 taxes: 94.1%
Here:
94%
State:
94%
(% for various income ranges: 89.5% for AGIs below $25k, 92.9% for AGIs $25k-50k, 100.0% for AGIs $50k-75k, 100.0% for AGIs $75k-100k, 100.0% for AGIs $100k-200k)
Averages for the 2012 tax year for zip code 72626, filed in 2013:
Average Adjusted Gross Income (AGI) in 2012: $41,908 (Individual Income Tax Returns)
Here:
$41,908
State:
$52,148
Salary/wage: $30,283 (reported on 72.0% of returns)
Here:
$30,283
State:
$41,669
(% of AGI for various income ranges: 66.2% for AGIs below $25k, 59.9% for AGIs $25k-50k, 51.5% for AGIs $50k-75k, 41.6% for AGIs $75k-100k, 46.9% for AGIs $100k-200k)
Taxable interest for individuals: $1,322 (reported on 36.0% of returns)
This zip code:
$1,322
Arkansas:
$1,648
(% of AGI for various income ranges: 0.8% for AGIs below $25k, 2.1% for AGIs $25k-50k, 0.8% for AGIs $50k-75k, 1.3% for AGIs $75k-100k, 0.9% for AGIs $100k-200k)
Ordinary dividends: $3,633 (reported on 24.0% of returns)
Here:
$3,633
State:
$20,675
(% of AGI for various income ranges: 3.0% for AGIs below $25k, 2.6% for AGIs $25k-50k, 1.0% for AGIs $50k-75k, 2.6% for AGIs $75k-100k, 1.7% for AGIs $100k-200k)
Net capital gain/loss in AGI: +$270 (reported on 20.0% of returns)
Here:
+$270
State:
+$15,222
(% of AGI for various income ranges: 1.3% for AGIs $25k-50k)
Profit/loss from business: +$4,767 (reported on 24.0% of returns)
Here:
+$4,767
State:
+$9,665
(% of AGI for various income ranges: 8.8% for AGIs below $25k, 5.7% for AGIs $25k-50k, 2.2% for AGIs $75k-100k)
Taxable individual retirement arrangement distribution: $11,700 (reported on 18.0% of returns)
72626:
$11,700
Arkansas:
$13,644
(% of AGI for various income ranges: 3.8% for AGIs below $25k, 11.6% for AGIs $25k-50k, 13.7% for AGIs $75k-100k)
Total itemized deductions: $20,627 (24% of AGI, reported on 22.0% of returns)
Here:
$20,627
State:
$23,276
Here:
24.3% of AGI
State:
19.1% of AGI
(% of AGI for various income ranges: 17.5% for AGIs $25k-50k, 18.6% for AGIs $50k-75k, 14.2% for AGIs $100k-200k)
Charity contributions: $2,756 (reported on 18.0% of returns)
Here:
$2,756
State:
$5,996
(% of AGI for various income ranges: 1.7% for AGIs $25k-50k, 3.1% for AGIs $50k-75k, 1.0% for AGIs $100k-200k)
Taxes paid: $5,818 (reported on 22.0% of returns)
72626:
$5,818
State:
$7,941
(% of AGI for various income ranges: 2.7% for AGIs $25k-50k, 4.3% for AGIs $50k-75k, 5.9% for AGIs $100k-200k)
Earned income credit: $2,291 (reported on 22.0% of returns)
Here:
$2,291
State:
$2,455
(% of AGI for various income ranges: 7.7% for AGIs below $25k)
Percentage of individuals using paid preparers for their 2012 taxes: 64.0%
Here:
64%
State:
61%
(% for various income ranges: 60.0% for AGIs below $25k, 60.0% for AGIs $25k-50k, 57.1% for AGIs $50k-75k, 100.0% for AGIs $75k-100k, 75.0% for AGIs $100k-200k)
Averages for the 2004 tax year for zip code 72626, filed in 2005:
Average Adjusted Gross Income (AGI) in 2004: $35,025 (Individual Income Tax Returns)
Here:
$35,025
State:
$39,270
Salary/wage: $26,579 (reported on 71.4% of returns)
Here:
$26,579
State:
$34,079
(% of AGI for various income ranges: 129.3% for AGIs below $10k, 63.5% for AGIs $10k-25k, 66.9% for AGIs $25k-50k, 60.4% for AGIs $50k-75k, 41.1% for AGIs $75k-100k, 32.9% for AGIs over 100k)
Taxable interest for individuals: $2,680 (reported on 46.6% of returns)
This zip code:
$2,680
Arkansas:
$1,904
(% of AGI for various income ranges: 7.7% for AGIs below $10k, 4.1% for AGIs $10k-25k, 2.8% for AGIs $25k-50k, 1.3% for AGIs $50k-75k, 2.1% for AGIs $75k-100k, 6.2% for AGIs over 100k)
Taxable dividends: $2,198 (reported on 25.8% of returns)
Here:
$2,198
State:
$5,995
(% of AGI for various income ranges: 7.1% for AGIs below $10k, 1.7% for AGIs $10k-25k, 1.3% for AGIs $25k-50k, 0.6% for AGIs $50k-75k, 2.6% for AGIs $75k-100k, 1.9% for AGIs over 100k)
Net capital gain/loss: +$10,495 (reported on 20.7% of returns)
Here:
+$10,495
State:
+$10,430
(% of AGI for various income ranges: -3.1% for AGIs below $10k, -0.5% for AGIs $10k-25k, -0.2% for AGIs $25k-50k, 2.5% for AGIs $50k-75k, 22.4% for AGIs over 100k)
Profit/loss from business: +$3,293 (reported on 15.3% of returns)
Here:
+$3,293
State:
+$7,823
(% of AGI for various income ranges: -2.5% for AGIs below $10k, 4.9% for AGIs $10k-25k, 3.2% for AGIs $25k-50k, -0.1% for AGIs $50k-75k)
IRA payment deduction: $1,800 (reported on 2.0% of returns)
72626:
$1,800
Arkansas:
$3,204
Total itemized deductions: $18,818 (26% of AGI, reported on 22.5% of returns)
Here:
$18,818
State:
$18,389
Here:
25.8% of AGI
State:
21.0% of AGI
(% of AGI for various income ranges: 8.9% for AGIs $10k-25k, 13.1% for AGIs $25k-50k, 12.1% for AGIs $50k-75k, 20.0% for AGIs $75k-100k, 10.2% for AGIs over 100k)
Charity contributions deductions: $3,615 (5% of AGI, reported on 19.6% of returns)
Here:
$3,615
State:
$4,725
Here:
4.9% of AGI
State:
5.1% of AGI
(% of AGI for various income ranges: 0.7% for AGIs $10k-25k, 2.3% for AGIs $25k-50k, 2.3% for AGIs $50k-75k, 3.1% for AGIs $75k-100k, 2.0% for AGIs over 100k)
Total tax: $4,821 (reported on 70.8% of returns)
72626:
$4,821
State:
$6,047
(% of AGI for various income ranges: 3.7% for AGIs below $10k, 4.1% for AGIs $10k-25k, 5.5% for AGIs $25k-50k, 8.4% for AGIs $50k-75k, 10.3% for AGIs $75k-100k, 18.1% for AGIs over 100k)
Earned income credit: $1,455 (reported on 18.0% of returns)
Here:
$1,455
State:
$1,909
Percentage of individuals using paid preparers for their 2004 taxes: 71.2%
Here:
71%
State:
67%
(% for various income ranges: 61.2% for AGIs below $10k, 75.2% for AGIs $10k-25k, 70.2% for AGIs $25k-50k, 68.9% for AGIs $50k-75k, 79.2% for AGIs $75k-100k, 100.0% for AGIs over 100k)
Household received Food Stamps/SNAP in the past 12 months: 49 Household did not receive Food Stamps/SNAP in the past 12 months: 661
Women who did not have a birth in the past 12 months: 209 (107 now married, 102 unmarried)
Housing units in zip code 72626 with a mortgage: 223 Median monthly owner costs for units with a mortgage: $1,256 Median monthly owner costs for units without a mortgage: $294
Residents with income below the poverty level in 2022:
This zip code:
11.5%
Whole state:
16.8%
Residents with income below 50% of the poverty level in 2022:
This zip code:
6.4%
Whole state:
8.5%
Median number of rooms in houses and condos:
Here:
6.7
State:
6.1
Median number of rooms in apartments:
Here:
4.1
State:
4.3
Notable locations in this zip code not listed on our city pages
Notable locations in zip code 72626: Mooneys Landing (A), Cotter - Gassville Rural Volunteer Fire District Station 2 (B), Cotter Volunteer Fire Department (C), Cotter Police Department (D). Display/hide their locations on the map
Size of family households: 368 2-persons, 84 3-persons, 30 4-persons, 1 5-persons
Size of nonfamily households: 191 1-person, 36 2-persons
79 married couples with children.
23 single-parent households (4 men, 19 women).
95.6% of residents of 72626 zip code speak English at home.
5.5% of residents speak Spanish at home (6% very well, 94% well).
0.4% of residents speak other Indo-European language at home (100% very well).
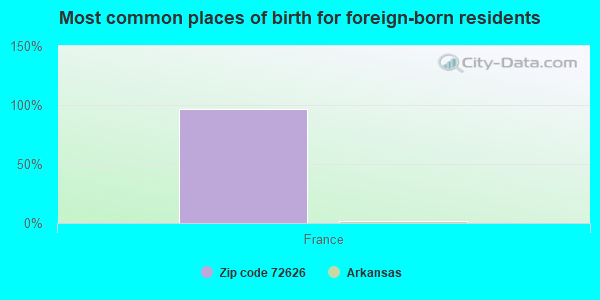
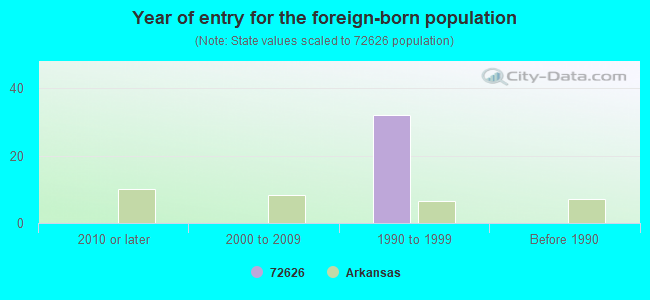
Foreign born population: 30 (2.2%) (100.0% of them are naturalized citizens)
This zip code:
2.2%
Whole state:
5.1%
97%France
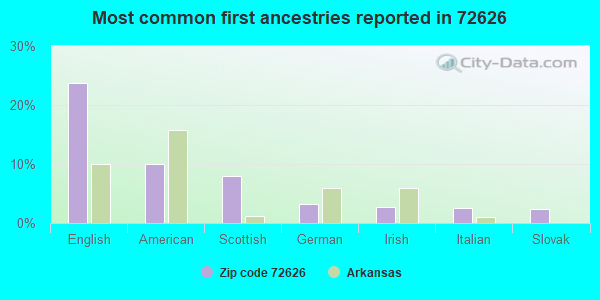
24%English
10%American
8%Scottish
3%German
3%Irish
3%Italian
2%Slovak
Year of entry for the foreign-born population
02010 or later
02000 to 2009
321990 to 1999
0Before 1990
Facilities with environmental interests located in this zip code:
AMANDA GIST ELEMENTARY SCHOOL (P.O. BOX 70 in COTTER, AR)
(Geographic Names Information System) (National Center for Education Statistics) - STATE ID-0302006 Organizations: COTTER (SCHOOL DISTRICT)
CITIES OF COTTER & GASSVILLE (2066 EAST COTTER ROAD in COTTER, AR)
National Pollutant Discharge Elimination System NON-MAJOR (Tracking pollutant discharge elimination systems) - permit Business SIC classification: SEWERAGE SYSTEMS Organizations: GASSVILLE, TOWN OF (CONTACT/OWNER)
Alternative names: COTTER-GASSVILLE, CITIES OF, COTTER-GASSVILLE, CITY OF, COTTER-GASSVILLE WWTF
Housing units lacking complete plumbing facilities: 5.7% Housing units lacking complete kitchen facilities: 8.2%
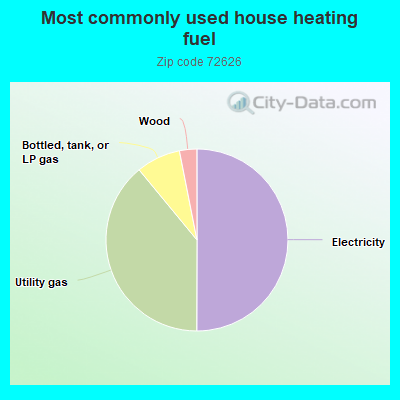
50.2%Electricity
39.1%Utility gas
7.9%Bottled, tank, or LP gas
3.1%Wood
Population in 1990: 1,044. Population change in the 1990s: +99 (+9.5%).
Place of birth for U.S.-born residents:
This state: 506
Northeast: 45
Midwest: 360
South: 295
West: 184
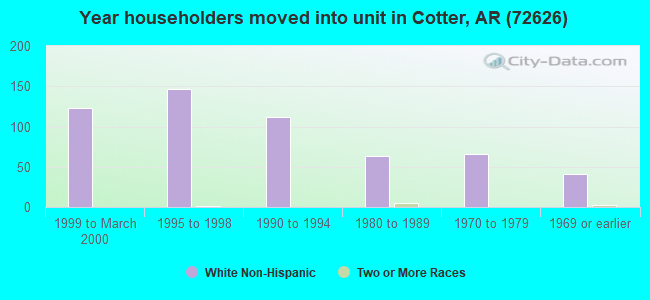
55% of the 72626 zip code residents lived in the same house 5 years ago. Out of people who lived in different houses, 37% lived in this county. Out of people who lived in different counties, 50% lived in Arkansas.
80% of the 72626 zip code residents lived in the same house 1 year ago. Out of people who lived in different houses, 28% moved from this county. Out of people who lived in different houses, 11% moved from different county within same state. Out of people who lived in different houses, 68% moved from different state.
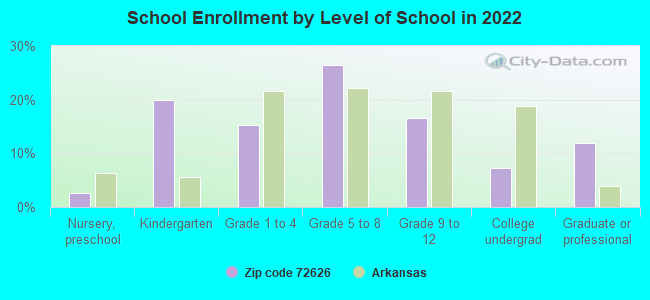
Private vs. public school enrollment:
Students in private schools in grades 1 to 8 (elementary and middle school):
Here:
0.0%
Arkansas:
10.5%
Students in private schools in grades 9 to 12 (high school):
Here:
0.0%
Arkansas:
8.7%
Students in private undergraduate colleges: 3
Here:
26.8%
Arkansas:
19.4%
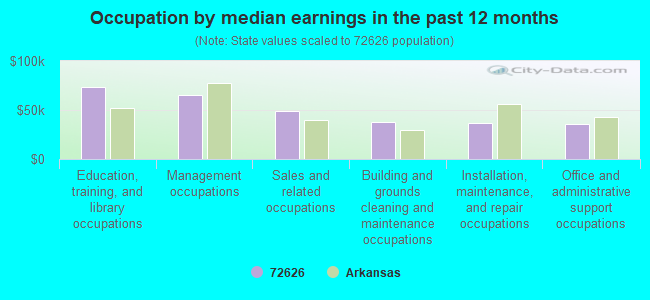
Occupation by median earnings in the past 12 months ($)
73,548Education, training, and library occupations
65,628Management occupations
49,024Sales and related occupations
37,947Building and grounds cleaning and maintenance occupations
37,134Installation, maintenance, and repair occupations
35,220Office and administrative support occupations
Top industries in this zip code by the number of employees in 2005:
Accommodation and Food Services: Full-Service Restaurants (10-19 employees: 2 establishments)
Accommodation and Food Services: All Other Traveler Accommodation (5-9: 1)
Health Care and Social Assistance: Offices of Dentists (5-9: 1)
Professional, Scientific, and Technical Services: Offices of Lawyers (1-4: 2)
Accommodation and Food Services: Hotels (except Casino Hotels) and Motels (1-4: 2)
Other Services (except Public Administration): Religious Organizations (1-4: 1)
Arts, Entertainment, and Recreation: All Other Amusement and Recreation Industries (1-4: 1)
Accommodation and Food Services: RV (Recreational Vehicle) Parks and Campgrounds (1-4: 1)
2002 - 2018 National Fire Incident Reporting System (NFIRS) incidents
According to the data from the years 2002 - 2018 the average number of fire incidents per year is 14. The highest number of reported fires - 22 took place in 2009, and the least - 6 in 2002. The data has a growing trend.
When looking into fire subcategories, the most reports belonged to: Outside Fires (51.0%), and Structure Fires (30.5%).
Fire incident types reported to NFIRS in Zip Code 72626
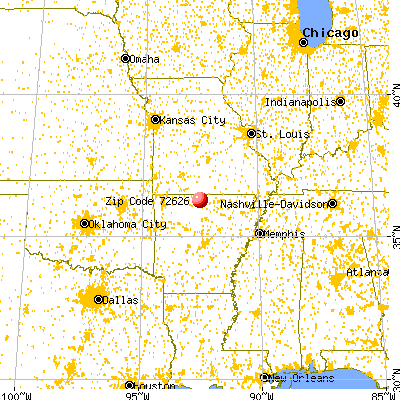


 Nearest zip codes: 72635, 72642, 72619, 72651, 72661, 72634.


 According to the data from the years 2002 - 2018 the average number of fire incidents per year is 14. The highest number of reported fires - 22 took place in 2009, and the least - 6 in 2002. The data has a growing trend.
 When looking into fire subcategories, the most reports belonged to: Outside Fires (51.0%), and Structure Fires (30.5%).