Estimated zip code population in 2022: 1,828 Zip code population in 2010: 1,810 Zip code population in 2000: 1,868
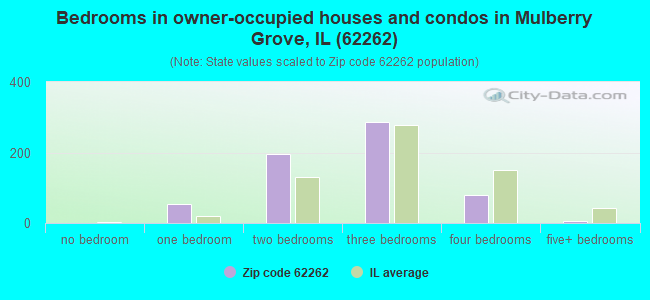
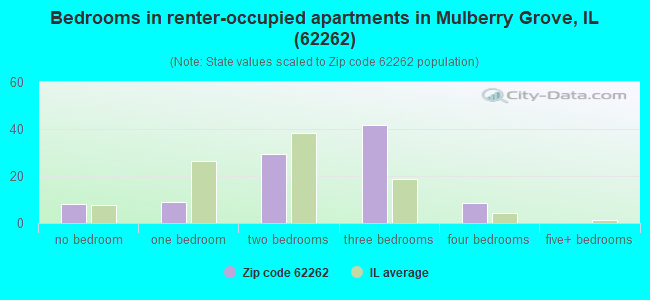
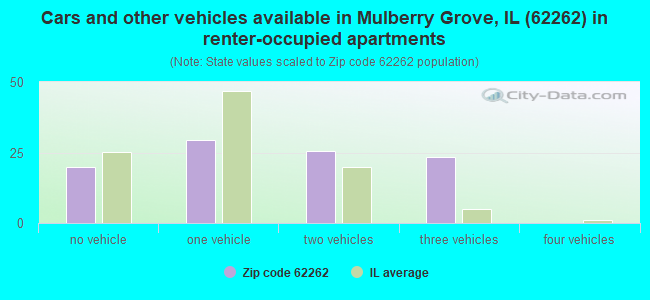
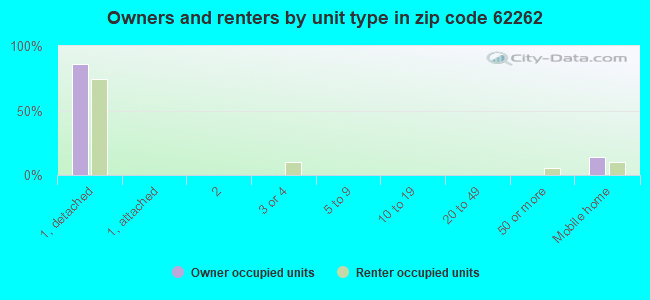
Houses and condos: 858 Renter-occupied apartments: 98
% of renters here:
14%
State:
33%
March 2022 cost of living index in zip code 62262: 84.9 (less than average, U.S. average is 100)
Land area: 67.3 sq. mi. Water area: 0.0 sq. mi.
Population density: 27 people per square mile
(very low).
OSM Map
General Map
Google Map
MSN Map
OSM Map
General Map
Google Map
MSN Map
OSM Map
General Map
Google Map
MSN Map
OSM Map
General Map
Google Map
MSN Map
Please wait while loading the map...
Real estate property taxes paid for housing units in 2022:
This zip code:
1.4% ($1,728)
Illinois:
2.0% ($4,912)
Median real estate property taxes paid for housing units with mortgages in 2022: $1,951 (1.3%) Median real estate property taxes paid for housing units with no mortgage in 2022: $1,418 (1.8%)
Averages for the 2020 tax year for zip code 62262, filed in 2021:
Average Adjusted Gross Income (AGI) in 2020: $53,289 (Individual Income Tax Returns)
Here:
$53,289
State:
$82,626
Salary/wage: $44,641 (reported on 79.7% of returns)
Here:
$44,641
State:
$66,640
(% of AGI for various income ranges: 1095.9% for AGIs below $25k, 3036.4% for AGIs $25k-50k, 5818.9% for AGIs $50k-75k, 8226.7% for AGIs $75k-100k, 14358.6% for AGIs $100k-200k)
Taxable interest for individuals: $847 (reported on 40.5% of returns)
This zip code:
$847
Illinois:
$2,376
(% of AGI for various income ranges: 12.4% for AGIs below $25k, 41.4% for AGIs $25k-50k, 44.4% for AGIs $50k-75k, 45.0% for AGIs $75k-100k, 154.3% for AGIs $100k-200k)
Ordinary dividends: $2,030 (reported on 13.5% of returns)
Here:
$2,030
State:
$9,061
(% of AGI for various income ranges: 42.9% for AGIs below $25k, 45.6% for AGIs $50k-75k, 127.1% for AGIs $100k-200k)
Net capital gain/loss in AGI: +$6,344 (reported on 12.2% of returns)
Here:
+$6,344
State:
+$31,684
(% of AGI for various income ranges: 15.3% for AGIs below $25k, 242.2% for AGIs $50k-75k, 467.1% for AGIs $100k-200k)
Profit/loss from business: +$4,950 (reported on 13.5% of returns)
Here:
+$4,950
State:
+$12,175
(% of AGI for various income ranges: 108.8% for AGIs below $25k, 116.4% for AGIs $25k-50k, 83.3% for AGIs $50k-75k, 120.0% for AGIs $75k-100k)
Taxable individual retirement arrangement distribution: $5,940 (reported on 6.8% of returns)
62262:
$5,940
Illinois:
$21,613
(% of AGI for various income ranges: 330.0% for AGIs $50k-75k)
Earned income credit: $2,125 (reported on 16.2% of returns)
Here:
$2,125
State:
$2,311
(% of AGI for various income ranges: 93.5% for AGIs below $25k, 68.6% for AGIs $25k-50k)
Percentage of individuals using paid preparers for their 2020 taxes: 94.6%
Here:
95%
State:
93%
(% for various income ranges: 96.0% for AGIs below $25k, 94.4% for AGIs $25k-50k, 91.7% for AGIs $50k-75k, 87.5% for AGIs $75k-100k, 100.0% for AGIs $100k-200k)
Averages for the 2012 tax year for zip code 62262, filed in 2013:
Average Adjusted Gross Income (AGI) in 2012: $42,605 (Individual Income Tax Returns)
Here:
$42,605
State:
$68,058
Salary/wage: $35,055 (reported on 82.1% of returns)
Here:
$35,055
State:
$55,396
(% of AGI for various income ranges: 71.8% for AGIs below $25k, 73.5% for AGIs $25k-50k, 77.8% for AGIs $50k-75k, 71.8% for AGIs $75k-100k, 47.2% for AGIs $100k-200k)
Taxable interest for individuals: $1,048 (reported on 37.2% of returns)
This zip code:
$1,048
Illinois:
$1,969
(% of AGI for various income ranges: 1.6% for AGIs below $25k, 0.6% for AGIs $25k-50k, 0.6% for AGIs $50k-75k, 0.8% for AGIs $75k-100k, 1.2% for AGIs $100k-200k)
Ordinary dividends: $1,542 (reported on 15.4% of returns)
Here:
$1,542
State:
$7,786
(% of AGI for various income ranges: 0.6% for AGIs below $25k, 0.6% for AGIs $25k-50k, 0.7% for AGIs $50k-75k, 0.8% for AGIs $100k-200k)
Net capital gain/loss in AGI: +$1,888 (reported on 10.3% of returns)
Here:
+$1,888
State:
+$22,183
Profit/loss from business: +$3,475 (reported on 15.4% of returns)
Here:
+$3,475
State:
+$12,903
(% of AGI for various income ranges: 3.3% for AGIs below $25k, 3.3% for AGIs $25k-50k, 0.7% for AGIs $50k-75k)
Taxable individual retirement arrangement distribution: $6,071 (reported on 9.0% of returns)
62262:
$6,071
Illinois:
$17,929
(% of AGI for various income ranges: 1.2% for AGIs below $25k, 1.8% for AGIs $25k-50k, 3.1% for AGIs $50k-75k)
Total itemized deductions: $16,721 (23% of AGI, reported on 17.9% of returns)
Here:
$16,721
State:
$26,433
Here:
22.5% of AGI
State:
19.2% of AGI
(% of AGI for various income ranges: 8.1% for AGIs $25k-50k, 7.4% for AGIs $50k-75k, 10.0% for AGIs $75k-100k, 7.3% for AGIs $100k-200k)
Charity contributions: $2,833 (reported on 11.5% of returns)
Here:
$2,833
State:
$4,525
(% of AGI for various income ranges: 1.0% for AGIs $50k-75k, 1.8% for AGIs $75k-100k, 0.8% for AGIs $100k-200k)
Taxes paid: $5,454 (reported on 16.7% of returns)
62262:
$5,454
State:
$11,968
(% of AGI for various income ranges: 1.4% for AGIs $25k-50k, 2.3% for AGIs $50k-75k, 3.3% for AGIs $75k-100k, 2.9% for AGIs $100k-200k)
Earned income credit: $2,372 (reported on 23.1% of returns)
Here:
$2,372
State:
$2,349
(% of AGI for various income ranges: 7.8% for AGIs below $25k, 1.4% for AGIs $25k-50k)
Percentage of individuals using paid preparers for their 2012 taxes: 74.4%
Here:
74%
State:
57%
(% for various income ranges: 67.6% for AGIs below $25k, 73.7% for AGIs $25k-50k, 84.6% for AGIs $50k-75k, 71.4% for AGIs $75k-100k, 100.0% for AGIs $100k-200k)
Averages for the 2004 tax year for zip code 62262, filed in 2005:
Average Adjusted Gross Income (AGI) in 2004: $32,689 (Individual Income Tax Returns)
Here:
$32,689
State:
$54,625
Salary/wage: $30,747 (reported on 85.2% of returns)
Here:
$30,747
State:
$46,811
(% of AGI for various income ranges: 111.6% for AGIs below $10k, 73.0% for AGIs $10k-25k, 82.5% for AGIs $25k-50k, 80.6% for AGIs $50k-75k, 88.9% for AGIs $75k-100k, 61.6% for AGIs over 100k)
Taxable interest for individuals: $1,179 (reported on 39.9% of returns)
This zip code:
$1,179
Illinois:
$2,101
(% of AGI for various income ranges: 12.7% for AGIs below $10k, 3.3% for AGIs $10k-25k, 1.5% for AGIs $25k-50k, 0.7% for AGIs $50k-75k, 0.3% for AGIs $75k-100k, 0.3% for AGIs over 100k)
Taxable dividends: $993 (reported on 16.6% of returns)
Here:
$993
State:
$4,306
(% of AGI for various income ranges: 2.8% for AGIs below $10k, 0.7% for AGIs $10k-25k, 0.2% for AGIs $25k-50k, 0.3% for AGIs $50k-75k, 0.2% for AGIs $75k-100k, 1.4% for AGIs over 100k)
Net capital gain/loss: +$2,442 (reported on 12.8% of returns)
Here:
+$2,442
State:
+$17,321
(% of AGI for various income ranges: 0.9% for AGIs below $10k, -0.1% for AGIs $10k-25k, 0.2% for AGIs $25k-50k, 2.5% for AGIs $50k-75k, 1.4% for AGIs $75k-100k)
Profit/loss from business: +$2,439 (reported on 13.2% of returns)
Here:
+$2,439
State:
+$11,771
(% of AGI for various income ranges: 10.1% for AGIs below $10k, 2.2% for AGIs $10k-25k, 1.3% for AGIs $25k-50k, 0.3% for AGIs $50k-75k)
IRA payment deduction: $2,000 (reported on 1.8% of returns)
62262:
$2,000
Illinois:
$3,087
Total itemized deductions: $13,888 (21% of AGI, reported on 14.3% of returns)
Here:
$13,888
State:
$20,239
Here:
21.0% of AGI
State:
19.5% of AGI
(% of AGI for various income ranges: 6.2% for AGIs $25k-50k, 6.6% for AGIs $50k-75k, 7.9% for AGIs $75k-100k, 10.6% for AGIs over 100k)
Charity contributions deductions: $2,589 (3% of AGI, reported on 9.0% of returns)
Here:
$2,589
State:
$3,719
Here:
3.4% of AGI
State:
3.4% of AGI
(% of AGI for various income ranges: 0.5% for AGIs $25k-50k, 1.0% for AGIs $50k-75k, 0.8% for AGIs $75k-100k, 1.8% for AGIs over 100k)
Total tax: $3,749 (reported on 69.5% of returns)
62262:
$3,749
State:
$9,882
(% of AGI for various income ranges: 2.9% for AGIs below $10k, 3.6% for AGIs $10k-25k, 6.1% for AGIs $25k-50k, 7.8% for AGIs $50k-75k, 11.3% for AGIs $75k-100k, 14.7% for AGIs over 100k)
Earned income credit: $1,673 (reported on 19.6% of returns)
Here:
$1,673
State:
$1,788
Percentage of individuals using paid preparers for their 2004 taxes: 73.6%
Here:
74%
State:
61%
(% for various income ranges: 65.1% for AGIs below $10k, 72.3% for AGIs $10k-25k, 74.1% for AGIs $25k-50k, 81.4% for AGIs $50k-75k, 85.7% for AGIs $75k-100k, 77.3% for AGIs over 100k)
Likely homosexual households (counted as self-reported same-sex unmarried-partner households)
Lesbian couples: 0.0% of all households
Gay men: 0.4% of all households
Household received Food Stamps/SNAP in the past 12 months: 110 Household did not receive Food Stamps/SNAP in the past 12 months: 609
Women who had a birth in the past 12 months: 34 (26 now married, 7 unmarried) Women who did not have a birth in the past 12 months: 297 (137 now married, 159 unmarried)
Housing units in zip code 62262 with a mortgage: 300 (15 second mortgage, 5 both second mortgage and home equity loan) Houses without a mortgage: 3
Median monthly owner costs for units with a mortgage: $1,177 Median monthly owner costs for units without a mortgage: $471
Residents with income below the poverty level in 2022:
This zip code:
13.1%
Whole state:
11.9%
Residents with income below 50% of the poverty level in 2022:
This zip code:
7.9%
Whole state:
5.7%
Median number of rooms in houses and condos:
Here:
5.8
State:
6.4
Median number of rooms in apartments:
Here:
5.2
State:
4.1
Notable locations in this zip code not listed on our city pages
Notable locations in zip code 62262: Lutz Spur (A), Royal Lake Resort (B), Mulberry Grove Fire Protection District (C). Display/hide their locations on the map
Churches in zip code 62262 include: Bethlehem Church (A), Columbus Church (B), First Baptist Church (C), First Church of Christ (D), Liberty Church (E). Display/hide their locations on the map
Cemeteries: Williams Cemetery (1), Bethlehem Cemetery (2), Liberty Cemetery (3), Neathery Cemetery (4), Mulberry Grove Cemetery (5), Hastings Cemetery (6), Seagraves Cemetery (7). Display/hide their locations on the map
Size of family households: 209 2-persons, 89 3-persons, 58 4-persons, 56 5-persons, 4 6-persons, 29 7-or-more-persons
Size of nonfamily households: 244 1-person, 19 2-persons, 7 3-persons
235 married couples with children.
103 single-parent households (89 men, 14 women).
95.7% of residents of 62262 zip code speak English at home.
1.3% of residents speak Spanish at home (100% very well).
0.6% of residents speak other Indo-European language at home (100% very well).
2.1% of residents speak other language at home (100% very well).
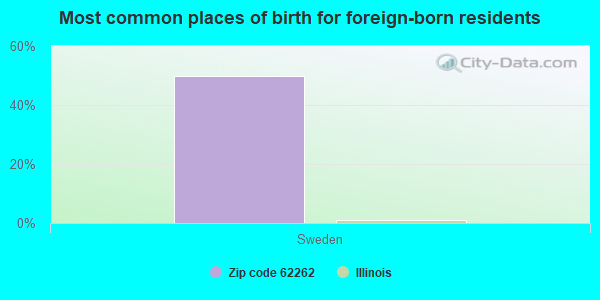
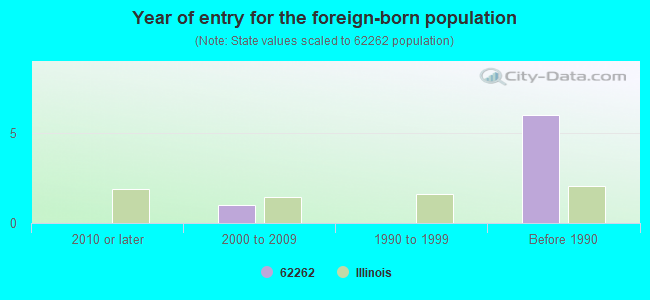
Foreign born population: 2 (0.1%) (100.0% of them are naturalized citizens)
This zip code:
0.1%
Whole state:
14.4%
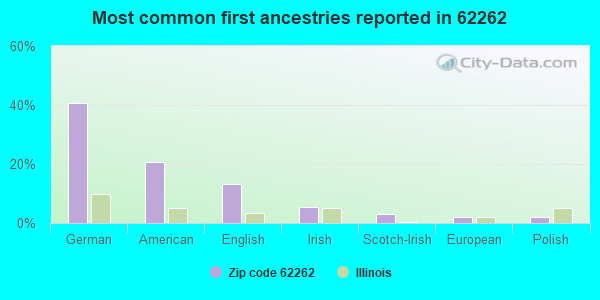
50%Sweden
41%German
21%American
13%English
5%Irish
3%Scotch-Irish
2%European
2%Polish
Year of entry for the foreign-born population
02010 or later
12000 to 2009
01990 to 1999
6Before 1990
Facilities with environmental interests located in this zip code:
HOPKINS OIL CO (RR 2 in MULBERRY GROVE, IL)
STATE MASTER (Illinois EPA Project) - AIR PROGRAM AIR MINOR (AIRS/AFS) Business SIC classification: PETROLEUM BULK STATIONS AND TERMINALS
MULBERRY GROVE SD STP (IL ROUTE 140 in MULBERRY GROVE, IL)
STATE MASTER (Illinois EPA Project) - National Pollutant Discharge Elimination System Permit National Pollutant Discharge Elimination System NON-MAJOR (Tracking pollutant discharge elimination systems) - permit Business SIC classification: SEWERAGE SYSTEMS
MULBERRY GROVE ELEM SCHOOL (801 W WALL in MULBERRY GROVE, IL)
(National Center for Education Statistics) - STATE ID-0300300102001 Organizations: MULBERRY GROVE C U SCH DIST 1 (SCHOOL DISTRICT)
MULBERRY GROVE JR HIGH SCHOOL (801 W WALL ST in MULBERRY GROVE, IL)
(National Center for Education Statistics) - STATE ID-0300300101001 Organizations: MULBERRY GROVE C U SCH DIST 1 (SCHOOL DISTRICT)
MULBERRY GROVE SR HIGH SCHOOL (801 W WALL ST in MULBERRY GROVE, IL)
(National Center for Education Statistics) - STATE ID-0300300100001 Organizations: MULBERRY GROVE C U SCH DIST 1 (SCHOOL DISTRICT)
BOND COUNTY SERVICE CO (MAPLE ST in MULBERRY GROVE, IL)
(Resource Conservation and Recovery Act (tracking hazardous waste))
IDOT (BRG 0030036 in MULBERRY GROVE, IL)
Small Quantity Generators, between 100 kg and 1000 kg of hazardous waste/month (Resource Conservation and Recovery Act (tracking hazardous waste))
MULBERRY GROVE CUSD 1 (801 W WALL ST in MULBERRY GROVE, IL)
Conditionally Exempt Small Quantity Generators, less than 100 kg/month of hazardous waste (Resource Conservation and Recovery Act (tracking hazardous waste))
IDOT (BRIDGE 026-0042 in MULBERRY GROVE, IL)
Small Quantity Generators, between 100 kg and 1000 kg of hazardous waste/month (Resource Conservation and Recovery Act (tracking hazardous waste)) - notification
KERNS FEED & SUP (PO BOX 26 in MULBERRY GROVE, IL)
COMPLIANCE ACTIVITY (Tracking inspections of insecticide, fungicide, and rodenticide, and toxic substances)
MULBERRY GROVE C.U.S.D #1 (R.R. #2 BOX 327 in MULBERRY GROVE, IL)
COMPLIANCE ACTIVITY (Tracking inspections of insecticide, fungicide, and rodenticide, and toxic substances)
MULBERRY GROVE C.U.S.D #1 (R.R. #2 BOX327 in MULBERRY GROVE, IL)
COMPLIANCE ACTIVITY (Tracking inspections of insecticide, fungicide, and rodenticide, and toxic substances)
Housing units lacking complete plumbing facilities: 9.3% Housing units lacking complete kitchen facilities: 9.7%
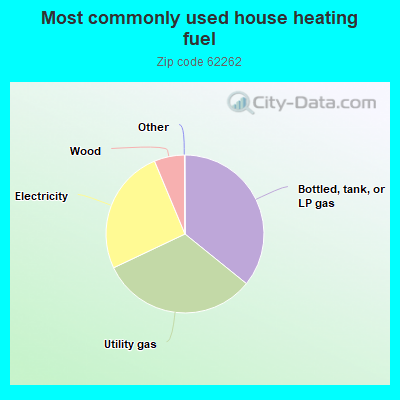
35.9%Bottled, tank, or LP gas
32.2%Utility gas
25.8%Electricity
6.2%Wood
Population in 1990: 1,721. Population change in the 1990s: +147 (+8.5%).
Place of birth for U.S.-born residents:
This state: 1,440
Northeast: 26
Midwest: 269
South: 62
West: 15
70% of the 62262 zip code residents lived in the same house 5 years ago. Out of people who lived in different houses, 53% lived in this county. Out of people who lived in different counties, 50% lived in Illinois.
94% of the 62262 zip code residents lived in the same house 1 year ago. Out of people who lived in different houses, 29% moved from this county. Out of people who lived in different houses, 61% moved from different county within same state. Out of people who lived in different houses, 7% moved from different state. Out of people who lived in different houses, 6% moved from abroad.
Private vs. public school enrollment:
Students in private schools in grades 1 to 8 (elementary and middle school): 30
Here:
17.9%
Illinois:
13.3%
Students in private schools in grades 9 to 12 (high school): 1
Here:
2.0%
Illinois:
9.9%
Students in private undergraduate colleges: 11
Here:
24.8%
Illinois:
27.4%
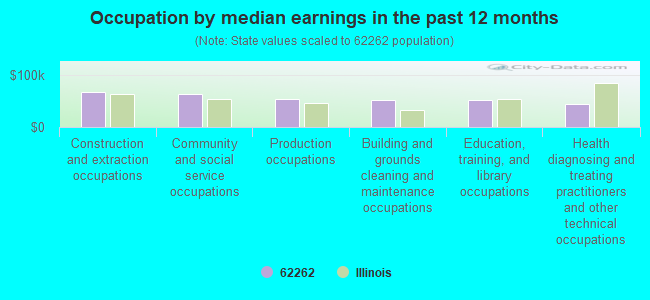
Occupation by median earnings in the past 12 months ($)
66,658Construction and extraction occupations
63,325Community and social service occupations
54,454Production occupations
52,177Building and grounds cleaning and maintenance occupations
51,077Education, training, and library occupations
44,898Health diagnosing and treating practitioners and other technical occupations
Companies with federal contracts located in this zip code:
MICHAEL & CHARLETTE MALOON, WO (202 S CHURCH ST in MULBERRY GROVE, IL; small business) : $35,530 in 6 contractsfrom 2003 to 2006
Contracts for Operation of Government-Owned Facilities -- Recreation Facilities (Non-Building) by Army, U.S. Army Corps of Engineers - civil program financing only Signed by year:2000: $0; 2001: $0; 2002: $0; 2003: $5,136; 2004: $24,192; 2005: $0; 2006: $6,202.
Biggest contracts:
$6,202 with Army for Operation of Government-Owned Facilities -- Recreation Facilities (Non-Building). Signed on 2006-01-31. Completion date: 2004-10-31.
$6,048 with U.S. Army Corps of Engineers - civil program financing only for Operation of Government-Owned Facilities -- Recreation Facilities (Non-Building). Signed on 2004-11-17. Completion date: 2004-10-31.
$6,048 with Army for Operation of Government-Owned Facilities -- Recreation Facilities (Non-Building). Signed on 2004-11-17. Completion date: 2004-10-31.
$6,048, same as above.Signed on 2004-02-02. Completion date: 2004-10-31.
Top industries in this zip code by the number of employees in 2005:
Finance and Insurance: Commercial Banking (20-49: 1)
Construction: Other Heavy and Civil Engineering Construction (10-19: 1)
Accommodation and Food Services: Full-Service Restaurants (10-19: 1)
Management of Companies and Enterprises: Offices of Bank Holding Companies (5-9: 1)
Construction: New Single-Family Housing Construction (except Operative Builders) (1-4: 1)
Fatal accident statistics in 2014:
Fatal accident count: 1
Vehicles involved in fatal accidents: 1
Fatal accidents caused by drunken drivers: 1
Fatalities: 1
Persons involved in fatal accidents: 1
Pedestrians involved in fatal accidents: 0
2002 - 2018 National Fire Incident Reporting System (NFIRS) incidents
Based on the data from the years 2002 - 2018 the average number of fires per year is 24. The highest number of fires - 41 took place in 2012, and the least - 12 in 2013. The data has an increasing trend.
When looking into fire subcategories, the most reports belonged to: Outside Fires (43.8%), and Structure Fires (32.2%).
Fire incident types reported to NFIRS in Zip Code 62262
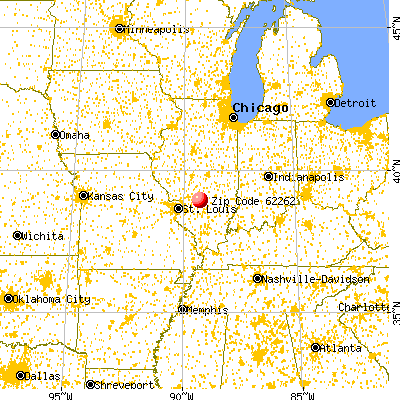


 Nearest zip codes: 62284, 62017, 62471, 62246, 62253, 62032.


 Based on the data from the years 2002 - 2018 the average number of fires per year is 24. The highest number of fires - 41 took place in 2012, and the least - 12 in 2013. The data has an increasing trend.
 When looking into fire subcategories, the most reports belonged to: Outside Fires (43.8%), and Structure Fires (32.2%).