Estimated zip code population in 2022: 743 Zip code population in 2010: 749 Zip code population in 2000: 764
Houses and condos: 340 Renter-occupied apartments: 58
% of renters here:
18%
State:
33%
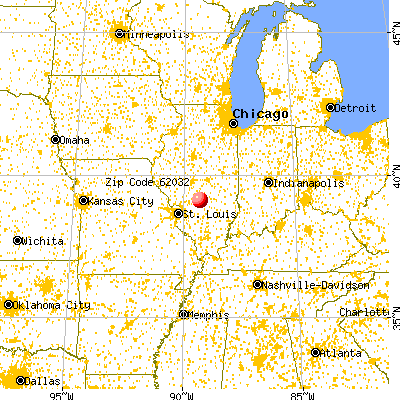
March 2022 cost of living index in zip code 62032: 83.6 (less than average, U.S. average is 100)
Land area: 47.4 sq. mi. Water area: 0.0 sq. mi.
Population density: 16 people per square mile
(very low).
OSM Map
General Map
Google Map
MSN Map
OSM Map
General Map
Google Map
MSN Map
OSM Map
General Map
Google Map
MSN Map
OSM Map
General Map
Google Map
MSN Map
Please wait while loading the map...
Real estate property taxes paid for housing units in 2022:
This zip code:
0.8% ($757)
Illinois:
2.0% ($4,912)
Median real estate property taxes paid for housing units with mortgages in 2022: $1,106 (1.6%) Median real estate property taxes paid for housing units with no mortgage in 2022: $758 (0.8%)
Business Search- 14 Million verified businesses
Males: 412
(55.5%)
Females: 331
(44.5%)
For population 25 years and over in 62032:
High school or higher: 90.9%
Bachelor's degree or higher: 2.5%
Graduate or professional degree: 0.0%
Unemployed: 7.8%
Mean travel time to work (commute): 37.1 minutes
For population 15 years and over in 62032:
Never married: 28.5%
Now married: 47.7%
Separated: 0.0%
Widowed: 12.3%
Divorced: 11.6%
Zip code 62032 compared to state average:
Median house value significantly below state average.
Black race population percentage significantly below state average.
Hispanic race population percentage significantly below state average.
Median age significantly above state average.
Foreign-born population percentage significantly below state average.
Renting percentage below state average.
Length of stay since moving in significantly above state average.
Number of college students below state average.
Percentage of population with a bachelor's degree or higher significantly below state average.
Estimated median house/condo value in 2022: $91,654
62032:
$91,654
Illinois:
$251,600
Median resident age:
This zip code:
51.3 years
Illinois median age:
39.1 years
Average household size:
This zip code:
2.2 people
Illinois:
2.4 people
Averages for the 2020 tax year for zip code 62032, filed in 2021:
Average Adjusted Gross Income (AGI) in 2020: $57,564 (Individual Income Tax Returns)
Here:
$57,564
State:
$82,626
Salary/wage: $45,612 (reported on 78.8% of returns)
Here:
$45,612
State:
$66,640
(% of AGI for various income ranges: 1325.7% for AGIs below $25k, 3355.0% for AGIs $25k-50k, 4925.0% for AGIs $50k-75k, 8375.0% for AGIs $75k-100k, 17576.7% for AGIs $100k-200k)
Taxable interest for individuals: $664 (reported on 42.4% of returns)
This zip code:
$664
Illinois:
$2,376
(% of AGI for various income ranges: 17.1% for AGIs below $25k, 30.0% for AGIs $25k-50k, 20.0% for AGIs $75k-100k, 196.7% for AGIs $100k-200k)
Ordinary dividends: $1,300 (reported on 15.2% of returns)
Here:
$1,300
State:
$9,061
(% of AGI for various income ranges: 17.1% for AGIs below $25k, 265.0% for AGIs $75k-100k)
Net capital gain/loss in AGI: +$1,950 (reported on 12.1% of returns)
Here:
+$1,950
State:
+$31,684
(% of AGI for various income ranges: 195.0% for AGIs $50k-75k)
Profit/loss from business: +$4,167 (reported on 9.1% of returns)
Here:
+$4,167
State:
+$12,175
(% of AGI for various income ranges: 208.3% for AGIs $25k-50k)
Earned income credit: $1,975 (reported on 12.1% of returns)
Here:
$1,975
State:
$2,311
(% of AGI for various income ranges: 112.9% for AGIs below $25k)
Percentage of individuals using paid preparers for their 2020 taxes: 93.9%
Here:
94%
State:
93%
(% for various income ranges: 100.0% for AGIs below $25k, 87.5% for AGIs $25k-50k, 80.0% for AGIs $50k-75k, 100.0% for AGIs $75k-100k, 100.0% for AGIs $100k-200k)
Averages for the 2012 tax year for zip code 62032, filed in 2013:
Average Adjusted Gross Income (AGI) in 2012: $47,311 (Individual Income Tax Returns)
Here:
$47,311
State:
$68,058
Salary/wage: $37,069 (reported on 82.9% of returns)
Here:
$37,069
State:
$55,396
(% of AGI for various income ranges: 66.6% for AGIs below $25k, 67.2% for AGIs $25k-50k, 81.2% for AGIs $50k-75k, 74.8% for AGIs $75k-100k, 42.3% for AGIs $100k-200k)
Taxable interest for individuals: $864 (reported on 40.0% of returns)
This zip code:
$864
Illinois:
$1,969
(% of AGI for various income ranges: 1.1% for AGIs below $25k, 0.7% for AGIs $25k-50k, 0.3% for AGIs $50k-75k, 0.2% for AGIs $75k-100k, 1.3% for AGIs $100k-200k)
Ordinary dividends: $460 (reported on 14.3% of returns)
Here:
$460
State:
$7,786
Net capital gain/loss in AGI: +$533 (reported on 8.6% of returns)
Here:
+$533
State:
+$22,183
Profit/loss from business: +$4,440 (reported on 14.3% of returns)
Here:
+$4,440
State:
+$12,903
Taxable individual retirement arrangement distribution: $3,700 (reported on 5.7% of returns)
62032:
$3,700
Illinois:
$17,929
Total itemized deductions: $17,367 (24% of AGI, reported on 17.1% of returns)
Here:
$17,367
State:
$26,433
Here:
24.4% of AGI
State:
19.2% of AGI
Charity contributions: $2,900 (reported on 8.6% of returns)
Here:
$2,900
State:
$4,525
Taxes paid: $5,050 (reported on 17.1% of returns)
62032:
$5,050
State:
$11,968
Earned income credit: $2,367 (reported on 17.1% of returns)
Here:
$2,367
State:
$2,349
(% of AGI for various income ranges: 8.1% for AGIs below $25k)
Percentage of individuals using paid preparers for their 2012 taxes: 74.3%
Here:
74%
State:
57%
(% for various income ranges: 66.7% for AGIs below $25k, 66.7% for AGIs $25k-50k, 71.4% for AGIs $50k-75k, 100.0% for AGIs $75k-100k, 100.0% for AGIs $100k-200k)
Averages for the 2004 tax year for zip code 62032, filed in 2005:
Average Adjusted Gross Income (AGI) in 2004: $33,214 (Individual Income Tax Returns)
Here:
$33,214
State:
$54,625
Salary/wage: $27,769 (reported on 87.9% of returns)
Here:
$27,769
State:
$46,811
(% of AGI for various income ranges: 98.0% for AGIs below $10k, 80.5% for AGIs $10k-25k, 68.8% for AGIs $25k-50k, 84.1% for AGIs $50k-75k, 75.3% for AGIs $75k-100k, 48.0% for AGIs over 100k)
Taxable interest for individuals: $1,792 (reported on 44.8% of returns)
This zip code:
$1,792
Illinois:
$2,101
(% of AGI for various income ranges: 3.3% for AGIs below $10k, 1.5% for AGIs $10k-25k, 3.1% for AGIs $25k-50k, 0.5% for AGIs $50k-75k, 1.3% for AGIs $75k-100k, 6.5% for AGIs over 100k)
Taxable dividends: $268 (reported on 15.8% of returns)
Here:
$268
State:
$4,306
(% of AGI for various income ranges: 0.0% for AGIs below $10k, 0.3% for AGIs $25k-50k, 0.1% for AGIs $50k-75k, 0.1% for AGIs $75k-100k)
Net capital gain/loss: +$537 (reported on 11.5% of returns)
Here:
+$537
State:
+$17,321
Profit/loss from business: +$500 (reported on 13.0% of returns)
Here:
+$500
State:
+$11,771
Profit/loss from farming: +$4,261 (reported on 13.0% of returns)
Here:
+$4,261
State:
+$2,327
IRA payment deduction: $3,091 (reported on 3.1% of returns)
62032:
$3,091
Illinois:
$3,087
Total itemized deductions: $12,625 (22% of AGI, reported on 15.8% of returns)
Here:
$12,625
State:
$20,239
Here:
22.3% of AGI
State:
19.5% of AGI
Charity contributions deductions: $1,714 (3% of AGI, reported on 7.9% of returns)
Here:
$1,714
State:
$3,719
Here:
2.8% of AGI
State:
3.4% of AGI
Total tax: $3,923 (reported on 69.9% of returns)
62032:
$3,923
State:
$9,882
(% of AGI for various income ranges: 1.5% for AGIs below $10k, 4.2% for AGIs $10k-25k, 6.3% for AGIs $25k-50k, 8.4% for AGIs $50k-75k, 12.0% for AGIs $75k-100k, 15.1% for AGIs over 100k)
Earned income credit: $1,863 (reported on 14.4% of returns)
Here:
$1,863
State:
$1,788
Percentage of individuals using paid preparers for their 2004 taxes: 70.7%
Here:
71%
State:
61%
(% for various income ranges: 55.1% for AGIs below $10k, 77.4% for AGIs $10k-25k, 75.0% for AGIs $25k-50k, 72.2% for AGIs $50k-75k, 75.0% for AGIs $75k-100k, 91.7% for AGIs over 100k)
Household received Food Stamps/SNAP in the past 12 months: 49 Household did not receive Food Stamps/SNAP in the past 12 months: 282
Women who had a birth in the past 12 months: 2 (0 now married, 2 unmarried) Women who did not have a birth in the past 12 months: 110 (23 now married, 87 unmarried)
Housing units in zip code 62032 with a mortgage: 68 (1 second mortgage) Median monthly owner costs for units with a mortgage: $1,021 Median monthly owner costs for units without a mortgage: $367
Residents with income below the poverty level in 2022:
This zip code:
17.6%
Whole state:
11.9%
Residents with income below 50% of the poverty level in 2022:
This zip code:
16.4%
Whole state:
5.7%
Median number of rooms in houses and condos:
Here:
6.6
State:
6.4
Median number of rooms in apartments:
Here:
6.1
State:
4.1
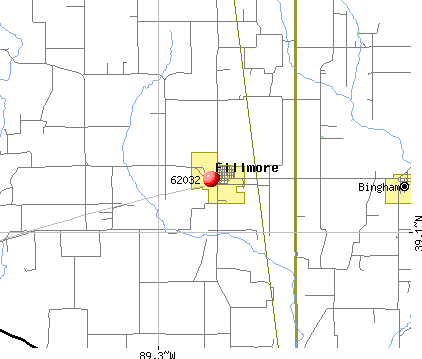
Notable locations in this zip code not listed on our city pages
Churches in zip code 62032 include: Fillmore Baptist Church (A), Saint Matthew Lutheran Church (B), Hurricane Church (C). Display/hide their locations on the map
Cemeteries: Walker Cemetery (1), Williamson Cemetery (2), Casey Cemetery (3), Hurricane Cemetery (4), Renshaw Cemetery (5), Green Hill Cemetery (6), Glendale Cemetery (7). Display/hide their locations on the map
Size of family households: 101 2-persons, 40 3-persons, 20 4-persons, 4 5-persons, 1 6-persons, 3 7-or-more-persons
Size of nonfamily households: 141 1-person, 6 2-persons, 14 3-persons
88 married couples with children.
2 single-parent households (2 men).
99.2% of residents of 62032 zip code speak English at home.
0.7% of residents speak other Indo-European language at home (100% very well).
Foreign born population: 2 (0.4%) (0.0% of them are naturalized citizens)
:
0.4%
Whole state:
14.4%
67%Malaysia
44%German
22%European
12%American
6%Irish
3%English
2%Polish
1%Norwegian
Year of entry for the foreign-born population
02010 or later
02000 to 2009
01990 to 1999
2Before 1990
Facilities with environmental interests located in this zip code:
MOBIL OIL CORP (MAIN ST. & FILLMORE RD. in FILLMORE, IL)
STATE MASTER (Illinois EPA Project) - AIR PROGRAM AIR MINOR (AIRS/AFS) CRITERIA AND HAZARDOUS AIR POLLUTANT INVENTORY (Inventory of air pollution sources) Business SIC classification: PETROLEUM BULK STATIONS AND TERMINALS Alternative names: EXXON MOBIL OIL CORPORATION
ROUTE 16 GRAIN COOP (317 S MAIN ST in FILLMORE, IL)
STATE MASTER (Illinois EPA Project) - AIR PROGRAM AIR MINOR (AIRS/AFS) CRITERIA AND HAZARDOUS AIR POLLUTANT INVENTORY (Inventory of air pollution sources) Business SIC classification: GRAIN AND FIELD BEANS Alternative names: RT 16 GRAIN COOP
GREENVILLE SERVICE CO-FILLMORE BULK PLT (FILLMORE TOWNSHIP in FILLMORE, IL)
STATE MASTER (Illinois EPA Project) - AIR PROGRAM AIR MINOR (AIRS/AFS) Business SIC classification: PETROLEUM BULK STATIONS AND TERMINALS
COUNTRY GRAIN ELEVATORS INC (MAIN STREET in FILLMORE, IL)
STATE MASTER (Illinois EPA Project) - AIR PROGRAM AIR MINOR (AIRS/AFS) Business SIC classification: GRAIN AND FIELD BEANS
AMOCO FERTILIZER PLANT (HWY 185 E in VAN BURENSBURG, IL)
(Resource Conservation and Recovery Act (tracking hazardous waste))
AT AND T (RT 185 MULBERRY GROVE RD in VAN BURENSBURG, IL)
Conditionally Exempt Small Quantity Generators, less than 100 kg/month of hazardous waste (Resource Conservation and Recovery Act (tracking hazardous waste)) - notification Organizations: AT & T (CONTACT/OWNER)
Alternative names: AT AND T VANBURENSBURG
M & M SERVICE CO. (FILLMORE) (320 COUTH MAIN, PO BOX 3 in FILLMORE, IL)
ENFORCEMENT/COMPLIANCE ACTIVITY (Integrated Compliance Information System)
CROPMATE FERT CO (PO BOX 71 in FILLMORE, IL)
COMPLIANCE ACTIVITY (Tracking inspections of insecticide, fungicide, and rodenticide, and toxic substances)
CROPMATE FERTILIZER CO (IL RTE 185 VAN BURENSBURG in FILLMORE, IL)
COMPLIANCE ACTIVITY (Tracking inspections of insecticide, fungicide, and rodenticide, and toxic substances)
Housing units lacking complete plumbing facilities: 1.0% Housing units lacking complete kitchen facilities: 1.0%
53.0%Bottled, tank, or LP gas
26.5%Utility gas
10.5%Electricity
5.6%Wood
2.8%Other fuel
2.2%Fuel oil, kerosene, etc.
Population in 1990: 977.
Place of birth for U.S.-born residents:
This state: 607
Midwest: 31
South: 29
West: 70
71% of the 62032 zip code residents lived in the same house 5 years ago. Out of people who lived in different houses, 52% lived in this county. Out of people who lived in different counties, 50% lived in Illinois.
99% of the 62032 zip code residents lived in the same house 1 year ago. Out of people who lived in different houses, 75% moved from this county. Out of people who lived in different houses, 25% moved from different county within same state.
Private vs. public school enrollment:
Students in private schools in grades 1 to 8 (elementary and middle school):
Here:
0.0%
Illinois:
13.3%
Students in private schools in grades 9 to 12 (high school):
Here:
0.0%
Illinois:
9.9%
Students in private undergraduate colleges:
Here:
0.0%
Illinois:
27.4%
Occupation by median earnings in the past 12 months ($)
147,628Management occupations
124,017Construction and extraction occupations
41,466Installation, maintenance, and repair occupations
35,557Production occupations
32,088Transportation occupations
14,872Office and administrative support occupations
Top industries in this zip code by the number of employees in 2005:
Arts, Entertainment, and Recreation: Golf Courses and Country Clubs (5-9 employees: 1 establishment)
Other Services (except Public Administration): Funeral Homes and Funeral Services (1-4: 2)
Accommodation and Food Services: Full-Service Restaurants (1-4: 1)
Finance and Insurance: Commercial Banking (1-4: 1)
Construction: Roofing Contractors (1-4: 1)
Fatal accident statistics in 2010:
Fatal accident count: 2
Vehicles involved in fatal accidents: 2
Fatal accidents caused by drunken drivers: 0
Fatalities: 2
Persons involved in fatal accidents: 2
Pedestrians involved in fatal accidents: 0
2002 - 2018 National Fire Incident Reporting System (NFIRS) incidents
Based on the data from the years 2002 - 2018 the average number of fires per year is 12. The highest number of reported fire incidents - 23 took place in 2009, and the least - 2 in 2013. The data has an increasing trend.
When looking into fire subcategories, the most incidents belonged to: Structure Fires (43.7%), and Outside Fires (38.8%).
Fire incident types reported to NFIRS in Zip Code 62032


 Nearest zip codes: 62011, 62017, 62051, 62094, 62262, 62019.


 Based on the data from the years 2002 - 2018 the average number of fires per year is 12. The highest number of reported fire incidents - 23 took place in 2009, and the least - 2 in 2013. The data has an increasing trend.
 When looking into fire subcategories, the most incidents belonged to: Structure Fires (43.7%), and Outside Fires (38.8%).