Estimated zip code population in 2022: 1,870 Zip code population in 2010: 3,214 Zip code population in 2000: 3,832
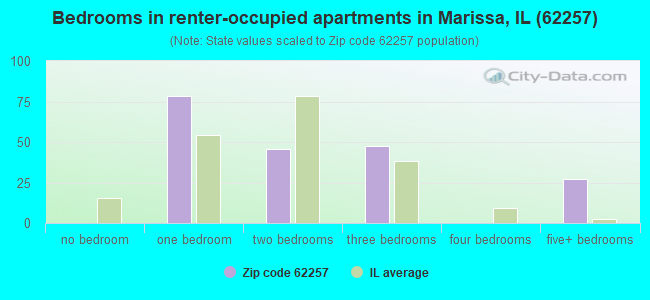
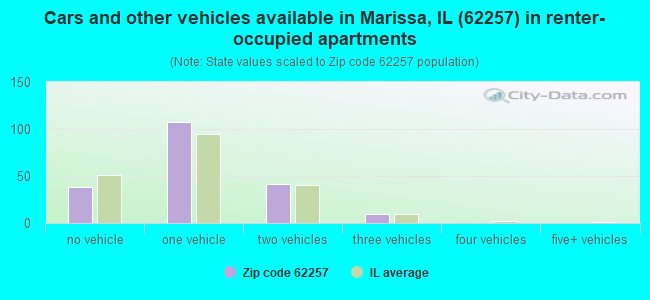
Houses and condos: 1,105 Renter-occupied apartments: 197
% of renters here:
21%
State:
33%
March 2022 cost of living index in zip code 62257: 92.0 (less than average, U.S. average is 100)
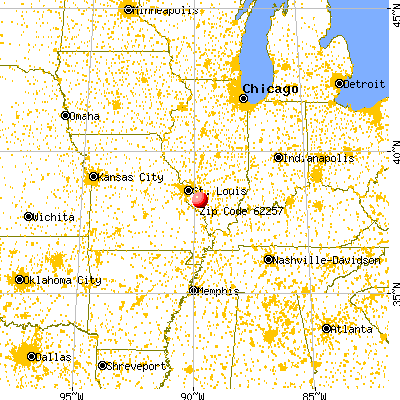
Land area: 73.6 sq. mi. Water area: 1.1 sq. mi.
Population density: 25 people per square mile
(very low).
OSM Map
General Map
Google Map
MSN Map
OSM Map
General Map
Google Map
MSN Map
OSM Map
General Map
Google Map
MSN Map
OSM Map
General Map
Google Map
MSN Map
Please wait while loading the map...
Real estate property taxes paid for housing units in 2022:
This zip code:
2.0% ($2,146)
Illinois:
2.0% ($4,912)
Median real estate property taxes paid for housing units with mortgages in 2022: $2,295 (1.7%) Median real estate property taxes paid for housing units with no mortgage in 2022: $1,849 (1.9%)
Business Search- 14 Million verified businesses
Males: 934
(49.9%)
Females: 936
(50.1%)
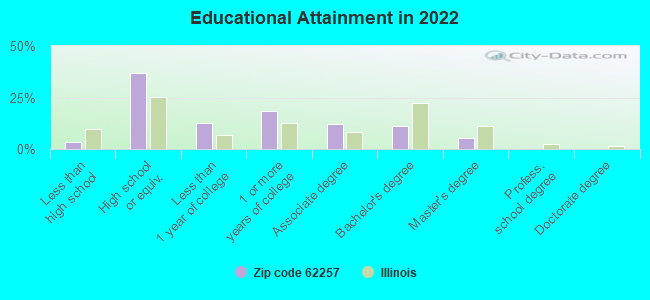
For population 25 years and over in 62257:
High school or higher: 95.5%
Bachelor's degree or higher: 16.6%
Graduate or professional degree: 5.4%
Unemployed: 7.9%
Mean travel time to work (commute): 24.3 minutes
For population 15 years and over in 62257:
Never married: 29.6%
Now married: 52.6%
Separated: 1.4%
Widowed: 7.0%
Divorced: 9.4%
Zip code 62257 compared to state average:
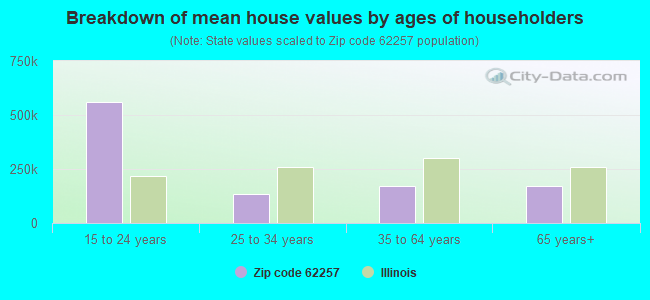
Median house value significantly below state average.
Black race population percentage significantly below state average.
Hispanic race population percentage significantly below state average.
Median age significantly above state average.
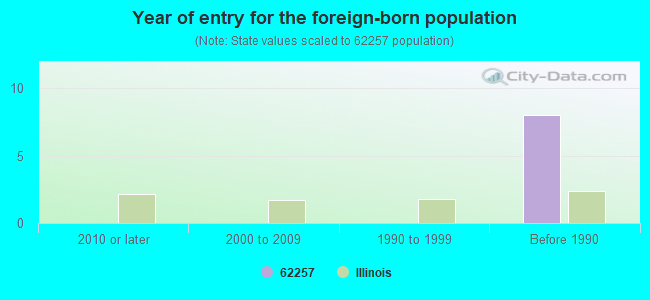
Foreign-born population percentage significantly below state average.
Renting percentage below state average.
Length of stay since moving in significantly above state average.
Number of college students below state average.
Percentage of population with a bachelor's degree or higher below state average.
Averages for the 2020 tax year for zip code 62257, filed in 2021:
Average Adjusted Gross Income (AGI) in 2020: $56,911 (Individual Income Tax Returns)
Here:
$56,911
State:
$82,626
Salary/wage: $48,096 (reported on 77.4% of returns)
Here:
$48,096
State:
$66,640
(% of AGI for various income ranges: 1107.1% for AGIs below $25k, 3353.5% for AGIs $25k-50k, 6152.9% for AGIs $50k-75k, 8662.0% for AGIs $75k-100k, 12095.7% for AGIs $100k-200k)
Taxable interest for individuals: $1,102 (reported on 36.1% of returns)
This zip code:
$1,102
Illinois:
$2,376
(% of AGI for various income ranges: 35.0% for AGIs below $25k, 33.5% for AGIs $25k-50k, 80.0% for AGIs $50k-75k, 48.0% for AGIs $75k-100k, 106.4% for AGIs $100k-200k)
Ordinary dividends: $3,592 (reported on 18.8% of returns)
Here:
$3,592
State:
$9,061
(% of AGI for various income ranges: 12.1% for AGIs below $25k, 28.3% for AGIs $25k-50k, 81.4% for AGIs $50k-75k, 158.0% for AGIs $75k-100k, 371.4% for AGIs $100k-200k)
Net capital gain/loss in AGI: +$5,074 (reported on 17.3% of returns)
Here:
+$5,074
State:
+$31,684
(% of AGI for various income ranges: 12.9% for AGIs below $25k, 22.2% for AGIs $25k-50k, 65.7% for AGIs $50k-75k, 166.0% for AGIs $75k-100k, 581.4% for AGIs $100k-200k)
Profit/loss from business: +$6,358 (reported on 9.0% of returns)
Here:
+$6,358
State:
+$12,175
(% of AGI for various income ranges: 95.0% for AGIs below $25k, 44.3% for AGIs $50k-75k, 270.0% for AGIs $100k-200k)
Taxable individual retirement arrangement distribution: $11,357 (reported on 10.5% of returns)
62257:
$11,357
Illinois:
$21,613
(% of AGI for various income ranges: 50.9% for AGIs below $25k, 62.2% for AGIs $25k-50k, 222.1% for AGIs $50k-75k, 380.0% for AGIs $75k-100k, 416.4% for AGIs $100k-200k)
Total itemized deductions: $28,375 (reported on 3.0% of returns)
Here:
$28,375
State:
$34,948
(% of AGI for various income ranges: 1135.0% for AGIs $75k-100k)
Charity contributions: $6,900 (reported on 2.3% of returns)
Here:
$6,900
State:
$13,122
(% of AGI for various income ranges: 147.9% for AGIs $50k-75k)
Taxes paid: $5,825 (reported on 3.0% of returns)
62257:
$5,825
State:
$8,563
(% of AGI for various income ranges: 233.0% for AGIs $75k-100k)
Earned income credit: $2,252 (reported on 15.8% of returns)
Here:
$2,252
State:
$2,311
(% of AGI for various income ranges: 92.9% for AGIs below $25k, 68.3% for AGIs $25k-50k)
Percentage of individuals using paid preparers for their 2020 taxes: 94.0%
Here:
94%
State:
93%
(% for various income ranges: 93.8% for AGIs below $25k, 96.6% for AGIs $25k-50k, 95.0% for AGIs $50k-75k, 92.9% for AGIs $75k-100k, 94.7% for AGIs $100k-200k, 66.7% for AGIs over 200k)
Averages for the 2012 tax year for zip code 62257, filed in 2013:
Average Adjusted Gross Income (AGI) in 2012: $50,815 (Individual Income Tax Returns)
Here:
$50,815
State:
$68,058
Salary/wage: $41,670 (reported on 82.2% of returns)
Here:
$41,670
State:
$55,396
(% of AGI for various income ranges: 65.5% for AGIs below $25k, 73.1% for AGIs $25k-50k, 74.7% for AGIs $50k-75k, 75.8% for AGIs $75k-100k, 86.8% for AGIs $100k-200k)
Taxable interest for individuals: $1,558 (reported on 38.5% of returns)
This zip code:
$1,558
Illinois:
$1,969
(% of AGI for various income ranges: 2.2% for AGIs below $25k, 1.2% for AGIs $25k-50k, 1.5% for AGIs $50k-75k, 0.7% for AGIs $75k-100k, 0.6% for AGIs $100k-200k, 1.5% for AGIs over 200k)
Ordinary dividends: $2,397 (reported on 23.7% of returns)
Here:
$2,397
State:
$7,786
(% of AGI for various income ranges: 1.4% for AGIs below $25k, 0.7% for AGIs $25k-50k, 0.7% for AGIs $50k-75k, 0.5% for AGIs $75k-100k, 2.7% for AGIs $100k-200k)
Net capital gain/loss in AGI: +$2,210 (reported on 15.6% of returns)
Here:
+$2,210
State:
+$22,183
(% of AGI for various income ranges: 0.3% for AGIs $25k-50k, 0.7% for AGIs $75k-100k, 2.2% for AGIs $100k-200k)
Profit/loss from business: +$6,994 (reported on 11.9% of returns)
Here:
+$6,994
State:
+$12,903
(% of AGI for various income ranges: 6.1% for AGIs below $25k, 0.2% for AGIs $25k-50k, 1.8% for AGIs $50k-75k, 2.8% for AGIs $100k-200k)
Taxable individual retirement arrangement distribution: $8,314 (reported on 10.4% of returns)
62257:
$8,314
Illinois:
$17,929
(% of AGI for various income ranges: 2.4% for AGIs below $25k, 1.2% for AGIs $25k-50k, 2.6% for AGIs $50k-75k, 3.1% for AGIs $100k-200k)
Total itemized deductions: $18,642 (18% of AGI, reported on 19.3% of returns)
Here:
$18,642
State:
$26,433
Here:
18.5% of AGI
State:
19.2% of AGI
(% of AGI for various income ranges: 8.9% for AGIs $25k-50k, 6.0% for AGIs $50k-75k, 5.9% for AGIs $75k-100k, 13.8% for AGIs $100k-200k)
Charity contributions: $3,547 (reported on 12.6% of returns)
Here:
$3,547
State:
$4,525
(% of AGI for various income ranges: 0.7% for AGIs $25k-50k, 0.5% for AGIs $50k-75k, 1.0% for AGIs $75k-100k, 2.0% for AGIs $100k-200k)
Taxes paid: $7,265 (reported on 19.3% of returns)
62257:
$7,265
State:
$11,968
(% of AGI for various income ranges: 2.2% for AGIs $25k-50k, 2.4% for AGIs $50k-75k, 2.2% for AGIs $75k-100k, 6.3% for AGIs $100k-200k)
Earned income credit: $2,388 (reported on 18.5% of returns)
Here:
$2,388
State:
$2,349
(% of AGI for various income ranges: 7.5% for AGIs below $25k, 1.0% for AGIs $25k-50k)
Percentage of individuals using paid preparers for their 2012 taxes: 61.5%
Here:
61%
State:
57%
(% for various income ranges: 53.8% for AGIs below $25k, 63.6% for AGIs $25k-50k, 59.1% for AGIs $50k-75k, 69.2% for AGIs $75k-100k, 76.9% for AGIs $100k-200k, 100.0% for AGIs over 200k)
Averages for the 2004 tax year for zip code 62257, filed in 2005:
Average Adjusted Gross Income (AGI) in 2004: $37,575 (Individual Income Tax Returns)
Here:
$37,575
State:
$54,625
Salary/wage: $32,373 (reported on 82.8% of returns)
Here:
$32,373
State:
$46,811
(% of AGI for various income ranges: 85.1% for AGIs below $10k, 66.4% for AGIs $10k-25k, 73.2% for AGIs $25k-50k, 77.0% for AGIs $50k-75k, 74.7% for AGIs $75k-100k, 56.7% for AGIs over 100k)
Taxable interest for individuals: $1,942 (reported on 46.1% of returns)
This zip code:
$1,942
Illinois:
$2,101
(% of AGI for various income ranges: 5.0% for AGIs below $10k, 3.7% for AGIs $10k-25k, 2.9% for AGIs $25k-50k, 1.8% for AGIs $50k-75k, 2.1% for AGIs $75k-100k, 1.5% for AGIs over 100k)
Taxable dividends: $2,577 (reported on 24.0% of returns)
Here:
$2,577
State:
$4,306
(% of AGI for various income ranges: 0.7% for AGIs below $10k, 1.5% for AGIs $10k-25k, 1.0% for AGIs $25k-50k, 0.6% for AGIs $50k-75k, 2.1% for AGIs $75k-100k, 4.0% for AGIs over 100k)
Net capital gain/loss: +$2,770 (reported on 15.7% of returns)
Here:
+$2,770
State:
+$17,321
(% of AGI for various income ranges: -1.1% for AGIs below $10k, 0.0% for AGIs $10k-25k, 1.5% for AGIs $25k-50k, 0.4% for AGIs $50k-75k, 1.4% for AGIs $75k-100k, 2.7% for AGIs over 100k)
Profit/loss from business: +$7,661 (reported on 11.6% of returns)
Here:
+$7,661
State:
+$11,771
(% of AGI for various income ranges: -1.9% for AGIs below $10k, 3.0% for AGIs $10k-25k, 1.9% for AGIs $25k-50k, 2.5% for AGIs $50k-75k, 1.8% for AGIs $75k-100k, 3.8% for AGIs over 100k)
Profit/loss from farming: +$3,880 (reported on 5.0% of returns)
Here:
+$3,880
State:
+$2,327
(% of AGI for various income ranges: 0.4% for AGIs $10k-25k, 0.9% for AGIs $25k-50k, 0.8% for AGIs $50k-75k, 0.3% for AGIs $75k-100k)
IRA payment deduction: $3,078 (reported on 3.4% of returns)
62257:
$3,078
Illinois:
$3,087
Total itemized deductions: $15,000 (21% of AGI, reported on 14.2% of returns)
Here:
$15,000
State:
$20,239
Here:
20.9% of AGI
State:
19.5% of AGI
(% of AGI for various income ranges: 4.9% for AGIs $10k-25k, 4.7% for AGIs $25k-50k, 5.3% for AGIs $50k-75k, 7.1% for AGIs $75k-100k, 7.4% for AGIs over 100k)
Charity contributions deductions: $3,428 (4% of AGI, reported on 10.1% of returns)
Here:
$3,428
State:
$3,719
Here:
4.2% of AGI
State:
3.4% of AGI
(% of AGI for various income ranges: 0.6% for AGIs $25k-50k, 0.8% for AGIs $50k-75k, 1.7% for AGIs $75k-100k, 1.7% for AGIs over 100k)
Total tax: $4,770 (reported on 75.0% of returns)
62257:
$4,770
State:
$9,882
(% of AGI for various income ranges: 1.9% for AGIs below $10k, 4.2% for AGIs $10k-25k, 6.9% for AGIs $25k-50k, 9.1% for AGIs $50k-75k, 11.1% for AGIs $75k-100k, 17.7% for AGIs over 100k)
Earned income credit: $1,517 (reported on 15.6% of returns)
Here:
$1,517
State:
$1,788
Percentage of individuals using paid preparers for their 2004 taxes: 68.2%
Here:
68%
State:
61%
(% for various income ranges: 57.4% for AGIs below $10k, 68.7% for AGIs $10k-25k, 70.1% for AGIs $25k-50k, 70.7% for AGIs $50k-75k, 75.2% for AGIs $75k-100k, 78.5% for AGIs over 100k)
Likely homosexual households (counted as self-reported same-sex unmarried-partner households)
Lesbian couples: 0.6% of all households
Gay men: 0.0% of all households
Household received Food Stamps/SNAP in the past 12 months: 218 Household did not receive Food Stamps/SNAP in the past 12 months: 714
Women who had a birth in the past 12 months: 22 (22 now married, 0 unmarried) Women who did not have a birth in the past 12 months: 391 (143 now married, 248 unmarried)
Housing units in zip code 62257 with a mortgage: 399 (31 second mortgage, 31 both second mortgage and home equity loan) Houses without a mortgage: 90
Median monthly owner costs for units with a mortgage: $1,163 Median monthly owner costs for units without a mortgage: $518
Residents with income below the poverty level in 2022:
This zip code:
11.2%
Whole state:
11.9%
Residents with income below 50% of the poverty level in 2022:
This zip code:
6.6%
Whole state:
5.7%
Median number of rooms in houses and condos:
Here:
6.1
State:
6.4
Median number of rooms in apartments:
Here:
3.9
State:
4.1
Notable locations in this zip code not listed on our city pages
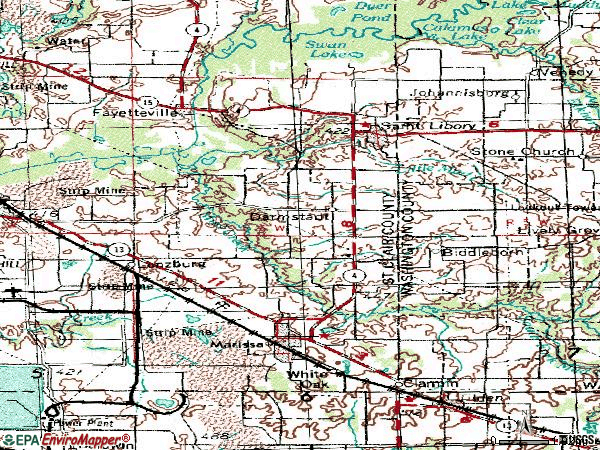
Notable locations in zip code 62257: Marissa Waterworks (A), Marissa Sewage Treatment Plant (B), Cottonwood Hills Landfill (C), Lively Grove Townhall (D), MedStar Ambulance (E), Marissa Volunteer Fire Protection District (F). Display/hide their locations on the map
Reservoirs: Marissa Recreation Association Lake (A), Marissa Reservoir (B), Marissa Recreation Association South Lake (C). Display/hide their locations on the map
Size of family households: 364 2-persons, 68 3-persons, 85 4-persons, 40 5-persons, 3 6-persons
Size of nonfamily households: 303 1-person, 59 2-persons
157 married couples with children.
92 single-parent households (8 men, 84 women).
99.0% of residents of 62257 zip code speak English at home.
0.4% of residents speak Spanish at home (100% very well).
0.4% of residents speak other Indo-European language at home (100% very well).
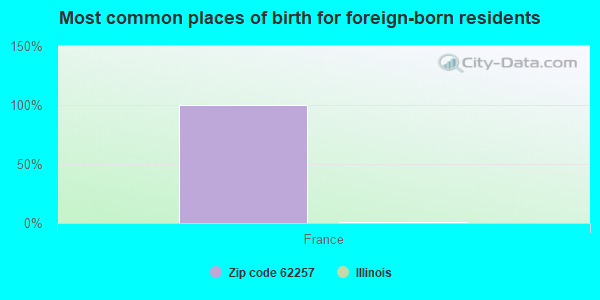
Foreign born population: 2 (0.2%) (0.0% of them are naturalized citizens)
:
0.2%
Whole state:
14.4%
100%France
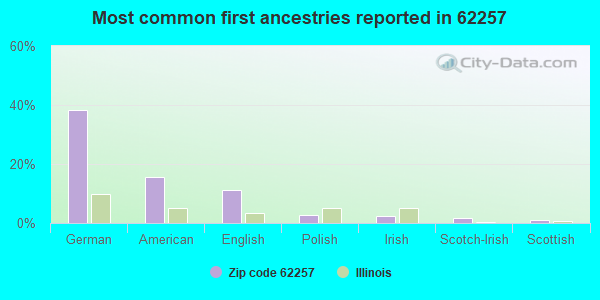
38%German
16%American
11%English
3%Polish
2%Irish
2%Scotch-Irish
1%Scottish
Year of entry for the foreign-born population
02010 or later
02000 to 2009
01990 to 1999
8Before 1990
Major facilities with environmental interests located in this zip code:
PEABODY COAL CO MARISSA MINE (1214 MARISSA ROAD in MARISSA, IL)
STATE MASTER (Illinois EPA Project) - SOLID WASTE PROGRAM, HAZARDOUS WASTE PROGRAM, AIR PROGRAM STATE MASTER (Illinois EPA Project) - AIR PROGRAM AIR MINOR (AIRS/AFS) CRITERIA AND HAZARDOUS AIR POLLUTANT INVENTORY (Inventory of air pollution sources) Business SIC classification: BITUMINOUS COAL UNDERGROUND MINING; NONCLASSIFIABLE ESTABLISHMENTS
PEABODY COAL CO (CTY RD 18 in MARISSA, IL)
STATE MASTER (Illinois EPA Project) - National Pollutant Discharge Elimination System Permit National Pollutant Discharge Elimination System NON-MAJOR (Tracking pollutant discharge elimination systems) - permit National Pollutant Discharge Elimination System NON-MAJOR (Tracking pollutant discharge elimination systems) - permit Organizations: PEABODY COAL CO. (CONTACT/OWNER)
MARISSA STP (WEST 8TH STREET in MARISSA, IL)
STATE MASTER (Illinois EPA Project) - National Pollutant Discharge Elimination System Permit National Pollutant Discharge Elimination System NON-MAJOR (Tracking pollutant discharge elimination systems) - permit National Pollutant Discharge Elimination System NON-MAJOR (Tracking pollutant discharge elimination systems) - permit Business SIC classification: SEWERAGE SYSTEMS Alternative names: MARISSA STP, VILLAGE OF, MARISSA, VILLAGE OF
PRAIRIE STATE GENERATING STATION (MARIGOLD ROAD & COUNTY HIGHWAY 12 in MARISSA, IL)
STATE MASTER (Illinois EPA Project) - AIR PROGRAM AIR MINOR (AIRS/AFS) National Pollutant Discharge Elimination System NON-MAJOR (Tracking pollutant discharge elimination systems) - permit Business SIC classification: ELECTRIC SERVICES Alternative names: PRAIRIE STATE GENERATING CO
CROP PRODUCTION SERVICES INC (RR 2 in MARISSA, IL)
STATE MASTER (Illinois EPA Project) - AIR PROGRAM AIR MINOR (AIRS/AFS) CRITERIA AND HAZARDOUS AIR POLLUTANT INVENTORY (Inventory of air pollution sources) Business SIC classification: FARM SUPPLIES
PEABODY COAL CO RIVER KING 6 (6 MI S W OF MARISSA in MARISSA, IL)
STATE MASTER (Illinois EPA Project) - SOLID WASTE PROGRAM, HAZARDOUS WASTE PROGRAM Small Quantity Generators, between 100 kg and 1000 kg of hazardous waste/month (Resource Conservation and Recovery Act (tracking hazardous waste)) - notification Alternative names: PEABODY COAL CO RIVER KING PIT NO 6 MINE
PEABODY COAL COMPANY (P. O. BOX 77 in MARISSA, IL)
STATE MASTER (Illinois EPA Project) - National Pollutant Discharge Elimination System Permit National Pollutant Discharge Elimination System NON-MAJOR (Tracking pollutant discharge elimination systems) - permit Business SIC classification: BITUMINOUS COAL AND LIGNITE SURFACE MINING Alternative names: PEABODY COAL COMPANY-RANDOLPH, PEABODY COAL CO-RANDOLPH PREP, PEABODY COAL CO-RANDOLPH PREP
RIESS FORD BODY SHOP (307 N MAIN in MARISSA, IL)
STATE MASTER (Illinois EPA Project) - SOLID WASTE PROGRAM, HAZARDOUS WASTE PROGRAM Conditionally Exempt Small Quantity Generators, less than 100 kg/month of hazardous waste (Resource Conservation and Recovery Act (tracking hazardous waste)) Organizations: RIESS FORD SALES INC (CONTACT/OWNER)
KATHRYN ALBERT ESTATE (1201 N MAIN in MARISSA, IL)
STATE MASTER (Illinois EPA Project) - SOLID WASTE PROGRAM, HAZARDOUS WASTE PROGRAM Conditionally Exempt Small Quantity Generators, less than 100 kg/month of hazardous waste (Resource Conservation and Recovery Act (tracking hazardous waste)) - notification Organizations: ESTATE OF KATHRYN ALBERT (CONTACT/OWNER)
Alternative names: ESTATE OF KATHRYN ALBERT
PAULS PAINT & AUTO BODY (222 HONEYSUCKLE RD in MARISSA, IL)
STATE MASTER (Illinois EPA Project) - HAZARDOUS WASTE PROGRAM Conditionally Exempt Small Quantity Generators, less than 100 kg/month of hazardous waste (Resource Conservation and Recovery Act (tracking hazardous waste)) - notification Organizations: SCHMIDT PAUL (CONTACT/OWNER)
COLLISION CUSTOM AUTOBODY (803 E LYONS ST in MARISSA, IL)
STATE MASTER (Illinois EPA Project) - HAZARDOUS WASTE PROGRAM Conditionally Exempt Small Quantity Generators, less than 100 kg/month of hazardous waste (Resource Conservation and Recovery Act (tracking hazardous waste)) - notification Organizations: MCCLINTOCK (CONTACT/OWNER)
MARISSA ELEM SCHOOL (206 E FULTON ST in MARISSA, IL)
(National Center for Education Statistics) - STATE ID-5008204002002 Organizations: MARISSA C U SCH DIST 40 (SCHOOL DISTRICT)
MARISSA JR & SR HIGH SCHOOL (300 SCHOOL VIEW DR in MARISSA, IL)
(National Center for Education Statistics) - STATE ID-5008204000001 Organizations: MARISSA C U SCH DIST 40 (SCHOOL DISTRICT)
Housing units lacking complete plumbing facilities: 3.2% Housing units lacking complete kitchen facilities: 2.2%
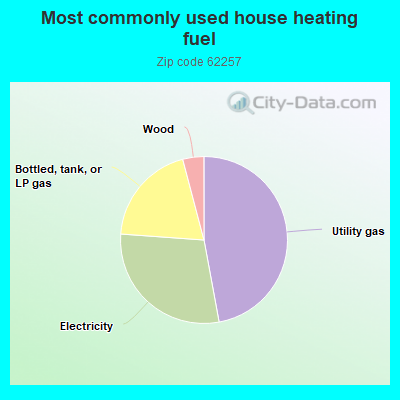
47.2%Utility gas
29.1%Electricity
19.8%Bottled, tank, or LP gas
4.1%Wood
Population in 1990: 2,634. Population change in the 1990s: +1,198 (+45.5%).
Place of birth for U.S.-born residents:
This state: 1,553
Midwest: 185
South: 45
West: 71
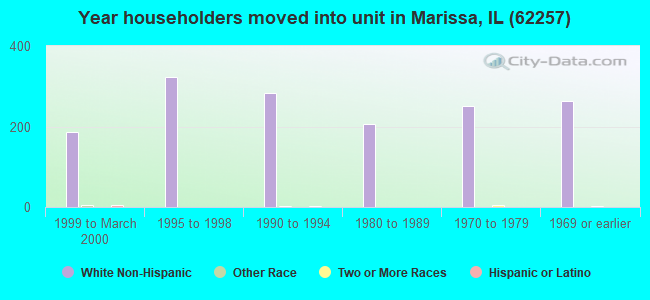
68% of the 62257 zip code residents lived in the same house 5 years ago. Out of people who lived in different houses, 62% lived in this county. Out of people who lived in different counties, 50% lived in Illinois.
98% of the 62257 zip code residents lived in the same house 1 year ago. Out of people who lived in different houses, 55% moved from this county. Out of people who lived in different houses, 41% moved from different state.
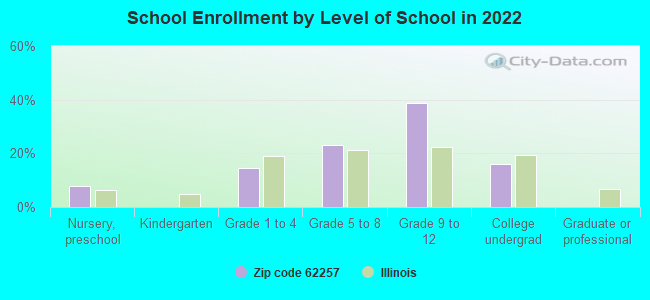
Private vs. public school enrollment:
Students in private schools in grades 1 to 8 (elementary and middle school): 7
Here:
6.9%
Illinois:
13.3%
Students in private schools in grades 9 to 12 (high school):
Here:
0.0%
Illinois:
9.9%
Students in private undergraduate colleges: 2
Here:
5.7%
Illinois:
27.4%
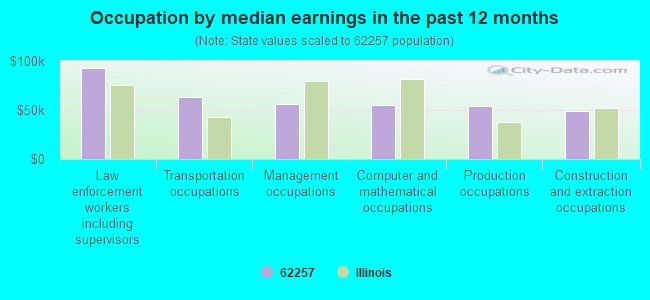
Occupation by median earnings in the past 12 months ($)
92,918Law enforcement workers including supervisors
62,782Transportation occupations
56,155Management occupations
55,572Computer and mathematical occupations
53,581Production occupations
48,596Construction and extraction occupations
Companies with federal contracts located in this zip code:
TERRY L JENKINS (221 W MILL ST in MARISSA, IL; small business) : $53,045 in 6 contractsfrom 2000 to 2005
Contracts for Maintenance, Repair or Alteration of Real Property -- Office Buildings, Maintenance, Repair or Alteration of Real Property -- Highways, Roads, Streets, Bridges, and Railways (includes resurfacing), ADP Facility Operation and Maintenance Services, Maintenance, Repair or Alteration of Real Property -- Recreational Buildings by Department of Defense, Air Force Signed by year:2000: $13,000; 2001: $5,855; 2002: $0; 2003: $0; 2004: $4,590; 2005: $29,600; 2006: $0.
Biggest contracts:
$22,500 with Department of Defense for Maintenance, Repair or Alteration of Real Property -- Office Buildings. Signed on 2005-09-21. Completion date: 2005-09-30.
$13,000 with Air Force for Maintenance, Repair or Alteration of Real Property -- Highways, Roads, Streets, Bridges, and Railways (includes resurfacing). Signed on 2000-07-17. Completion date: 2000-09-19.
$7,100 with Department of Defense for Maintenance, Repair or Alteration of Real Property -- Office Buildings. Signed on 2005-09-22. Completion date: 2005-09-30.
$4,590 with Department of Defense for ADP Facility Operation and Maintenance Services. Signed on 2004-12-08. Completion date: 2005-02-08.
Top industries in this zip code by the number of employees in 2005:
Construction: All Other Specialty Trade Contractors (20-49 employees: 1 establishment)
Construction: Masonry Contractors (10-19: 2)
Accommodation and Food Services: Limited-Service Restaurants (10-19: 1, 1-4: 1)
Construction: Electrical Contractors (10-19: 1)
Administrative and Support and Waste Management and Remediation Services: Solid Waste Landfill (10-19: 1)
Fatal accident statistics in 2014:
Fatal accident count: 2
Vehicles involved in fatal accidents: 2
Fatal accidents caused by drunken drivers: 2
Fatalities: 2
Persons involved in fatal accidents: 4
Pedestrians involved in fatal accidents: 0
Fatal accident statistics in 2013:
Fatal accident count: 1
Vehicles involved in fatal accidents: 3
Fatal accidents caused by drunken drivers: 0
Fatalities: 2
Persons involved in fatal accidents: 7
Pedestrians involved in fatal accidents: 0
Home Mortgage Disclosure Act Aggregated Statistics For Year 2009 (Based on 4 partial tracts)
A) FHA, FSA/RHS & VA Home Purchase Loans
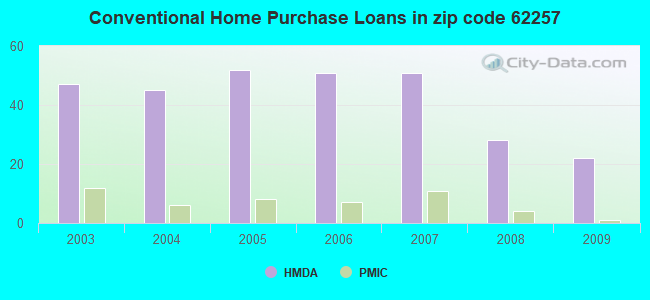
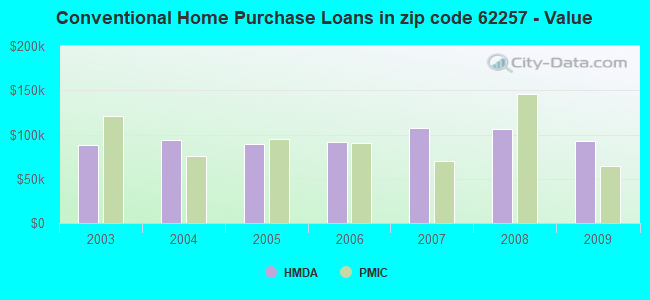
B) Conventional Home Purchase Loans
C) Refinancings
D) Home Improvement Loans
F) Non-occupant Loans on < 5 Family Dwellings (A B C & D)
G) Loans On Manufactured Home Dwelling (A B C & D)
Number
Average Value
Number
Average Value
Number
Average Value
Number
Average Value
Number
Average Value
Number
Average Value
LOANS ORIGINATED
12
$134,065
22
$92,100
98
$134,878
12
$70,364
10
$59,568
8
$55,662
APPLICATIONS APPROVED, NOT ACCEPTED
0
$0
0
$0
8
$152,039
1
$19,810
0
$0
0
$0
APPLICATIONS DENIED
3
$145,497
9
$75,969
19
$150,234
4
$16,505
1
$39,610
5
$48,858
APPLICATIONS WITHDRAWN
1
$139,380
2
$136,085
15
$107,839
1
$35,210
0
$0
1
$49,880
FILES CLOSED FOR INCOMPLETENESS
2
$161,760
1
$82,160
4
$138,282
0
$0
1
$53,550
1
$136,450
Aggregated Statistics For Year 2008 (Based on 4 partial tracts)
A) FHA, FSA/RHS & VA Home Purchase Loans
B) Conventional Home Purchase Loans
C) Refinancings
D) Home Improvement Loans
F) Non-occupant Loans on < 5 Family Dwellings (A B C & D)
G) Loans On Manufactured Home Dwelling (A B C & D)
Number
Average Value
Number
Average Value
Number
Average Value
Number
Average Value
Number
Average Value
Number
Average Value
LOANS ORIGINATED
12
$86,137
28
$105,743
65
$115,108
15
$32,719
7
$71,264
7
$70,321
APPLICATIONS APPROVED, NOT ACCEPTED
1
$30,810
1
$48,420
4
$99,952
2
$13,940
1
$5,870
1
$48,420
APPLICATIONS DENIED
3
$123,733
6
$66,390
15
$110,725
10
$45,777
1
$92,430
4
$54,652
APPLICATIONS WITHDRAWN
1
$95,370
2
$113,340
12
$124,467
2
$58,690
1
$8,070
0
$0
FILES CLOSED FOR INCOMPLETENESS
0
$0
2
$134,250
3
$80,940
1
$18,340
0
$0
0
$0
Aggregated Statistics For Year 2007 (Based on 4 partial tracts)
A) FHA, FSA/RHS & VA Home Purchase Loans
B) Conventional Home Purchase Loans
C) Refinancings
D) Home Improvement Loans
F) Non-occupant Loans on < 5 Family Dwellings (A B C & D)
G) Loans On Manufactured Home Dwelling (A B C & D)
Number
Average Value
Number
Average Value
Number
Average Value
Number
Average Value
Number
Average Value
Number
Average Value
LOANS ORIGINATED
6
$84,242
51
$107,206
69
$98,834
22
$41,182
14
$57,169
12
$63,640
APPLICATIONS APPROVED, NOT ACCEPTED
1
$136,450
10
$68,885
15
$98,156
1
$129,110
4
$43,100
1
$28,610
APPLICATIONS DENIED
3
$48,907
16
$77,441
50
$99,960
11
$74,494
5
$80,256
7
$76,294
APPLICATIONS WITHDRAWN
0
$0
5
$86,712
18
$129,195
2
$93,535
2
$138,650
1
$135,720
FILES CLOSED FOR INCOMPLETENESS
0
$0
1
$22,010
10
$96,102
0
$0
0
$0
0
$0
Aggregated Statistics For Year 2006 (Based on 4 partial tracts)
A) FHA, FSA/RHS & VA Home Purchase Loans
B) Conventional Home Purchase Loans
C) Refinancings
D) Home Improvement Loans
F) Non-occupant Loans on < 5 Family Dwellings (A B C & D)
G) Loans On Manufactured Home Dwelling (A B C & D)
Number
Average Value
Number
Average Value
Number
Average Value
Number
Average Value
Number
Average Value
Number
Average Value
LOANS ORIGINATED
8
$93,168
51
$91,901
78
$97,541
19
$26,796
15
$54,727
13
$37,245
APPLICATIONS APPROVED, NOT ACCEPTED
0
$0
7
$92,539
14
$83,840
1
$7,340
1
$143,790
1
$66,020
APPLICATIONS DENIED
2
$85,100
18
$53,227
57
$92,215
7
$51,037
5
$53,260
9
$49,884
APPLICATIONS WITHDRAWN
2
$56,855
6
$56,487
35
$104,507
4
$89,682
1
$57,220
4
$62,722
FILES CLOSED FOR INCOMPLETENESS
0
$0
1
$13,200
9
$101,644
0
$0
1
$57,950
0
$0
Aggregated Statistics For Year 2005 (Based on 4 partial tracts)
A) FHA, FSA/RHS & VA Home Purchase Loans
B) Conventional Home Purchase Loans
C) Refinancings
D) Home Improvement Loans
E) Loans on Dwellings For 5+ Families
F) Non-occupant Loans on < 5 Family Dwellings (A B C & D)
G) Loans On Manufactured Home Dwelling (A B C & D)
Number
Average Value
Number
Average Value
Number
Average Value
Number
Average Value
Number
Average Value
Number
Average Value
Number
Average Value
LOANS ORIGINATED
5
$113,414
52
$89,654
80
$101,237
22
$54,720
1
$349,930
11
$43,149
15
$55,020
APPLICATIONS APPROVED, NOT ACCEPTED
0
$0
4
$42,550
12
$106,188
1
$5,870
0
$0
0
$0
1
$77,030
APPLICATIONS DENIED
1
$88,770
10
$84,291
46
$90,153
8
$31,086
1
$349,930
2
$50,620
5
$57,220
APPLICATIONS WITHDRAWN
2
$172,030
7
$116,747
29
$129,417
1
$259,690
0
$0
2
$240,990
2
$159,190
FILES CLOSED FOR INCOMPLETENESS
0
$0
1
$73,360
2
$177,165
1
$14,670
0
$0
0
$0
0
$0
Aggregated Statistics For Year 2004 (Based on 4 partial tracts)
A) FHA, FSA/RHS & VA Home Purchase Loans
B) Conventional Home Purchase Loans
C) Refinancings
D) Home Improvement Loans
F) Non-occupant Loans on < 5 Family Dwellings (A B C & D)
G) Loans On Manufactured Home Dwelling (A B C & D)
Number
Average Value
Number
Average Value
Number
Average Value
Number
Average Value
Number
Average Value
Number
Average Value
LOANS ORIGINATED
5
$69,692
45
$93,249
103
$95,332
14
$42,234
9
$111,997
13
$61,115
APPLICATIONS APPROVED, NOT ACCEPTED
0
$0
8
$76,295
18
$69,814
1
$121,040
1
$43,280
3
$56,243
APPLICATIONS DENIED
2
$97,200
18
$58,525
47
$76,591
8
$32,004
3
$57,220
12
$50,618
APPLICATIONS WITHDRAWN
0
$0
4
$64,372
32
$89,774
2
$35,580
0
$0
3
$54,043
FILES CLOSED FOR INCOMPLETENESS
0
$0
0
$0
5
$99,770
0
$0
0
$0
0
$0
Aggregated Statistics For Year 2003 (Based on 4 partial tracts)
A) FHA, FSA/RHS & VA Home Purchase Loans
B) Conventional Home Purchase Loans
C) Refinancings
D) Home Improvement Loans
F) Non-occupant Loans on < 5 Family Dwellings (A B C & D)
Detailed PMIC statistics for the following Tracts:5040.02
2002 - 2018 National Fire Incident Reporting System (NFIRS) incidents
Based on the data from the years 2002 - 2018 the average number of fires per year is 26. The highest number of fires - 53 took place in 2012, and the least - 16 in 2017. The data has a decreasing trend.
When looking into fire subcategories, the most reports belonged to: Structure Fires (50.4%), and Outside Fires (34.2%).
Fire incident types reported to NFIRS in Zip Code 62257


 Nearest zip codes: 62255, 62282, 62292, 62214, 62217, 62286.


 Based on the data from the years 2002 - 2018 the average number of fires per year is 26. The highest number of fires - 53 took place in 2012, and the least - 16 in 2017. The data has a decreasing trend.
 When looking into fire subcategories, the most reports belonged to: Structure Fires (50.4%), and Outside Fires (34.2%).