Estimated zip code population in 2022: 708 Zip code population in 2010: 807 Zip code population in 2000: 4,114
Houses and condos: 396 Renter-occupied apartments: 28
% of renters here:
9%
State:
33%
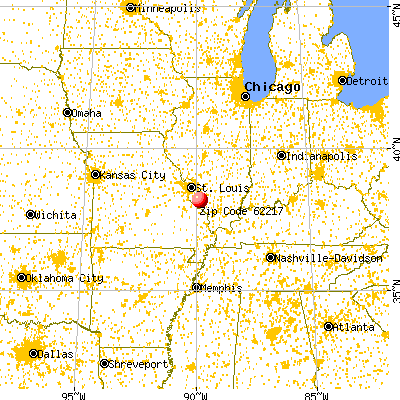
March 2022 cost of living index in zip code 62217: 85.8 (less than average, U.S. average is 100)
Land area: 27.5 sq. mi. Water area: 2.5 sq. mi.
Population density: 26 people per square mile
(very low).
OSM Map
General Map
Google Map
MSN Map
OSM Map
General Map
Google Map
MSN Map
OSM Map
General Map
Google Map
MSN Map
OSM Map
General Map
Google Map
MSN Map
Please wait while loading the map...
Real estate property taxes paid for housing units in 2022:
This zip code:
0.8% ($998)
Illinois:
2.0% ($4,912)
Median real estate property taxes paid for housing units with mortgages in 2022: $1,360 (1.1%) Median real estate property taxes paid for housing units with no mortgage in 2022: $724 (0.6%)
Business Search- 14 Million verified businesses
Males: 385
(54.5%)
Females: 322
(45.5%)
For population 25 years and over in 62217:
High school or higher: 94.9%
Bachelor's degree or higher: 7.3%
Graduate or professional degree: 0.2%
Unemployed: 10.6%
Mean travel time to work (commute): 32.8 minutes
For population 15 years and over in 62217:
Never married: 18.3%
Now married: 58.5%
Separated: 2.3%
Widowed: 7.1%
Divorced: 13.7%
Zip code 62217 compared to state average:
Median household income below state average.
Median house value below state average.
Unemployed percentage above state average.
Black race population percentage significantly below state average.
Hispanic race population percentage significantly below state average.
Median age significantly above state average.
Foreign-born population percentage significantly below state average.
Renting percentage significantly below state average.
Length of stay since moving in significantly above state average.
Number of college students below state average.
Percentage of population with a bachelor's degree or higher significantly below state average.
Estimated median house/condo value in 2022: $121,223
62217:
$121,223
Illinois:
$251,600
According to our research of Illinois and other state lists, there was 1 registered sex offender living in 62217 zip code as of May 30, 2024. The ratio of all residents to sex offenders in zip code 62217 is 617 to 1.
Median resident age:
This zip code:
52.2 years
Illinois median age:
39.1 years
Average household size:
This zip code:
2.2 people
Illinois:
2.4 people
Averages for the 2020 tax year for zip code 62217, filed in 2021:
Average Adjusted Gross Income (AGI) in 2020: $51,411 (Individual Income Tax Returns)
Here:
$51,411
State:
$82,626
Salary/wage: $42,007 (reported on 80.0% of returns)
Here:
$42,007
State:
$66,640
(% of AGI for various income ranges: 1116.7% for AGIs below $25k, 3260.0% for AGIs $25k-50k, 5336.7% for AGIs $50k-75k, 9270.0% for AGIs $75k-100k, 15646.7% for AGIs $100k-200k)
Taxable interest for individuals: $777 (reported on 37.1% of returns)
This zip code:
$777
Illinois:
$2,376
(% of AGI for various income ranges: 7.8% for AGIs below $25k, 30.0% for AGIs $25k-50k, 30.0% for AGIs $50k-75k, 203.3% for AGIs $100k-200k)
Ordinary dividends: $3,367 (reported on 17.1% of returns)
Here:
$3,367
State:
$9,061
(% of AGI for various income ranges: 51.2% for AGIs $25k-50k, 536.7% for AGIs $100k-200k)
Net capital gain/loss in AGI: +$6,720 (reported on 14.3% of returns)
Here:
+$6,720
State:
+$31,684
(% of AGI for various income ranges: 23.8% for AGIs $25k-50k, 1585.0% for AGIs $75k-100k)
Taxable individual retirement arrangement distribution: $14,000 (reported on 11.4% of returns)
62217:
$14,000
Illinois:
$21,613
(% of AGI for various income ranges: 248.9% for AGIs below $25k, 1120.0% for AGIs $50k-75k)
Earned income credit: $2,267 (reported on 17.1% of returns)
Here:
$2,267
State:
$2,311
(% of AGI for various income ranges: 151.1% for AGIs below $25k)
Percentage of individuals using paid preparers for their 2020 taxes: 91.4%
Here:
91%
State:
93%
(% for various income ranges: 91.7% for AGIs below $25k, 90.0% for AGIs $25k-50k, 100.0% for AGIs $50k-75k, 100.0% for AGIs $75k-100k, 83.3% for AGIs $100k-200k)
Averages for the 2012 tax year for zip code 62217, filed in 2013:
Average Adjusted Gross Income (AGI) in 2012: $41,854 (Individual Income Tax Returns)
Here:
$41,854
State:
$68,058
Salary/wage: $35,747 (reported on 81.1% of returns)
Here:
$35,747
State:
$55,396
(% of AGI for various income ranges: 64.3% for AGIs below $25k, 68.3% for AGIs $25k-50k, 75.9% for AGIs $50k-75k, 149.8% for AGIs $75k-100k)
Taxable interest for individuals: $875 (reported on 43.2% of returns)
This zip code:
$875
Illinois:
$1,969
(% of AGI for various income ranges: 1.3% for AGIs below $25k, 2.0% for AGIs $25k-50k, 0.3% for AGIs $50k-75k, 1.2% for AGIs $75k-100k)
Ordinary dividends: $1,988 (reported on 21.6% of returns)
Here:
$1,988
State:
$7,786
Net capital gain/loss in AGI: +$300 (reported on 13.5% of returns)
Here:
+$300
State:
+$22,183
Profit/loss from business: +$4,275 (reported on 10.8% of returns)
Here:
+$4,275
State:
+$12,903
Taxable individual retirement arrangement distribution: $5,800 (reported on 13.5% of returns)
62217:
$5,800
Illinois:
$17,929
Total itemized deductions: $15,017 (20% of AGI, reported on 16.2% of returns)
Here:
$15,017
State:
$26,433
Here:
19.9% of AGI
State:
19.2% of AGI
Charity contributions: $2,167 (reported on 8.1% of returns)
Here:
$2,167
State:
$4,525
Taxes paid: $4,483 (reported on 16.2% of returns)
62217:
$4,483
State:
$11,968
Earned income credit: $2,214 (reported on 18.9% of returns)
Here:
$2,214
State:
$2,349
(% of AGI for various income ranges: 7.7% for AGIs below $25k)
Percentage of individuals using paid preparers for their 2012 taxes: 62.2%
Here:
62%
State:
57%
(% for various income ranges: 56.2% for AGIs below $25k, 55.6% for AGIs $25k-50k, 71.4% for AGIs $50k-75k, 133.3% for AGIs $75k-100k)
Averages for the 2004 tax year for zip code 62217, filed in 2005:
Average Adjusted Gross Income (AGI) in 2004: $33,835 (Individual Income Tax Returns)
Here:
$33,835
State:
$54,625
Salary/wage: $31,594 (reported on 84.4% of returns)
Here:
$31,594
State:
$46,811
(% of AGI for various income ranges: 78.5% for AGIs below $10k, 68.8% for AGIs $10k-25k, 80.8% for AGIs $25k-50k, 82.1% for AGIs $50k-75k, 77.8% for AGIs $75k-100k)
Taxable interest for individuals: $838 (reported on 42.7% of returns)
This zip code:
$838
Illinois:
$2,101
(% of AGI for various income ranges: 5.4% for AGIs below $10k, 2.2% for AGIs $10k-25k, 1.1% for AGIs $25k-50k, 0.4% for AGIs $50k-75k, 0.7% for AGIs $75k-100k)
Taxable dividends: $1,089 (reported on 22.2% of returns)
Here:
$1,089
State:
$4,306
(% of AGI for various income ranges: 1.6% for AGIs below $10k, 1.2% for AGIs $10k-25k, 0.6% for AGIs $25k-50k, 0.7% for AGIs $50k-75k, 0.5% for AGIs $75k-100k)
Net capital gain/loss: +$2,143 (reported on 13.8% of returns)
Here:
+$2,143
State:
+$17,321
(% of AGI for various income ranges: 0.0% for AGIs below $10k, 0.3% for AGIs $10k-25k, 2.5% for AGIs $50k-75k)
Profit/loss from business: +$4,609 (reported on 11.4% of returns)
Here:
+$4,609
State:
+$11,771
Profit/loss from farming: +$824 (reported on 4.2% of returns)
Here:
+$824
State:
+$2,327
Total itemized deductions: $13,471 (21% of AGI, reported on 12.6% of returns)
Here:
$13,471
State:
$20,239
Here:
21.1% of AGI
State:
19.5% of AGI
Charity contributions deductions: $1,686 (3% of AGI, reported on 8.6% of returns)
Here:
$1,686
State:
$3,719
Here:
2.6% of AGI
State:
3.4% of AGI
(% of AGI for various income ranges: 1.5% for AGIs $10k-25k, 0.3% for AGIs $50k-75k, 0.5% for AGIs $75k-100k)
Total tax: $4,078 (reported on 72.3% of returns)
62217:
$4,078
State:
$9,882
(% of AGI for various income ranges: 2.1% for AGIs below $10k, 3.8% for AGIs $10k-25k, 6.9% for AGIs $25k-50k, 8.9% for AGIs $50k-75k, 13.8% for AGIs $75k-100k)
Earned income credit: $1,391 (reported on 17.0% of returns)
Here:
$1,391
State:
$1,788
Percentage of individuals using paid preparers for their 2004 taxes: 74.8%
Here:
75%
State:
61%
(% for various income ranges: 70.8% for AGIs below $10k, 75.5% for AGIs $10k-25k, 73.5% for AGIs $25k-50k, 81.3% for AGIs $50k-75k, 73.5% for AGIs $75k-100k)
Likely homosexual households (counted as self-reported same-sex unmarried-partner households)
Lesbian couples: 0.3% of all households
Gay men: 0.0% of all households
Household received Food Stamps/SNAP in the past 12 months: 65 Household did not receive Food Stamps/SNAP in the past 12 months: 252
Women who had a birth in the past 12 months: 1 (1 now married, 0 unmarried) Women who did not have a birth in the past 12 months: 92 (43 now married, 48 unmarried)
Housing units in zip code 62217 with a mortgage: 87 Median monthly owner costs for units with a mortgage: $1,129 Median monthly owner costs for units without a mortgage: $341
Residents with income below the poverty level in 2022:
This zip code:
13.4%
Whole state:
11.9%
Residents with income below 50% of the poverty level in 2022:
This zip code:
6.4%
Whole state:
5.7%
Median number of rooms in houses and condos:
Here:
5.3
State:
6.4
Median number of rooms in apartments:
Here:
5.2
State:
4.1
Notable locations in this zip code not listed on our city pages
Notable locations in zip code 62217: Baldwin Community Fire Protection District Training Facility (A), Baldwin Community Fire Protection District Main Station (B), Baldwin Energy Complex (C). Display/hide their locations on the map
Size of family households: 150 2-persons, 28 3-persons, 32 4-persons, 4 5-persons, 10 6-persons
Size of nonfamily households: 78 1-person, 10 2-persons
97 married couples with children.
17 single-parent households (6 men, 11 women).
100.5% of residents of 62217 zip code speak English at home.
Foreign born population: 0 (0.0%)
:
0.0%
Whole state:
14.4%
47%German
19%American
10%European
8%French
4%English
1%Irish
Facilities with environmental interests located in this zip code:
ILLINOIS CENTRAL RAILROAD CORP (INT. FIRST STREET & RR TRACKS in BALDWIN, IL)
STATE MASTER (Illinois EPA Project) - National Pollutant Discharge Elimination System Permit National Pollutant Discharge Elimination System NON-MAJOR (Tracking pollutant discharge elimination systems) - permit
KASKASKIA REGIONAL PORT DISTRICT (RIVERVIEW DR in BALDWIN, IL)
STATE MASTER (Illinois EPA Project) - AIR PROGRAM AIR MINOR (AIRS/AFS) CRITERIA AND HAZARDOUS AIR POLLUTANT INVENTORY (Inventory of air pollution sources) Business SIC classification: REGULATION AND ADMINISTRATION OF TRANSPORTATION PROGRAMS Alternative names: KASKASKIA REGIONAL PORT DIST-#2
PEABODY COAL CO (8 MILES NORTH EAST OF BALDWIN in BALDWIN, IL)
AIR MAJOR (AIRS/AFS) CRITERIA AND HAZARDOUS AIR POLLUTANT INVENTORY (Inventory of air pollution sources) Small Quantity Generators, between 100 kg and 1000 kg of hazardous waste/month (Resource Conservation and Recovery Act (tracking hazardous waste)) - notification Business SIC classification: BITUMINOUS COAL UNDERGROUND MINING Alternative names: PEABODY COAL CO-RANDOLPH PREP PLT
RANDOLPH SERVICE CO (THIRD ST in BALDWIN, IL)
(Resource Conservation and Recovery Act (tracking hazardous waste)) Organizations: RANDOLPH SERVICE COMPANY (CONTACT/OWNER)
ROGERS REDI MIX INC.-BALDWIN (RR 1 HIGHWAY 154 in BALDWIN, IL)
National Pollutant Discharge Elimination System NON-MAJOR (Tracking pollutant discharge elimination systems) - permit Organizations: KOESTER?ROGER L? (CONTACT/OWNER)
, KOESTER?ROGER L. (CONTACT/OWNER)
GRANGRIT INC. (5TH STREET NORTH in BALDWIN, IL)
National Pollutant Discharge Elimination System NON-MAJOR (Tracking pollutant discharge elimination systems) - permit
ILDOT BRG 079 0013 (IL RTE 154 OVER KASKASKIA RVR in BALDWIN, IL)
Small Quantity Generators, between 100 kg and 1000 kg of hazardous waste/month (Resource Conservation and Recovery Act (tracking hazardous waste)) - notification Organizations: IL DEPT TRANSPORTATION (CONTACT/OWNER)
Housing units lacking complete plumbing facilities: 3.1% Housing units lacking complete kitchen facilities: 2.7%
30.2%Bottled, tank, or LP gas
26.0%Electricity
24.4%Utility gas
17.2%Wood
2.9%Fuel oil, kerosene, etc.
Population in 1990: 1,093. Population change in the 1990s: +3,021 (+276.4%).
Place of birth for U.S.-born residents:
This state: 568
Midwest: 115
South: 6
West: 16
72% of the 62217 zip code residents lived in the same house 5 years ago. Out of people who lived in different houses, 13% lived in this county. Out of people who lived in different counties, 50% lived in Illinois.
98% of the 62217 zip code residents lived in the same house 1 year ago. Out of people who lived in different houses, 100% moved from this county.
Private vs. public school enrollment:
Students in private schools in grades 1 to 8 (elementary and middle school): 10
Here:
18.4%
Illinois:
13.3%
Students in private schools in grades 9 to 12 (high school): 6
Here:
26.3%
Illinois:
9.9%
Students in private undergraduate colleges: 7
Here:
67.1%
Illinois:
27.4%
Occupation by median earnings in the past 12 months ($)
66,802Construction and extraction occupations
55,150Management occupations
37,912Installation, maintenance, and repair occupations
28,813Production occupations
28,431Material moving occupations
26,918Office and administrative support occupations
Top industries in this zip code by the number of employees in 2005:
Utilities: Fossil Fuel Electric Power Generation (100-249 employees: 1 establishment)
Wholesale Trade: Sporting and Recreational Goods and Supplies Merchant Wholesalers (50-99: 1)
Construction: Other Heavy and Civil Engineering Construction (20-49: 1)
Administrative and Support and Waste Management and Remediation Services: Professional Employer Organizations (20-49: 1)
Wholesale Trade: Farm and Garden Machinery and Equipment Merchant Wholesalers (10-19: 1)
Professional, Scientific, and Technical Services: Offices of Certified Public Accountants (5-9: 1)
Other Services (except Public Administration): Labor Unions and Similar Labor Organizations (1-4: 1)
People in group quarters in 2000:
3,193 people in state prisons
Fatal accident statistics in 2011:
Fatal accident count: 1
Vehicles involved in fatal accidents: 2
Fatal accidents caused by drunken drivers: 0
Fatalities: 1
Persons involved in fatal accidents: 5
Pedestrians involved in fatal accidents: 0
2002 - 2018 National Fire Incident Reporting System (NFIRS) incidents
According to the data from the years 2002 - 2018 the average number of fire incidents per year is 8. The highest number of fire incidents - 19 took place in 2012, and the least - 0 in 2004. The data has a growing trend.
When looking into fire subcategories, the most reports belonged to: Structure Fires (43.9%), and Outside Fires (37.1%).
Fire incident types reported to NFIRS in Zip Code 62217


 Nearest zip codes: 62242, 62297, 62278, 62286, 62264, 62255.


 According to the data from the years 2002 - 2018 the average number of fire incidents per year is 8. The highest number of fire incidents - 19 took place in 2012, and the least - 0 in 2004. The data has a growing trend.
 When looking into fire subcategories, the most reports belonged to: Structure Fires (43.9%), and Outside Fires (37.1%).