Estimated zip code population in 2022: 1,512 Zip code population in 2010: 1,526 Zip code population in 2000: 1,425
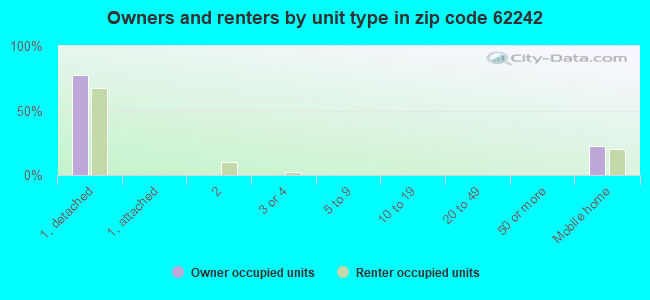
Houses and condos: 823 Renter-occupied apartments: 89
% of renters here:
13%
State:
33%
March 2022 cost of living index in zip code 62242: 83.7 (less than average, U.S. average is 100)
Land area: 55.1 sq. mi. Water area: 1.2 sq. mi.
Population density: 27 people per square mile
(very low).
OSM Map
General Map
Google Map
MSN Map
OSM Map
General Map
Google Map
MSN Map
OSM Map
General Map
Google Map
MSN Map
OSM Map
General Map
Google Map
MSN Map
Please wait while loading the map...
Real estate property taxes paid for housing units in 2022:
This zip code:
1.4% ($1,221)
Illinois:
2.0% ($4,912)
Median real estate property taxes paid for housing units with mortgages in 2022: $1,311 (1.5%) Median real estate property taxes paid for housing units with no mortgage in 2022: $1,198 (1.4%)
Business Search- 14 Million verified businesses
Males: 838
(55.4%)
Females: 674
(44.6%)
For population 25 years and over in 62242:
High school or higher: 89.3%
Bachelor's degree or higher: 14.7%
Graduate or professional degree: 1.6%
Unemployed: 4.7%
Mean travel time to work (commute): 29.9 minutes
For population 15 years and over in 62242:
Never married: 25.6%
Now married: 48.2%
Separated: 1.9%
Widowed: 7.4%
Divorced: 17.0%
Zip code 62242 compared to state average:
Median household income below state average.
Median house value significantly below state average.
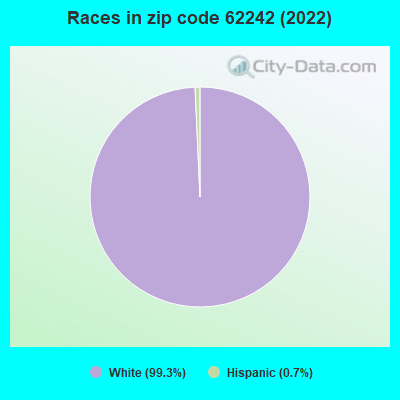
Black race population percentage significantly below state average.
Hispanic race population percentage significantly below state average.
Foreign-born population percentage significantly below state average.
Renting percentage significantly below state average.
Length of stay since moving in significantly above state average.
Number of college students significantly below state average.
Percentage of population with a bachelor's degree or higher significantly below state average.
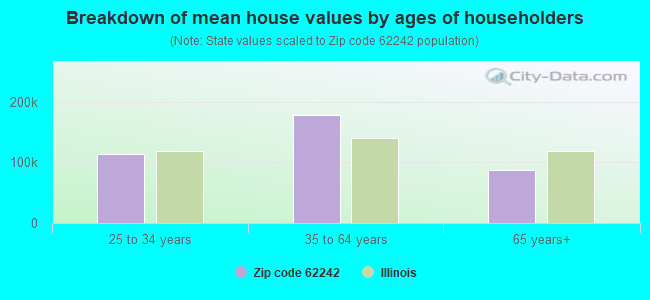
Estimated median house/condo value in 2022: $86,287
62242:
$86,287
Illinois:
$251,600
Median resident age:
This zip code:
40.6 years
Illinois median age:
39.1 years
Average household size:
This zip code:
2.2 people
Illinois:
2.4 people
Averages for the 2020 tax year for zip code 62242, filed in 2021:
Average Adjusted Gross Income (AGI) in 2020: $56,308 (Individual Income Tax Returns)
Here:
$56,308
State:
$82,626
Salary/wage: $48,816 (reported on 78.1% of returns)
Here:
$48,816
State:
$66,640
(% of AGI for various income ranges: 1201.7% for AGIs below $25k, 3240.8% for AGIs $25k-50k, 6146.7% for AGIs $50k-75k, 8615.0% for AGIs $75k-100k, 16831.7% for AGIs $100k-200k)
Taxable interest for individuals: $990 (reported on 46.9% of returns)
This zip code:
$990
Illinois:
$2,376
(% of AGI for various income ranges: 60.8% for AGIs below $25k, 40.8% for AGIs $25k-50k, 30.0% for AGIs $50k-75k, 60.0% for AGIs $75k-100k, 206.7% for AGIs $100k-200k)
Ordinary dividends: $2,669 (reported on 20.3% of returns)
Here:
$2,669
State:
$9,061
(% of AGI for various income ranges: 25.8% for AGIs below $25k, 40.0% for AGIs $25k-50k, 61.1% for AGIs $50k-75k, 355.0% for AGIs $100k-200k)
Net capital gain/loss in AGI: +$3,364 (reported on 21.9% of returns)
Here:
+$3,364
State:
+$31,684
(% of AGI for various income ranges: 17.5% for AGIs below $25k, 19.2% for AGIs $25k-50k, 67.8% for AGIs $50k-75k, 610.0% for AGIs $100k-200k)
Profit/loss from business: +$11,350 (reported on 9.4% of returns)
Here:
+$11,350
State:
+$12,175
(% of AGI for various income ranges: 138.3% for AGIs $25k-50k, 858.3% for AGIs $100k-200k)
Taxable individual retirement arrangement distribution: $12,233 (reported on 14.1% of returns)
62242:
$12,233
Illinois:
$21,613
(% of AGI for various income ranges: 245.8% for AGIs $25k-50k, 380.0% for AGIs $50k-75k, 773.3% for AGIs $100k-200k)
Earned income credit: $2,286 (reported on 10.9% of returns)
Here:
$2,286
State:
$2,311
(% of AGI for various income ranges: 74.2% for AGIs below $25k, 59.2% for AGIs $25k-50k)
Percentage of individuals using paid preparers for their 2020 taxes: 90.6%
Here:
91%
State:
93%
(% for various income ranges: 89.5% for AGIs below $25k, 93.3% for AGIs $25k-50k, 92.3% for AGIs $50k-75k, 83.3% for AGIs $75k-100k, 90.9% for AGIs $100k-200k)
Averages for the 2012 tax year for zip code 62242, filed in 2013:
Average Adjusted Gross Income (AGI) in 2012: $47,125 (Individual Income Tax Returns)
Here:
$47,125
State:
$68,058
Salary/wage: $42,117 (reported on 79.1% of returns)
Here:
$42,117
State:
$55,396
(% of AGI for various income ranges: 59.9% for AGIs below $25k, 75.8% for AGIs $25k-50k, 75.3% for AGIs $50k-75k, 70.9% for AGIs $75k-100k, 66.6% for AGIs $100k-200k)
Taxable interest for individuals: $1,013 (reported on 46.3% of returns)
This zip code:
$1,013
Illinois:
$1,969
(% of AGI for various income ranges: 3.5% for AGIs below $25k, 1.5% for AGIs $25k-50k, 0.5% for AGIs $50k-75k, 0.4% for AGIs $75k-100k, 0.6% for AGIs $100k-200k)
Ordinary dividends: $1,300 (reported on 20.9% of returns)
Here:
$1,300
State:
$7,786
(% of AGI for various income ranges: 1.1% for AGIs below $25k, 1.0% for AGIs $25k-50k, 0.7% for AGIs $50k-75k, 0.4% for AGIs $100k-200k)
Net capital gain/loss in AGI: +$764 (reported on 16.4% of returns)
Here:
+$764
State:
+$22,183
(% of AGI for various income ranges: 0.3% for AGIs $25k-50k, 0.4% for AGIs $50k-75k, 0.5% for AGIs $100k-200k)
Profit/loss from business: +$2,871 (reported on 10.4% of returns)
Here:
+$2,871
State:
+$12,903
Taxable individual retirement arrangement distribution: $7,214 (reported on 10.4% of returns)
62242:
$7,214
Illinois:
$17,929
(% of AGI for various income ranges: 4.7% for AGIs below $25k, 2.4% for AGIs $25k-50k, 2.9% for AGIs $50k-75k)
Total itemized deductions: $15,323 (20% of AGI, reported on 19.4% of returns)
Here:
$15,323
State:
$26,433
Here:
20.0% of AGI
State:
19.2% of AGI
(% of AGI for various income ranges: 4.9% for AGIs $25k-50k, 4.9% for AGIs $50k-75k, 6.6% for AGIs $75k-100k, 10.6% for AGIs $100k-200k)
Charity contributions: $2,533 (reported on 9.0% of returns)
Here:
$2,533
State:
$4,525
(% of AGI for various income ranges: 1.1% for AGIs $75k-100k, 0.9% for AGIs $100k-200k)
Taxes paid: $5,377 (reported on 19.4% of returns)
62242:
$5,377
State:
$11,968
(% of AGI for various income ranges: 1.3% for AGIs $25k-50k, 1.6% for AGIs $50k-75k, 2.5% for AGIs $75k-100k, 4.0% for AGIs $100k-200k)
Earned income credit: $2,111 (reported on 13.4% of returns)
Here:
$2,111
State:
$2,349
(% of AGI for various income ranges: 4.5% for AGIs below $25k, 0.9% for AGIs $25k-50k)
Percentage of individuals using paid preparers for their 2012 taxes: 73.1%
Here:
73%
State:
57%
(% for various income ranges: 66.7% for AGIs below $25k, 70.6% for AGIs $25k-50k, 83.3% for AGIs $50k-75k, 75.0% for AGIs $75k-100k, 83.3% for AGIs $100k-200k)
Averages for the 2004 tax year for zip code 62242, filed in 2005:
Average Adjusted Gross Income (AGI) in 2004: $33,820 (Individual Income Tax Returns)
Here:
$33,820
State:
$54,625
Salary/wage: $32,262 (reported on 81.6% of returns)
Here:
$32,262
State:
$46,811
(% of AGI for various income ranges: 86.9% for AGIs below $10k, 73.5% for AGIs $10k-25k, 76.9% for AGIs $25k-50k, 82.7% for AGIs $50k-75k, 70.4% for AGIs $75k-100k, 76.1% for AGIs over 100k)
Taxable interest for individuals: $1,374 (reported on 56.8% of returns)
This zip code:
$1,374
Illinois:
$2,101
(% of AGI for various income ranges: 10.3% for AGIs below $10k, 3.9% for AGIs $10k-25k, 1.8% for AGIs $25k-50k, 1.5% for AGIs $50k-75k, 3.1% for AGIs $75k-100k, 1.2% for AGIs over 100k)
Taxable dividends: $957 (reported on 23.1% of returns)
Here:
$957
State:
$4,306
(% of AGI for various income ranges: 2.8% for AGIs below $10k, 0.7% for AGIs $10k-25k, 0.7% for AGIs $25k-50k, 0.7% for AGIs $50k-75k, 0.4% for AGIs $75k-100k)
Net capital gain/loss: +$1,844 (reported on 17.3% of returns)
Here:
+$1,844
State:
+$17,321
(% of AGI for various income ranges: -2.0% for AGIs below $10k, 0.8% for AGIs $10k-25k, 0.8% for AGIs $25k-50k, 1.5% for AGIs $50k-75k, 1.2% for AGIs $75k-100k)
Profit/loss from business: +$3,513 (reported on 11.0% of returns)
Here:
+$3,513
State:
+$11,771
(% of AGI for various income ranges: 0.5% for AGIs below $10k, 1.8% for AGIs $10k-25k, 2.9% for AGIs $25k-50k, 0.6% for AGIs $50k-75k, -1.0% for AGIs $75k-100k)
IRA payment deduction: $3,167 (reported on 2.5% of returns)
62242:
$3,167
Illinois:
$3,087
Total itemized deductions: $13,848 (21% of AGI, reported on 11.2% of returns)
Here:
$13,848
State:
$20,239
Here:
21.0% of AGI
State:
19.5% of AGI
(% of AGI for various income ranges: 5.0% for AGIs $25k-50k, 4.6% for AGIs $50k-75k, 5.5% for AGIs $75k-100k, 9.3% for AGIs over 100k)
Charity contributions deductions: $2,732 (4% of AGI, reported on 7.9% of returns)
Here:
$2,732
State:
$3,719
Here:
3.8% of AGI
State:
3.4% of AGI
Total tax: $4,070 (reported on 72.4% of returns)
62242:
$4,070
State:
$9,882
(% of AGI for various income ranges: 2.9% for AGIs below $10k, 3.9% for AGIs $10k-25k, 7.0% for AGIs $25k-50k, 9.2% for AGIs $50k-75k, 11.6% for AGIs $75k-100k, 16.0% for AGIs over 100k)
Earned income credit: $1,519 (reported on 15.0% of returns)
Here:
$1,519
State:
$1,788
Percentage of individuals using paid preparers for their 2004 taxes: 72.1%
Here:
72%
State:
61%
(% for various income ranges: 65.2% for AGIs below $10k, 70.5% for AGIs $10k-25k, 72.3% for AGIs $25k-50k, 75.2% for AGIs $50k-75k, 88.9% for AGIs $75k-100k, 88.9% for AGIs over 100k)
Likely homosexual households (counted as self-reported same-sex unmarried-partner households)
Lesbian couples: 0.0% of all households
Gay men: 1.1% of all households
Household received Food Stamps/SNAP in the past 12 months: 69 Household did not receive Food Stamps/SNAP in the past 12 months: 613
Women who had a birth in the past 12 months: 24 (16 now married, 7 unmarried) Women who did not have a birth in the past 12 months: 238 (112 now married, 125 unmarried)
Housing units in zip code 62242 with a mortgage: 228 (9 second mortgage, 2 both second mortgage and home equity loan) Houses without a mortgage: 3
Median monthly owner costs for units with a mortgage: $838 Median monthly owner costs for units without a mortgage: $433
Residents with income below the poverty level in 2022:
This zip code:
21.1%
Whole state:
11.9%
Residents with income below 50% of the poverty level in 2022:
This zip code:
10.8%
Whole state:
5.7%
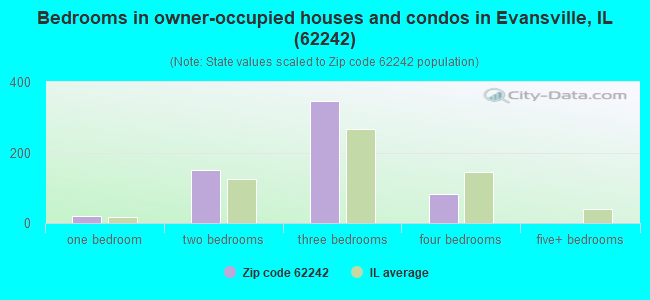
Median number of rooms in houses and condos:
Here:
5.7
State:
6.4
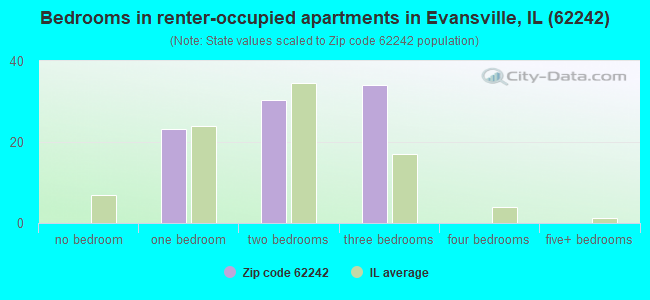
Median number of rooms in apartments:
Here:
4.3
State:
4.1
Notable locations in this zip code not listed on our city pages
Cemeteries: Kelly Cemetery (1), McCormick Cemetery (2), Preston Cemetery (3), Saint Boniface Cemetery (4), Saint John Cemetery (5), Saint Peters Cemetery (6). Display/hide their locations on the map
In group quarters: 23 (-1 institutionalized population)
Size of family households: 234 2-persons, 100 3-persons, 86 4-persons, 12 5-persons, 15 6-persons
Size of nonfamily households: 222 1-person, 15 2-persons, 1 3-persons
222 married couples with children.
159 single-parent households (56 men, 103 women).
99.8% of residents of 62242 zip code speak English at home.
0.1% of residents speak Spanish at home (100% very well).
Foreign born population: 0 (0.0%)
:
0.0%
Whole state:
14.4%
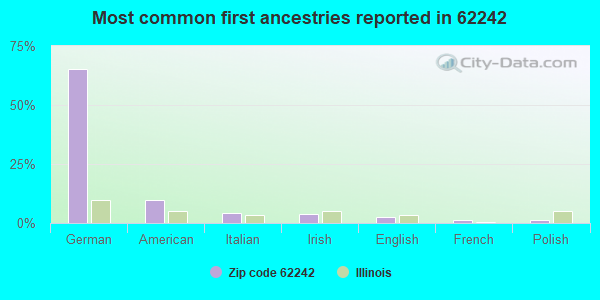
65%German
10%American
4%Italian
4%Irish
3%English
1%French
1%Polish
Facilities with environmental interests located in this zip code:
LONGS AUTO (RR 1 in EVANSVILLE, IL)
STATE MASTER (Illinois EPA Project) - HAZARDOUS WASTE PROGRAM, SCRAP TIRE MANAGEMENT (Resource Conservation and Recovery Act (tracking hazardous waste)) Organizations: LONG ROBERT (CONTACT/OWNER)
ORAS AUTO SERVICE (705 CHESTER ST in EVANSVILLE, IL)
STATE MASTER (Illinois EPA Project) - HAZARDOUS WASTE PROGRAM Small Quantity Generators, between 100 kg and 1000 kg of hazardous waste/month (Resource Conservation and Recovery Act (tracking hazardous waste)) - notification Organizations: ORAS AUTO SVC INC (CONTACT/OWNER)
RANDOLPH SERVICE CO (JACKSON AND MAIN ST in EVANSVILLE, IL)
(Resource Conservation and Recovery Act (tracking hazardous waste)) Organizations: RANDOLPH SERVICE COMPANY (CONTACT/OWNER)
CROP PRODUCTION SERVICES (EVANSVILLE) (8290 ST. LEO'S ROAD in EVANSVILLE, IL)
ENFORCEMENT/COMPLIANCE ACTIVITY (Integrated Compliance Information System)
PRO TEX ALL CO (210 S MORTON AVE in EVANSVILLE, IL)
COMPLIANCE ACTIVITY (Tracking inspections of insecticide, fungicide, and rodenticide, and toxic substances)
Housing units lacking complete plumbing facilities: 3.0% Housing units lacking complete kitchen facilities: 1.0%
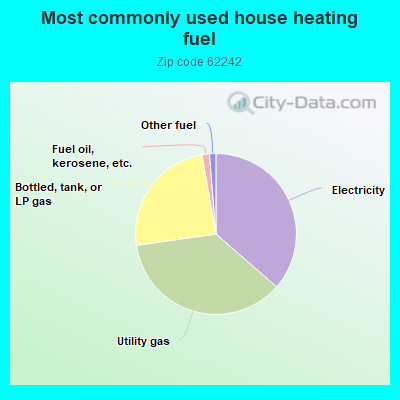
36.5%Electricity
36.4%Utility gas
24.5%Bottled, tank, or LP gas
1.5%Fuel oil, kerosene, etc.
1.3%Other fuel
Population in 1990: 1,540.
Place of birth for U.S.-born residents:
This state: 1,185
Northeast: 6
Midwest: 264
South: 27
West: 25
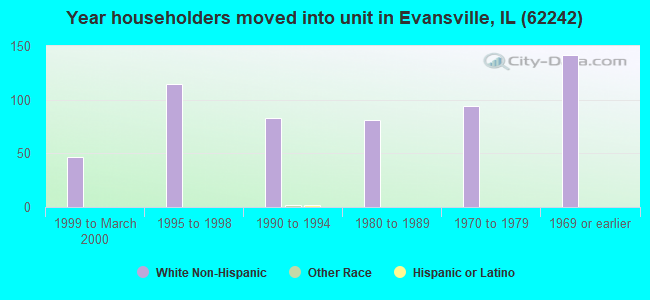
72% of the 62242 zip code residents lived in the same house 5 years ago. Out of people who lived in different houses, 70% lived in this county. Out of people who lived in different counties, 50% lived in Illinois.
96% of the 62242 zip code residents lived in the same house 1 year ago. Out of people who lived in different houses, 93% moved from this county.
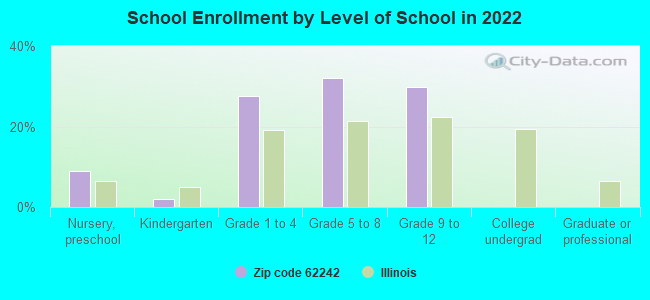
Private vs. public school enrollment:
Students in private schools in grades 1 to 8 (elementary and middle school): 29
Here:
15.4%
Illinois:
13.3%
Students in private schools in grades 9 to 12 (high school): 22
Here:
24.3%
Illinois:
9.9%
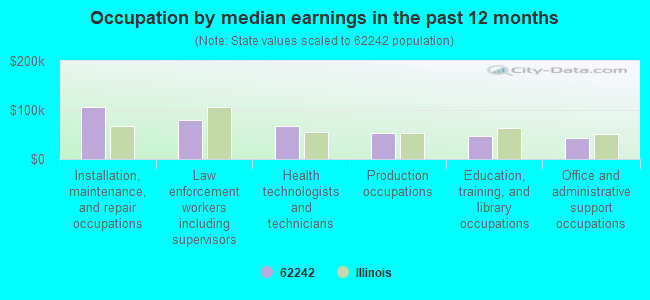
Occupation by median earnings in the past 12 months ($)
106,759Installation, maintenance, and repair occupations
80,559Law enforcement workers including supervisors
67,334Health technologists and technicians
53,248Production occupations
47,753Education, training, and library occupations
42,225Office and administrative support occupations
Top industries in this zip code by the number of employees in 2005:
Administrative and Support and Waste Management and Remediation Services: Janitorial Services (10-19: 1)
Health Care and Social Assistance: Residential Mental Retardation Facilities (10-19: 1)
Accommodation and Food Services: Full-Service Restaurants (10-19: 1)
Other Services (except Public Administration): Religious Organizations (5-9: 1, 1-4: 1)
Health Care and Social Assistance: Offices of Dentists (5-9: 1)
Wholesale Trade: Grain and Field Bean Merchant Wholesalers (5-9: 1)
Accommodation and Food Services: Drinking Places (Alcoholic Beverages) (1-4: 2)
People in group quarters in 2010:
63 people in other noninstitutional facilities
15 people in group homes intended for adults
People in group quarters in 2000:
15 people in homes for the mentally retarded
Fatal accident statistics in 2014:
Fatal accident count: 1
Vehicles involved in fatal accidents: 1
Fatal accidents caused by drunken drivers: 0
Fatalities: 1
Persons involved in fatal accidents: 1
Pedestrians involved in fatal accidents: 0
Fatal accident statistics in 2012:
Fatal accident count: 1
Vehicles involved in fatal accidents: 2
Fatal accidents caused by drunken drivers: 0
Fatalities: 1
Persons involved in fatal accidents: 3
Pedestrians involved in fatal accidents: 0
2005 - 2018 National Fire Incident Reporting System (NFIRS) incidents
Based on the data from the years 2005 - 2018 the average number of fires per year is 9. The highest number of fires - 19 took place in 2014, and the least - 1 in 2011. The data has an increasing trend.
When looking into fire subcategories, the most reports belonged to: Structure Fires (43.3%), and Outside Fires (40.2%).
Fire incident types reported to NFIRS in Zip Code 62242

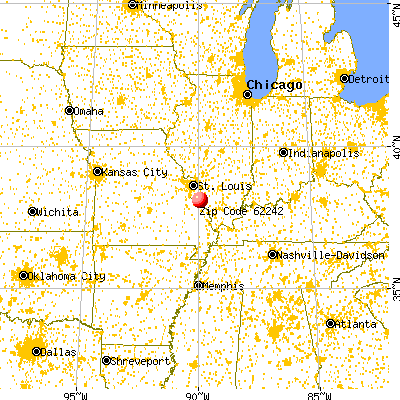


 Nearest zip codes: 62241, 62261, 62278, 62217, 62297, 62277.


 Based on the data from the years 2005 - 2018 the average number of fires per year is 9. The highest number of fires - 19 took place in 2014, and the least - 1 in 2011. The data has an increasing trend.
 When looking into fire subcategories, the most reports belonged to: Structure Fires (43.3%), and Outside Fires (40.2%).