Estimated zip code population in 2022: 4,564 Zip code population in 2010: 4,894 Zip code population in 2000: 5,055
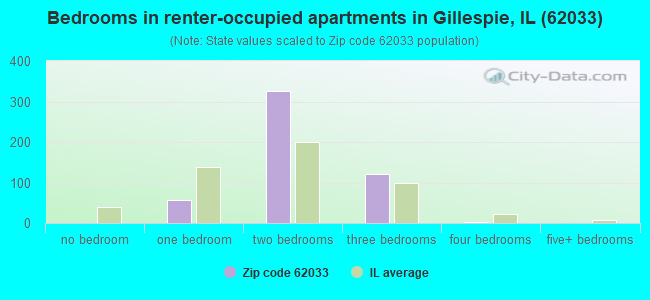
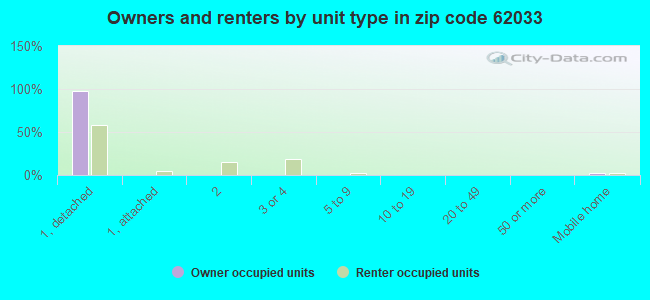
Houses and condos: 2,209 Renter-occupied apartments: 511
% of renters here:
27%
State:
33%
March 2022 cost of living index in zip code 62033: 81.6 (low, U.S. average is 100)
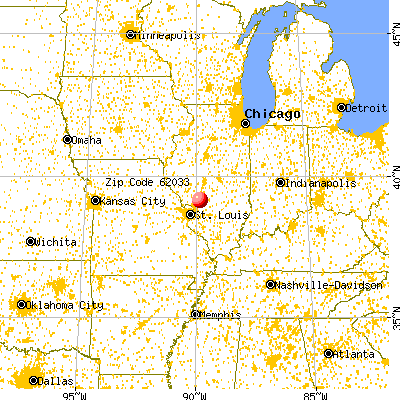
Land area: 49.4 sq. mi. Water area: 0.6 sq. mi.
Population density: 92 people per square mile
(very low).
OSM Map
General Map
Google Map
MSN Map
OSM Map
General Map
Google Map
MSN Map
OSM Map
General Map
Google Map
MSN Map
OSM Map
General Map
Google Map
MSN Map
Please wait while loading the map...
Real estate property taxes paid for housing units in 2022:
This zip code:
1.3% ($1,435)
Illinois:
2.0% ($4,912)
Median real estate property taxes paid for housing units with mortgages in 2022: $1,417 (1.3%) Median real estate property taxes paid for housing units with no mortgage in 2022: $1,461 (1.3%)
Averages for the 2020 tax year for zip code 62033, filed in 2021:
Average Adjusted Gross Income (AGI) in 2020: $54,806 (Individual Income Tax Returns)
Here:
$54,806
State:
$82,626
Salary/wage: $47,971 (reported on 80.3% of returns)
Here:
$47,971
State:
$66,640
(% of AGI for various income ranges: 1066.1% for AGIs below $25k, 3281.0% for AGIs $25k-50k, 6246.8% for AGIs $50k-75k, 8934.7% for AGIs $75k-100k, 14489.5% for AGIs $100k-200k)
Taxable interest for individuals: $1,418 (reported on 31.5% of returns)
This zip code:
$1,418
Illinois:
$2,376
(% of AGI for various income ranges: 24.6% for AGIs below $25k, 26.6% for AGIs $25k-50k, 21.6% for AGIs $50k-75k, 112.4% for AGIs $75k-100k, 243.7% for AGIs $100k-200k)
Ordinary dividends: $4,032 (reported on 18.8% of returns)
Here:
$4,032
State:
$9,061
(% of AGI for various income ranges: 33.9% for AGIs below $25k, 45.6% for AGIs $25k-50k, 60.8% for AGIs $50k-75k, 136.5% for AGIs $75k-100k, 452.1% for AGIs $100k-200k)
Net capital gain/loss in AGI: +$4,118 (reported on 13.1% of returns)
Here:
+$4,118
State:
+$31,684
(% of AGI for various income ranges: 1.3% for AGIs below $25k, 14.6% for AGIs $25k-50k, 34.0% for AGIs $50k-75k, 96.5% for AGIs $75k-100k, 440.5% for AGIs $100k-200k)
Profit/loss from business: +$8,676 (reported on 9.9% of returns)
Here:
+$8,676
State:
+$12,175
(% of AGI for various income ranges: 75.7% for AGIs below $25k, 70.5% for AGIs $25k-50k, 85.6% for AGIs $50k-75k, 65.3% for AGIs $75k-100k, 420.5% for AGIs $100k-200k)
Taxable individual retirement arrangement distribution: $15,691 (reported on 10.3% of returns)
62033:
$15,691
Illinois:
$21,613
(% of AGI for various income ranges: 67.0% for AGIs below $25k, 78.0% for AGIs $25k-50k, 144.8% for AGIs $50k-75k, 375.9% for AGIs $75k-100k, 931.1% for AGIs $100k-200k)
Total itemized deductions: $34,025 (reported on 1.9% of returns)
Here:
$34,025
State:
$34,948
(% of AGI for various income ranges: 800.6% for AGIs $75k-100k)
Charity contributions: $6,400 (reported on 0.9% of returns)
Here:
$6,400
State:
$13,122
(% of AGI for various income ranges: 31.2% for AGIs $25k-50k)
Taxes paid: $6,200 (reported on 1.9% of returns)
62033:
$6,200
State:
$8,563
(% of AGI for various income ranges: 145.9% for AGIs $75k-100k)
Earned income credit: $2,279 (reported on 16.0% of returns)
Here:
$2,279
State:
$2,311
(% of AGI for various income ranges: 90.4% for AGIs below $25k, 70.0% for AGIs $25k-50k)
Percentage of individuals using paid preparers for their 2020 taxes: 95.3%
Here:
95%
State:
93%
(% for various income ranges: 95.9% for AGIs below $25k, 95.9% for AGIs $25k-50k, 93.8% for AGIs $50k-75k, 92.0% for AGIs $75k-100k, 96.8% for AGIs $100k-200k, 100.0% for AGIs over 200k)
Averages for the 2012 tax year for zip code 62033, filed in 2013:
Average Adjusted Gross Income (AGI) in 2012: $46,080 (Individual Income Tax Returns)
Here:
$46,080
State:
$68,058
Salary/wage: $39,475 (reported on 82.9% of returns)
Here:
$39,475
State:
$55,396
(% of AGI for various income ranges: 66.6% for AGIs below $25k, 73.7% for AGIs $25k-50k, 77.0% for AGIs $50k-75k, 73.5% for AGIs $75k-100k, 64.9% for AGIs $100k-200k)
Taxable interest for individuals: $1,414 (reported on 34.6% of returns)
This zip code:
$1,414
Illinois:
$1,969
(% of AGI for various income ranges: 1.7% for AGIs below $25k, 1.0% for AGIs $25k-50k, 0.5% for AGIs $50k-75k, 1.1% for AGIs $75k-100k, 1.3% for AGIs $100k-200k)
Ordinary dividends: $2,639 (reported on 21.5% of returns)
Here:
$2,639
State:
$7,786
(% of AGI for various income ranges: 1.9% for AGIs below $25k, 1.4% for AGIs $25k-50k, 0.7% for AGIs $50k-75k, 1.7% for AGIs $75k-100k, 0.9% for AGIs $100k-200k)
Net capital gain/loss in AGI: +$2,627 (reported on 12.7% of returns)
Here:
+$2,627
State:
+$22,183
(% of AGI for various income ranges: 0.1% for AGIs below $25k, 2.5% for AGIs $100k-200k)
Profit/loss from business: +$6,770 (reported on 11.2% of returns)
Here:
+$6,770
State:
+$12,903
(% of AGI for various income ranges: 5.2% for AGIs below $25k, 1.8% for AGIs $25k-50k, 1.1% for AGIs $50k-75k, 1.4% for AGIs $75k-100k, 0.8% for AGIs $100k-200k)
Taxable individual retirement arrangement distribution: $10,022 (reported on 11.2% of returns)
62033:
$10,022
Illinois:
$17,929
(% of AGI for various income ranges: 2.6% for AGIs below $25k, 3.1% for AGIs $25k-50k, 2.4% for AGIs $50k-75k, 1.7% for AGIs $75k-100k, 2.5% for AGIs $100k-200k)
Total itemized deductions: $16,862 (19% of AGI, reported on 16.6% of returns)
Here:
$16,862
State:
$26,433
Here:
19.1% of AGI
State:
19.2% of AGI
(% of AGI for various income ranges: 3.7% for AGIs below $25k, 4.6% for AGIs $25k-50k, 5.8% for AGIs $50k-75k, 5.8% for AGIs $75k-100k, 8.3% for AGIs $100k-200k)
Charity contributions: $2,565 (reported on 9.8% of returns)
Here:
$2,565
State:
$4,525
(% of AGI for various income ranges: 0.4% for AGIs $25k-50k, 0.4% for AGIs $50k-75k, 0.6% for AGIs $75k-100k, 0.9% for AGIs $100k-200k)
Taxes paid: $6,032 (reported on 16.6% of returns)
62033:
$6,032
State:
$11,968
(% of AGI for various income ranges: 0.5% for AGIs below $25k, 1.0% for AGIs $25k-50k, 1.8% for AGIs $50k-75k, 2.1% for AGIs $75k-100k, 3.9% for AGIs $100k-200k)
Earned income credit: $2,174 (reported on 20.5% of returns)
Here:
$2,174
State:
$2,349
(% of AGI for various income ranges: 7.2% for AGIs below $25k, 1.1% for AGIs $25k-50k)
Percentage of individuals using paid preparers for their 2012 taxes: 59.0%
Here:
59%
State:
57%
(% for various income ranges: 51.9% for AGIs below $25k, 61.5% for AGIs $25k-50k, 62.5% for AGIs $50k-75k, 61.9% for AGIs $75k-100k, 73.7% for AGIs $100k-200k)
Averages for the 2004 tax year for zip code 62033, filed in 2005:
Average Adjusted Gross Income (AGI) in 2004: $35,297 (Individual Income Tax Returns)
Here:
$35,297
State:
$54,625
Salary/wage: $31,912 (reported on 83.1% of returns)
Here:
$31,912
State:
$46,811
(% of AGI for various income ranges: 91.4% for AGIs below $10k, 66.6% for AGIs $10k-25k, 78.2% for AGIs $25k-50k, 79.2% for AGIs $50k-75k, 76.4% for AGIs $75k-100k, 65.1% for AGIs over 100k)
Taxable interest for individuals: $2,119 (reported on 41.8% of returns)
This zip code:
$2,119
Illinois:
$2,101
(% of AGI for various income ranges: 9.2% for AGIs below $10k, 4.3% for AGIs $10k-25k, 2.0% for AGIs $25k-50k, 1.8% for AGIs $50k-75k, 2.8% for AGIs $75k-100k, 1.9% for AGIs over 100k)
Taxable dividends: $1,765 (reported on 26.8% of returns)
Here:
$1,765
State:
$4,306
(% of AGI for various income ranges: 2.6% for AGIs below $10k, 2.3% for AGIs $10k-25k, 1.3% for AGIs $25k-50k, 1.0% for AGIs $50k-75k, 0.8% for AGIs $75k-100k, 1.6% for AGIs over 100k)
Net capital gain/loss: +$2,089 (reported on 16.6% of returns)
Here:
+$2,089
State:
+$17,321
(% of AGI for various income ranges: -0.3% for AGIs below $10k, 0.3% for AGIs $10k-25k, 0.5% for AGIs $25k-50k, 0.9% for AGIs $50k-75k, 0.9% for AGIs $75k-100k, 2.8% for AGIs over 100k)
Profit/loss from business: +$6,094 (reported on 12.0% of returns)
Here:
+$6,094
State:
+$11,771
(% of AGI for various income ranges: 3.7% for AGIs below $10k, 4.4% for AGIs $10k-25k, 2.7% for AGIs $25k-50k, 1.9% for AGIs $50k-75k, 0.4% for AGIs $75k-100k, 0.9% for AGIs over 100k)
Profit/loss from farming: +$7,333 (reported on 2.3% of returns)
Here:
+$7,333
State:
+$2,327
(% of AGI for various income ranges: 0.5% for AGIs below $10k, 0.7% for AGIs $10k-25k, 0.8% for AGIs $50k-75k, 1.0% for AGIs $75k-100k)
IRA payment deduction: $2,774 (reported on 2.4% of returns)
62033:
$2,774
Illinois:
$3,087
(% of AGI for various income ranges: 0.4% for AGIs $10k-25k, 0.1% for AGIs $25k-50k, 0.2% for AGIs $50k-75k, 0.3% for AGIs over 100k)
Total itemized deductions: $15,126 (23% of AGI, reported on 13.2% of returns)
Here:
$15,126
State:
$20,239
Here:
23.3% of AGI
State:
19.5% of AGI
(% of AGI for various income ranges: 6.4% for AGIs $10k-25k, 5.5% for AGIs $25k-50k, 4.5% for AGIs $50k-75k, 6.1% for AGIs $75k-100k, 7.9% for AGIs over 100k)
Charity contributions deductions: $2,124 (3% of AGI, reported on 9.4% of returns)
Here:
$2,124
State:
$3,719
Here:
3.0% of AGI
State:
3.4% of AGI
(% of AGI for various income ranges: 0.4% for AGIs $10k-25k, 0.5% for AGIs $25k-50k, 0.5% for AGIs $50k-75k, 0.7% for AGIs $75k-100k, 1.0% for AGIs over 100k)
Total tax: $4,469 (reported on 73.9% of returns)
62033:
$4,469
State:
$9,882
(% of AGI for various income ranges: 2.1% for AGIs below $10k, 4.0% for AGIs $10k-25k, 7.0% for AGIs $25k-50k, 9.1% for AGIs $50k-75k, 11.5% for AGIs $75k-100k, 17.1% for AGIs over 100k)
Earned income credit: $1,572 (reported on 15.9% of returns)
Here:
$1,572
State:
$1,788
Percentage of individuals using paid preparers for their 2004 taxes: 60.5%
Here:
60%
State:
61%
(% for various income ranges: 50.2% for AGIs below $10k, 62.4% for AGIs $10k-25k, 60.2% for AGIs $25k-50k, 69.0% for AGIs $50k-75k, 63.5% for AGIs $75k-100k, 70.9% for AGIs over 100k)
Household received Food Stamps/SNAP in the past 12 months: 272 Household did not receive Food Stamps/SNAP in the past 12 months: 1,631
Women who had a birth in the past 12 months: 56 (30 now married, 26 unmarried) Women who did not have a birth in the past 12 months: 770 (347 now married, 421 unmarried)
Housing units in zip code 62033 with a mortgage: 777 (19 second mortgage, 19 both second mortgage and home equity loan) Median monthly owner costs for units with a mortgage: $916 Median monthly owner costs for units without a mortgage: $453
Residents with income below the poverty level in 2022:
This zip code:
14.3%
Whole state:
11.9%
Residents with income below 50% of the poverty level in 2022:
This zip code:
4.9%
Whole state:
5.7%
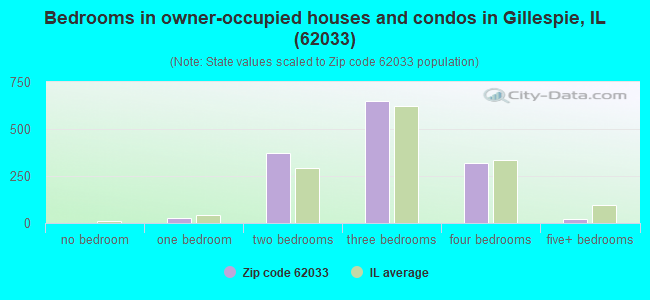
Median number of rooms in houses and condos:
Here:
6.2
State:
6.4
Median number of rooms in apartments:
Here:
4.3
State:
4.1
Notable locations in this zip code not listed on our city pages
Notable locations in zip code 62033: Gillespie Country Club (A), Hickory Grove Pork Farm (B), Bolomey Pork Farm (C), Gillespie City Hall (D), Gillespie - Benld Area Ambulance Service (E), Unit 7 Fire Protection District Station 4 (F), Gillespie Volunteer Fire Department (G). Display/hide their locations on the map
In group quarters: 73 (-1 institutionalized population)
Size of family households: 625 2-persons, 244 3-persons, 226 4-persons, 63 5-persons, 41 6-persons, 2 7-or-more-persons
Size of nonfamily households: 627 1-person, 73 2-persons
525 married couples with children.
413 single-parent households (46 men, 367 women).
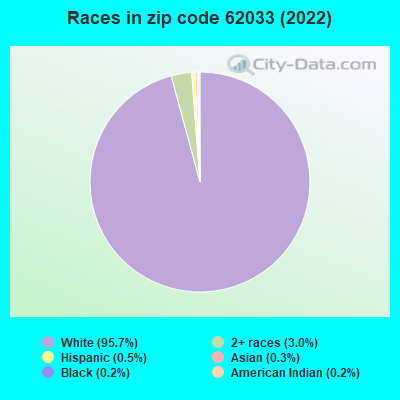
99.2% of residents of 62033 zip code speak English at home.
0.4% of residents speak Asian or Pacific Island language at home (100% very well).
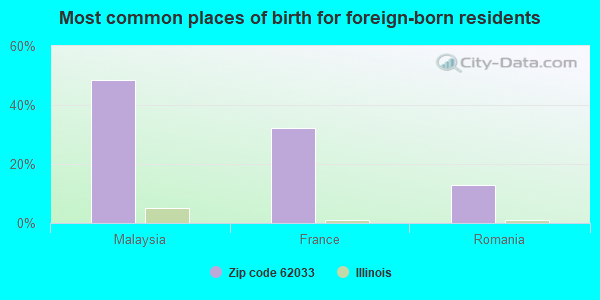
Foreign born population: 30 (0.7%) (0.0% of them are naturalized citizens)
:
0.7%
Whole state:
14.4%
48%Malaysia
32%France
13%Romania
42%German
17%American
9%Irish
8%Italian
5%Scottish
5%English
2%Lithuanian
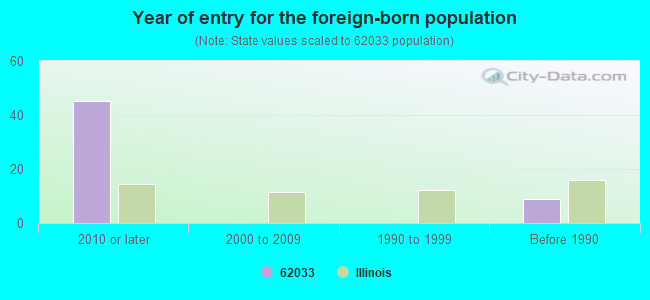
Year of entry for the foreign-born population
452010 or later
02000 to 2009
01990 to 1999
9Before 1990
Major facilities with environmental interests located in this zip code:
MOUNT CLARE (410 BERRY STREET in MOUNT CLARE, IL)
STATE MASTER (Illinois EPA Project) - DRINKING WATER PROGRAM STATE MASTER (Illinois EPA Project) - National Pollutant Discharge Elimination System Permit National Pollutant Discharge Elimination System NON-MAJOR (Tracking pollutant discharge elimination systems) - permit Business SIC classification: SEWERAGE SYSTEMS Alternative names: MOUNT CLARE STP, VIALLAGE OF, MOUNT CLARE STP, VILLAGE OF, MT. CLARE STP, MT. CLARE STP, VILLAGE OF
CURRY READY MIX (100 JERSEY STREET in GILLESPIE, IL)
STATE MASTER (Illinois EPA Project) - AIR PROGRAM, National Pollutant Discharge Elimination System Permit AIR MINOR (AIRS/AFS) CRITERIA AND HAZARDOUS AIR POLLUTANT INVENTORY (Inventory of air pollution sources) National Pollutant Discharge Elimination System NON-MAJOR (Tracking pollutant discharge elimination systems) - permit Business SIC classification: READY-MIXED CONCRETE Business NAICS classification: READY-MIX CONCRETE MANUFACTURING. Organizations: CURRY READY MIX, INC. (CONTACT/OWNER)
LITCHFIELD BITUMINOUS CORP (1 MI. E. OF GILLESPIE ON IL in GILLESPIE, IL)
STATE MASTER (Illinois EPA Project) - National Pollutant Discharge Elimination System Permit National Pollutant Discharge Elimination System NON-MAJOR (Tracking pollutant discharge elimination systems) - permit Organizations: LITCHFIELD BITUMINOUS CORP. (CONTACT/OWNER)
Alternative names: LITCHFIELD BITUMINOUS CORPORAT
LITCHFIELD BITUMINOUS CORP (SEE COMMENTS in GILLESPIE, IL)
STATE MASTER (Illinois EPA Project) - National Pollutant Discharge Elimination System Permit National Pollutant Discharge Elimination System NON-MAJOR (Tracking pollutant discharge elimination systems) - permit Organizations: LITCHFIELD BITUMINOUS CORP. (CONTACT/OWNER)
Alternative names: LITCHFIELD BITUMINOUS CORPORAT
LITCHFIELD BITUMINOUS (2300 ROUTE 16 in GILLESPIE, IL)
STATE MASTER (Illinois EPA Project) - SOLID WASTE PROGRAM, AIR PROGRAM AIR MINOR (AIRS/AFS) CRITERIA AND HAZARDOUS AIR POLLUTANT INVENTORY (Inventory of air pollution sources) Business SIC classification: HIGHWAY AND STREET CONSTRUCTION, EXCEPT ELEVATED HIGHWAYS; WATER, SEWER, PIPELINE, AND COMMUNICATIONS AND POWER LINE CONSTRUCTION Business NAICS classification: HIGHWAY, STREET, AND BRIDGE CONSTRUCTION.
ILLINOIS POWER CO - GILLESPIE (50 DORSEY ROAD in MOUNT CLARE, IL)
STATE MASTER (Illinois EPA Project) - AIR PROGRAM AIR MINOR (AIRS/AFS) Business SIC classification: ELECTRIC AND OTHER SERVICES COMBINED Alternative names: ILLINOIS POWER COMPANY
DALEY CHEV CO (208 N MACOUPIN in GILLESPIE, IL)
STATE MASTER (Illinois EPA Project) - SOLID WASTE PROGRAM, HAZARDOUS WASTE PROGRAM Small Quantity Generators, between 100 kg and 1000 kg of hazardous waste/month (Resource Conservation and Recovery Act (tracking hazardous waste)) Organizations: DALEY HARRY (CONTACT/OWNER)
QUALITY MOTORS (1301 STAUNTON RD in GILLESPIE, IL)
STATE MASTER (Illinois EPA Project) - SOLID WASTE PROGRAM, SCRAP TIRE MANAGEMENT Conditionally Exempt Small Quantity Generators, less than 100 kg/month of hazardous waste (Resource Conservation and Recovery Act (tracking hazardous waste))
AT AND T LONG LINES GILLESPIE (NW CORNER OF BROADWAY&HALPIN in GILLESPIE, IL)
(Resource Conservation and Recovery Act (tracking hazardous waste)) Organizations: AMERICAN TELEPHONE AND TELEGRAPH (CONTACT/OWNER)
IL POWER CO GAS STORAGE FIELD (CLARK AND MACOUPIN ST in GILLESPIE, IL)
(Resource Conservation and Recovery Act (tracking hazardous waste)) Organizations: ILLINOIS POWER CO (CONTACT/OWNER)
RANGER & SONS?BILL (312 E. MAPLE - 1 MI. N. OF in GILLESPIE, IL)
National Pollutant Discharge Elimination System NON-MAJOR (Tracking pollutant discharge elimination systems) - permit Alternative names: RANGER, BILL & SONS
ILL TRUCK & TRAILER (RURAL ROUTE in DORCHESTER, IL)
AIR MINOR (AIRS/AFS) Business SIC classification: NONCLASSIFIABLE ESTABLISHMENTS
M & M SERVICE COMPANY (HGWY RT 4 in MOUNT CLARE, IL)
AIR MINOR (AIRS/AFS) Business SIC classification: PETROLEUM BULK STATIONS AND TERMINALS
Housing units lacking complete plumbing facilities: 3.2% Housing units lacking complete kitchen facilities: 2.5%
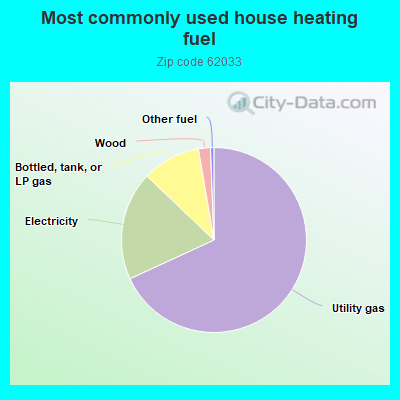
68.2%Utility gas
19.0%Electricity
10.2%Bottled, tank, or LP gas
2.1%Wood
0.6%Other fuel
Population in 1990: 6,518.
Place of birth for U.S.-born residents:
This state: 3,917
Northeast: 71
Midwest: 273
South: 161
West: 71
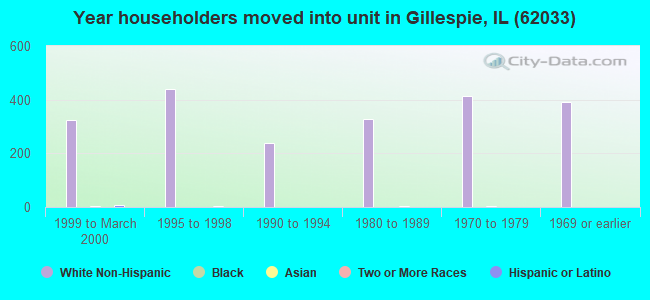
63% of the 62033 zip code residents lived in the same house 5 years ago. Out of people who lived in different houses, 66% lived in this county. Out of people who lived in different counties, 50% lived in Illinois.
93% of the 62033 zip code residents lived in the same house 1 year ago. Out of people who lived in different houses, 48% moved from this county. Out of people who lived in different houses, 43% moved from different county within same state. Out of people who lived in different houses, 10% moved from different state.
Private vs. public school enrollment:
Students in private schools in grades 1 to 8 (elementary and middle school):
Here:
0.0%
Illinois:
13.3%
Students in private schools in grades 9 to 12 (high school): 1
Here:
1.4%
Illinois:
9.9%
Students in private undergraduate colleges: 4
Here:
5.0%
Illinois:
27.4%
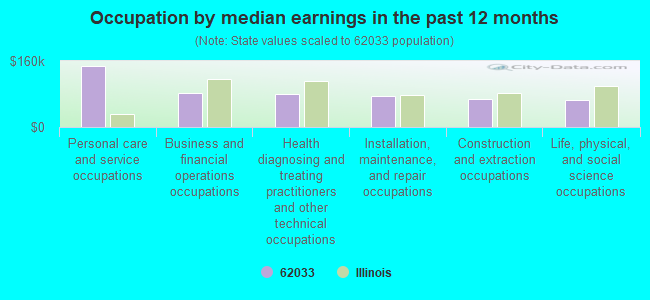
Occupation by median earnings in the past 12 months ($)
147,743Personal care and service occupations
82,603Business and financial operations occupations
80,626Health diagnosing and treating practitioners and other technical occupations
74,073Installation, maintenance, and repair occupations
66,831Construction and extraction occupations
65,236Life, physical, and social science occupations
Top industries in this zip code by the number of employees in 2005:
Health Care and Social Assistance: Nursing Care Facilities (100-249 employees: 1 establishment)
Health Care and Social Assistance: Services for the Elderly and Persons with Disabilities (50-99: 2)
Wholesale Trade: Metal Service Centers and Other Metal Merchant Wholesalers (50-99: 1)
Accommodation and Food Services: Limited-Service Restaurants (20-49: 1, 1-4: 2)
Management of Companies and Enterprises: Corporate, Subsidiary, and Regional Managing Offices (20-49: 1)
2002 - 2018 National Fire Incident Reporting System (NFIRS) incidents
Based on the data from the years 2002 - 2018 the average number of fires per year is 26. The highest number of reported fire incidents - 44 took place in 2009, and the least - 12 in 2004. The data has a constant trend.
When looking into fire subcategories, the most incidents belonged to: Outside Fires (46.8%), and Structure Fires (31.1%).
Fire incident types reported to NFIRS in Zip Code 62033


 Nearest zip codes: 62023, 62009, 62085, 62093, 62069, 62088.


 Based on the data from the years 2002 - 2018 the average number of fires per year is 26. The highest number of reported fire incidents - 44 took place in 2009, and the least - 12 in 2004. The data has a constant trend.
 When looking into fire subcategories, the most incidents belonged to: Outside Fires (46.8%), and Structure Fires (31.1%).