Estimated zip code population in 2022: 1,014 Zip code population in 2010: 1,068 Zip code population in 2000: 1,069
Houses and condos: 470 Renter-occupied apartments: 93
% of renters here:
21%
State:
33%
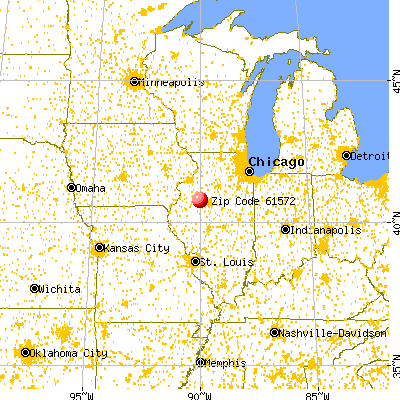
March 2022 cost of living index in zip code 61572: 73.9 (low, U.S. average is 100)
Land area: 35.6 sq. mi. Water area: 0.1 sq. mi.
Population density: 28 people per square mile
(very low).
OSM Map
General Map
Google Map
MSN Map
OSM Map
General Map
Google Map
MSN Map
OSM Map
General Map
Google Map
MSN Map
OSM Map
General Map
Google Map
MSN Map
Please wait while loading the map...
Real estate property taxes paid for housing units in 2022:
This zip code:
1.9% ($1,888)
Illinois:
2.0% ($4,912)
Median real estate property taxes paid for housing units with mortgages in 2022: $1,722 (1.7%) Median real estate property taxes paid for housing units with no mortgage in 2022: $2,187 (2.7%)
Business Search- 14 Million verified businesses
Males: 521
(51.4%)
Females: 492
(48.6%)
For population 25 years and over in 61572:
High school or higher: 93.8%
Bachelor's degree or higher: 15.8%
Graduate or professional degree: 2.6%
Unemployed: 0.6%
Mean travel time to work (commute): 28.0 minutes
For population 15 years and over in 61572:
Never married: 27.5%
Now married: 50.4%
Separated: 0.6%
Widowed: 9.7%
Divorced: 11.8%
Zip code 61572 compared to state average:
Median house value significantly below state average.
Unemployed percentage significantly below state average.
Black race population percentage significantly below state average.
Hispanic race population percentage significantly below state average.
Median age above state average.
Foreign-born population percentage significantly below state average.
Renting percentage below state average.
Length of stay since moving in significantly above state average.
Percentage of population with a bachelor's degree or higher below state average.
Averages for the 2020 tax year for zip code 61572, filed in 2021:
Average Adjusted Gross Income (AGI) in 2020: $53,549 (Individual Income Tax Returns)
Here:
$53,549
State:
$82,626
Salary/wage: $44,421 (reported on 79.6% of returns)
Here:
$44,421
State:
$66,640
(% of AGI for various income ranges: 1181.8% for AGIs below $25k, 3428.9% for AGIs $25k-50k, 5761.7% for AGIs $50k-75k, 7664.0% for AGIs $75k-100k, 18830.0% for AGIs $100k-200k)
Taxable interest for individuals: $750 (reported on 49.0% of returns)
This zip code:
$750
Illinois:
$2,376
(% of AGI for various income ranges: 20.9% for AGIs below $25k, 17.8% for AGIs $25k-50k, 45.0% for AGIs $50k-75k, 60.0% for AGIs $75k-100k, 280.0% for AGIs $100k-200k)
Ordinary dividends: $1,614 (reported on 14.3% of returns)
Here:
$1,614
State:
$9,061
(% of AGI for various income ranges: 34.5% for AGIs below $25k, 80.0% for AGIs $50k-75k, 90.0% for AGIs $100k-200k)
Net capital gain/loss in AGI: +$433 (reported on 12.2% of returns)
Here:
+$433
State:
+$31,684
(% of AGI for various income ranges: 116.7% for AGIs $100k-200k)
Profit/loss from business: +$7,460 (reported on 10.2% of returns)
Here:
+$7,460
State:
+$12,175
(% of AGI for various income ranges: 56.4% for AGIs below $25k, 518.3% for AGIs $50k-75k)
Taxable individual retirement arrangement distribution: $8,980 (reported on 10.2% of returns)
61572:
$8,980
Illinois:
$21,613
(% of AGI for various income ranges: 212.7% for AGIs below $25k, 430.0% for AGIs $75k-100k)
Earned income credit: $2,150 (reported on 12.2% of returns)
Here:
$2,150
State:
$2,311
(% of AGI for various income ranges: 68.2% for AGIs below $25k, 60.0% for AGIs $25k-50k)
Percentage of individuals using paid preparers for their 2020 taxes: 98.0%
Here:
98%
State:
93%
(% for various income ranges: 93.8% for AGIs below $25k, 100.0% for AGIs $25k-50k, 100.0% for AGIs $50k-75k, 100.0% for AGIs $75k-100k, 100.0% for AGIs $100k-200k)
Averages for the 2012 tax year for zip code 61572, filed in 2013:
Average Adjusted Gross Income (AGI) in 2012: $51,896 (Individual Income Tax Returns)
Here:
$51,896
State:
$68,058
Salary/wage: $41,144 (reported on 79.6% of returns)
Here:
$41,144
State:
$55,396
(% of AGI for various income ranges: 58.6% for AGIs below $25k, 70.3% for AGIs $25k-50k, 69.2% for AGIs $50k-75k, 85.3% for AGIs $75k-100k, 45.7% for AGIs $100k-200k)
Taxable interest for individuals: $936 (reported on 51.0% of returns)
This zip code:
$936
Illinois:
$1,969
(% of AGI for various income ranges: 3.1% for AGIs below $25k, 1.0% for AGIs $25k-50k, 0.8% for AGIs $50k-75k, 0.2% for AGIs $75k-100k, 0.8% for AGIs $100k-200k)
Ordinary dividends: $675 (reported on 16.3% of returns)
Here:
$675
State:
$7,786
(% of AGI for various income ranges: 0.9% for AGIs below $25k, 0.2% for AGIs $50k-75k, 0.3% for AGIs $100k-200k)
Net capital gain/loss in AGI: +$120 (reported on 10.2% of returns)
Here:
+$120
State:
+$22,183
Profit/loss from business: +$5,800 (reported on 10.2% of returns)
Here:
+$5,800
State:
+$12,903
Taxable individual retirement arrangement distribution: $6,480 (reported on 10.2% of returns)
61572:
$6,480
Illinois:
$17,929
Total itemized deductions: $17,100 (18% of AGI, reported on 20.4% of returns)
Here:
$17,100
State:
$26,433
Here:
17.6% of AGI
State:
19.2% of AGI
(% of AGI for various income ranges: 10.2% for AGIs below $25k, 7.3% for AGIs $50k-75k, 9.1% for AGIs $75k-100k, 7.4% for AGIs $100k-200k)
Charity contributions: $2,417 (reported on 12.2% of returns)
Here:
$2,417
State:
$4,525
Taxes paid: $7,520 (reported on 20.4% of returns)
61572:
$7,520
State:
$11,968
(% of AGI for various income ranges: 3.7% for AGIs below $25k, 2.5% for AGIs $50k-75k, 3.9% for AGIs $75k-100k, 3.9% for AGIs $100k-200k)
Earned income credit: $2,133 (reported on 12.2% of returns)
Here:
$2,133
State:
$2,349
(% of AGI for various income ranges: 6.0% for AGIs below $25k)
Percentage of individuals using paid preparers for their 2012 taxes: 67.3%
Here:
67%
State:
57%
(% for various income ranges: 64.7% for AGIs below $25k, 72.7% for AGIs $25k-50k, 66.7% for AGIs $50k-75k, 50.0% for AGIs $75k-100k, 83.3% for AGIs $100k-200k)
Averages for the 2004 tax year for zip code 61572, filed in 2005:
Average Adjusted Gross Income (AGI) in 2004: $40,933 (Individual Income Tax Returns)
Here:
$40,933
State:
$54,625
Salary/wage: $36,429 (reported on 80.6% of returns)
Here:
$36,429
State:
$46,811
(% of AGI for various income ranges: 70.2% for AGIs below $10k, 57.7% for AGIs $10k-25k, 72.6% for AGIs $25k-50k, 73.8% for AGIs $50k-75k, 76.6% for AGIs $75k-100k, 67.5% for AGIs over 100k)
Taxable interest for individuals: $1,342 (reported on 59.4% of returns)
This zip code:
$1,342
Illinois:
$2,101
(% of AGI for various income ranges: 6.1% for AGIs below $10k, 4.3% for AGIs $10k-25k, 2.0% for AGIs $25k-50k, 1.3% for AGIs $50k-75k, 1.6% for AGIs $75k-100k, 1.6% for AGIs over 100k)
Taxable dividends: $394 (reported on 23.5% of returns)
Here:
$394
State:
$4,306
(% of AGI for various income ranges: 1.0% for AGIs below $10k, 0.7% for AGIs $10k-25k, 0.2% for AGIs $25k-50k, 0.2% for AGIs $50k-75k, 0.0% for AGIs $75k-100k, 0.2% for AGIs over 100k)
Net capital gain/loss: +$304 (reported on 14.9% of returns)
Here:
+$304
State:
+$17,321
(% of AGI for various income ranges: -0.7% for AGIs $10k-25k, 0.2% for AGIs $25k-50k, 0.3% for AGIs $50k-75k, 0.2% for AGIs $75k-100k)
Profit/loss from business: +$6,288 (reported on 12.7% of returns)
Here:
+$6,288
State:
+$11,771
Profit/loss from farming: +$1,467 (reported on 6.5% of returns)
Here:
+$1,467
State:
+$2,327
IRA payment deduction: $4,000 (reported on 2.8% of returns)
61572:
$4,000
Illinois:
$3,087
Total itemized deductions: $14,583 (21% of AGI, reported on 18.1% of returns)
Here:
$14,583
State:
$20,239
Here:
21.5% of AGI
State:
19.5% of AGI
(% of AGI for various income ranges: 6.4% for AGIs $25k-50k, 7.4% for AGIs $50k-75k, 7.7% for AGIs $75k-100k, 8.0% for AGIs over 100k)
Charity contributions deductions: $2,093 (3% of AGI, reported on 11.7% of returns)
Here:
$2,093
State:
$3,719
Here:
3.0% of AGI
State:
3.4% of AGI
(% of AGI for various income ranges: 0.5% for AGIs $10k-25k, 0.8% for AGIs $50k-75k, 0.9% for AGIs $75k-100k, 0.9% for AGIs over 100k)
Total tax: $4,702 (reported on 80.6% of returns)
61572:
$4,702
State:
$9,882
(% of AGI for various income ranges: 2.9% for AGIs below $10k, 5.1% for AGIs $10k-25k, 7.2% for AGIs $25k-50k, 8.9% for AGIs $50k-75k, 10.6% for AGIs $75k-100k, 15.6% for AGIs over 100k)
Earned income credit: $1,667 (reported on 10.4% of returns)
Here:
$1,667
State:
$1,788
Percentage of individuals using paid preparers for their 2004 taxes: 72.1%
Here:
72%
State:
61%
(% for various income ranges: 64.5% for AGIs below $10k, 75.5% for AGIs $10k-25k, 73.3% for AGIs $25k-50k, 74.8% for AGIs $50k-75k, 64.3% for AGIs $75k-100k, 80.0% for AGIs over 100k)
Likely homosexual households (counted as self-reported same-sex unmarried-partner households)
Lesbian couples: 0.0% of all households
Gay men: 0.4% of all households
Household received Food Stamps/SNAP in the past 12 months: 27 Household did not receive Food Stamps/SNAP in the past 12 months: 419
Women who had a birth in the past 12 months: 11 (7 now married, 3 unmarried) Women who did not have a birth in the past 12 months: 209 (87 now married, 122 unmarried)
Housing units in zip code 61572 with a mortgage: 187 (3 second mortgage, 3 both second mortgage and home equity loan) Houses without a mortgage: 3
Median monthly owner costs for units with a mortgage: $993 Median monthly owner costs for units without a mortgage: $510
Residents with income below the poverty level in 2022:
This zip code:
9.4%
Whole state:
11.9%
Residents with income below 50% of the poverty level in 2022:
This zip code:
6.9%
Whole state:
5.7%
Median number of rooms in houses and condos:
Here:
5.9
State:
6.4
Median number of rooms in apartments:
Here:
4.5
State:
4.1
Notable locations in this zip code not listed on our city pages
Notable locations in zip code 61572: Faith Camp (A), Yates City Community Center (B), Elba - Salem Fire Protection District (C). Display/hide their locations on the map
Cemeteries: Yates City Cemetery (1), Pleasant Hill Cemetery (2), Summitt-Douglas Cemetery (3), Kightlinger Cemetery (4). Display/hide their locations on the map
Size of family households: 114 2-persons, 77 3-persons, 60 4-persons, 13 5-persons
Size of nonfamily households: 169 1-person, 9 2-persons, 7 3-persons
94 married couples with children.
62 single-parent households (12 men, 50 women).
99.5% of residents of 61572 zip code speak English at home.
0.2% of residents speak Spanish at home (100% not well).
0.1% of residents speak Asian or Pacific Island language at home (100% very well).
Foreign born population: 3 (0.3%) (66.9% of them are naturalized citizens)
This zip code:
0.3%
Whole state:
14.4%
37%English
26%German
7%Irish
5%Italian
4%Polish
3%American
2%Lebanese
Year of entry for the foreign-born population
02010 or later
12000 to 2009
01990 to 1999
0Before 1990
Facilities with environmental interests located in this zip code:
GRAVES MILLING CO INC (200 MAIN ST in YATES CITY, IL)
STATE MASTER (Illinois EPA Project) - AIR PROGRAM AIR MINOR (AIRS/AFS) CRITERIA AND HAZARDOUS AIR POLLUTANT INVENTORY (Inventory of air pollution sources) Business SIC classification: GRAIN AND FIELD BEANS
IL DOT I-74 KNOX COUNTY (MILE MARKER 63 I-74 in YATES CITY, IL)
STATE MASTER (Illinois EPA Project) - National Pollutant Discharge Elimination System Permit National Pollutant Discharge Elimination System NON-MAJOR (Tracking pollutant discharge elimination systems) - permit Business SIC classification: REGULATION AND ADMINISTRATION OF TRANSPORTATION PROGRAMS Alternative names: IDOT-I74 KNOX COUNTY, IL DOT-I74 KNOX COUNTY, IL DOT SPOON RIVER RA
DELUX AUTOBODY (104 E MAIN in YATES CITY, IL)
STATE MASTER (Illinois EPA Project) - HAZARDOUS WASTE PROGRAM Conditionally Exempt Small Quantity Generators, less than 100 kg/month of hazardous waste (Resource Conservation and Recovery Act (tracking hazardous waste)) - notification Organizations: FILKER STEVE (CONTACT/OWNER)
Alternative names: DELUX AUTO BODY
GRACE W R AND CO (HWY 8 NEAR DOUGLAS in YATES CITY, IL)
(Resource Conservation and Recovery Act (tracking hazardous waste))
MEEHAN TRUCKING (BOX 104 in YATES CITY, IL)
National Pollutant Discharge Elimination System NON-MAJOR (Tracking pollutant discharge elimination systems) - permit Organizations: MEEHAN?BERWYN (CONTACT/OWNER)
Housing units lacking complete kitchen facilities: 1.1%
59.1%Utility gas
27.5%Bottled, tank, or LP gas
13.5%Electricity
Population in 1990: 1,402.
Place of birth for U.S.-born residents:
This state: 936
Northeast: 1
Midwest: 24
South: 26
West: 17
67% of the 61572 zip code residents lived in the same house 5 years ago. Out of people who lived in different houses, 24% lived in this county. Out of people who lived in different counties, 50% lived in Illinois.
95% of the 61572 zip code residents lived in the same house 1 year ago. Out of people who lived in different houses, 24% moved from this county. Out of people who lived in different houses, 58% moved from different county within same state. Out of people who lived in different houses, 24% moved from abroad.
Private vs. public school enrollment:
Students in private schools in grades 1 to 8 (elementary and middle school):
Here:
0.0%
Illinois:
13.3%
Students in private schools in grades 9 to 12 (high school): 7
Here:
25.0%
Illinois:
9.9%
Students in private undergraduate colleges: 1
Here:
4.4%
Illinois:
27.4%
Occupation by median earnings in the past 12 months ($)
100,536Transportation occupations
84,973Legal occupations
68,256Health diagnosing and treating practitioners and other technical occupations
53,963Management occupations
50,165Production occupations
41,930Construction and extraction occupations
Top industries in this zip code by the number of employees in 2005:
Finance and Insurance: Commercial Banking (10-19 employees: 1 establishment)
Accommodation and Food Services: Drinking Places (Alcoholic Beverages) (1-4: 2)
Arts, Entertainment, and Recreation: Independent Artists, Writers, and Performers (1-4: 1)
Wholesale Trade: Grain and Field Bean Merchant Wholesalers (1-4: 1)
Other Services (except Public Administration): Pet Care (except Veterinary) Services (1-4: 1)
Other Services (except Public Administration): Religious Organizations (1-4: 1)
Other Services (except Public Administration): Cemeteries and Crematories (1-4: 1)
Fatal accident statistics in 2010:
Fatal accident count: 1
Vehicles involved in fatal accidents: 3
Fatal accidents caused by drunken drivers: 0
Fatalities: 1
Persons involved in fatal accidents: 2
Pedestrians involved in fatal accidents: 1
2002 - 2018 National Fire Incident Reporting System (NFIRS) incidents
Based on the data from the years 2002 - 2018 the average number of fire incidents per year is 10. The highest number of fires - 29 took place in 2009, and the least - 1 in 2018. The data has a decreasing trend.
When looking into fire subcategories, the most incidents belonged to: Outside Fires (52.0%), and Structure Fires (35.6%).
Fire incident types reported to NFIRS in Zip Code 61572


 Nearest zip codes: 61529, 61531, 61489, 61458, 61428, 61451.


 Based on the data from the years 2002 - 2018 the average number of fire incidents per year is 10. The highest number of fires - 29 took place in 2009, and the least - 1 in 2018. The data has a decreasing trend.
 When looking into fire subcategories, the most incidents belonged to: Outside Fires (52.0%), and Structure Fires (35.6%).