Estimated zip code population in 2022: 457 Zip code population in 2010: 822 Zip code population in 2000: 958
Houses and condos: 247 Renter-occupied apartments: 36
% of renters here:
16%
State:
33%
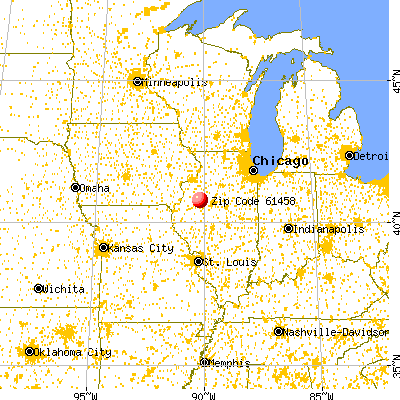
March 2022 cost of living index in zip code 61458: 83.9 (less than average, U.S. average is 100)
Land area: 83.1 sq. mi. Water area: 0.2 sq. mi.
Population density: 6 people per square mile
(very low).
OSM Map
General Map
Google Map
MSN Map
OSM Map
General Map
Google Map
MSN Map
OSM Map
General Map
Google Map
MSN Map
OSM Map
General Map
Google Map
MSN Map
Please wait while loading the map...
Real estate property taxes paid for housing units in 2022:
This zip code:
1.8% ($1,844)
Illinois:
2.0% ($4,912)
Median real estate property taxes paid for housing units with mortgages in 2022: $1,750 (1.8%) Median real estate property taxes paid for housing units with no mortgage in 2022: $1,988 (1.7%)
Business Search- 14 Million verified businesses
Males: 241
(52.8%)
Females: 215
(47.2%)
For population 25 years and over in 61458:
High school or higher: 88.5%
Bachelor's degree or higher: 19.6%
Graduate or professional degree: 6.6%
Unemployed: 3.0%
Mean travel time to work (commute): 29.3 minutes
For population 15 years and over in 61458:
Never married: 16.2%
Now married: 62.0%
Separated: 0.2%
Widowed: 5.7%
Divorced: 15.8%
Zip code 61458 compared to state average:
Median house value significantly below state average.
Black race population percentage significantly below state average.
Hispanic race population percentage significantly below state average.
Median age significantly above state average.
Foreign-born population percentage significantly below state average.
Renting percentage below state average.
Length of stay since moving in significantly above state average.
House age above state average.
Number of college students significantly below state average.
Percentage of population with a bachelor's degree or higher below state average.
Averages for the 2020 tax year for zip code 61458, filed in 2021:
Average Adjusted Gross Income (AGI) in 2020: $53,500 (Individual Income Tax Returns)
Here:
$53,500
State:
$82,626
Salary/wage: $41,270 (reported on 81.1% of returns)
Here:
$41,270
State:
$66,640
(% of AGI for various income ranges: 1180.0% for AGIs below $25k, 3717.1% for AGIs $25k-50k, 6822.0% for AGIs $50k-75k, 5436.0% for AGIs $75k-100k)
Taxable interest for individuals: $450 (reported on 43.2% of returns)
This zip code:
$450
Illinois:
$2,376
(% of AGI for various income ranges: 13.8% for AGIs below $25k, 14.3% for AGIs $25k-50k, 40.0% for AGIs $50k-75k, 16.0% for AGIs $75k-100k)
Ordinary dividends: $3,129 (reported on 18.9% of returns)
Here:
$3,129
State:
$9,061
(% of AGI for various income ranges: 88.6% for AGIs $25k-50k, 314.0% for AGIs $75k-100k)
Net capital gain/loss in AGI: +$9,700 (reported on 16.2% of returns)
Here:
+$9,700
State:
+$31,684
(% of AGI for various income ranges: 288.6% for AGIs $25k-50k, 760.0% for AGIs $75k-100k)
Profit/loss from business: +$5,500 (reported on 8.1% of returns)
Here:
+$5,500
State:
+$12,175
(% of AGI for various income ranges: 235.7% for AGIs $25k-50k)
Taxable individual retirement arrangement distribution: $6,933 (reported on 8.1% of returns)
61458:
$6,933
Illinois:
$21,613
(% of AGI for various income ranges: 297.1% for AGIs $25k-50k)
Earned income credit: $2,075 (reported on 10.8% of returns)
Here:
$2,075
State:
$2,311
(% of AGI for various income ranges: 103.8% for AGIs below $25k)
Percentage of individuals using paid preparers for their 2020 taxes: 94.6%
Here:
95%
State:
93%
(% for various income ranges: 91.7% for AGIs below $25k, 100.0% for AGIs $25k-50k, 87.5% for AGIs $50k-75k, 100.0% for AGIs $75k-100k, 100.0% for AGIs $100k-200k)
Averages for the 2012 tax year for zip code 61458, filed in 2013:
Average Adjusted Gross Income (AGI) in 2012: $44,955 (Individual Income Tax Returns)
Here:
$44,955
State:
$68,058
Salary/wage: $35,258 (reported on 77.5% of returns)
Here:
$35,258
State:
$55,396
(% of AGI for various income ranges: 66.1% for AGIs below $25k, 70.5% for AGIs $25k-50k, 72.8% for AGIs $50k-75k, 94.0% for AGIs $75k-100k)
Taxable interest for individuals: $600 (reported on 47.5% of returns)
This zip code:
$600
Illinois:
$1,969
(% of AGI for various income ranges: 1.2% for AGIs below $25k, 0.7% for AGIs $25k-50k, 0.5% for AGIs $50k-75k, 1.1% for AGIs $75k-100k)
Ordinary dividends: $1,143 (reported on 17.5% of returns)
Here:
$1,143
State:
$7,786
Net capital gain/loss in AGI: +$1,425 (reported on 10.0% of returns)
Here:
+$1,425
State:
+$22,183
Profit/loss from business: +$2,700 (reported on 10.0% of returns)
Here:
+$2,700
State:
+$12,903
Taxable individual retirement arrangement distribution: $5,825 (reported on 10.0% of returns)
61458:
$5,825
Illinois:
$17,929
Total itemized deductions: $19,617 (21% of AGI, reported on 15.0% of returns)
Here:
$19,617
State:
$26,433
Here:
20.8% of AGI
State:
19.2% of AGI
Charity contributions: $1,200 (reported on 7.5% of returns)
Here:
$1,200
State:
$4,525
Taxes paid: $7,783 (reported on 15.0% of returns)
61458:
$7,783
State:
$11,968
Earned income credit: $1,667 (reported on 15.0% of returns)
Here:
$1,667
State:
$2,349
(% of AGI for various income ranges: 5.6% for AGIs below $25k)
Percentage of individuals using paid preparers for their 2012 taxes: 67.5%
Here:
68%
State:
57%
(% for various income ranges: 71.4% for AGIs below $25k, 54.5% for AGIs $25k-50k, 85.7% for AGIs $50k-75k, 60.0% for AGIs $75k-100k, 66.7% for AGIs $100k-200k)
Averages for the 2004 tax year for zip code 61458, filed in 2005:
Average Adjusted Gross Income (AGI) in 2004: $33,309 (Individual Income Tax Returns)
Here:
$33,309
State:
$54,625
Salary/wage: $30,587 (reported on 77.8% of returns)
Here:
$30,587
State:
$46,811
(% of AGI for various income ranges: 69.9% for AGIs below $10k, 60.3% for AGIs $10k-25k, 74.0% for AGIs $25k-50k, 82.4% for AGIs $50k-75k, 78.8% for AGIs $75k-100k, 49.4% for AGIs over 100k)
Taxable interest for individuals: $876 (reported on 50.5% of returns)
This zip code:
$876
Illinois:
$2,101
(% of AGI for various income ranges: 6.3% for AGIs below $10k, 3.1% for AGIs $10k-25k, 1.1% for AGIs $25k-50k, 0.4% for AGIs $50k-75k, 0.3% for AGIs $75k-100k, 1.5% for AGIs over 100k)
Taxable dividends: $855 (reported on 20.0% of returns)
Here:
$855
State:
$4,306
(% of AGI for various income ranges: 1.4% for AGIs below $10k, 0.9% for AGIs $10k-25k, 0.2% for AGIs $25k-50k, 1.2% for AGIs $50k-75k)
Net capital gain/loss: +$3,530 (reported on 15.9% of returns)
Here:
+$3,530
State:
+$17,321
(% of AGI for various income ranges: -1.6% for AGIs below $10k, 4.5% for AGIs $10k-25k, -0.3% for AGIs $25k-50k, 10.0% for AGIs $75k-100k)
Profit/loss from business: +$4,111 (reported on 8.7% of returns)
Here:
+$4,111
State:
+$11,771
Profit/loss from farming: +$875 (reported on 19.3% of returns)
Here:
+$875
State:
+$2,327
(% of AGI for various income ranges: 3.6% for AGIs below $10k, 3.1% for AGIs $10k-25k, 2.3% for AGIs $25k-50k, -3.2% for AGIs $50k-75k)
Total itemized deductions: $13,119 (18% of AGI, reported on 10.1% of returns)
Here:
$13,119
State:
$20,239
Here:
17.8% of AGI
State:
19.5% of AGI
Charity contributions deductions: $1,042 (1% of AGI, reported on 5.8% of returns)
Here:
$1,042
State:
$3,719
Here:
1.4% of AGI
State:
3.4% of AGI
Total tax: $4,177 (reported on 72.2% of returns)
61458:
$4,177
State:
$9,882
(% of AGI for various income ranges: 2.8% for AGIs below $10k, 4.9% for AGIs $10k-25k, 8.1% for AGIs $25k-50k, 8.3% for AGIs $50k-75k, 10.8% for AGIs $75k-100k, 16.8% for AGIs over 100k)
Earned income credit: $1,569 (reported on 15.7% of returns)
Here:
$1,569
State:
$1,788
Percentage of individuals using paid preparers for their 2004 taxes: 67.1%
Here:
67%
State:
61%
(% for various income ranges: 62.6% for AGIs below $10k, 68.3% for AGIs $10k-25k, 62.8% for AGIs $25k-50k, 71.4% for AGIs $50k-75k, 90.0% for AGIs $75k-100k, 78.6% for AGIs over 100k)
Household received Food Stamps/SNAP in the past 12 months: 27 Household did not receive Food Stamps/SNAP in the past 12 months: 198
Women who did not have a birth in the past 12 months: 86 (42 now married, 43 unmarried)
Housing units in zip code 61458 with a mortgage: 82 (11 second mortgage, 10 both second mortgage and home equity loan) Median monthly owner costs for units with a mortgage: $1,071 Median monthly owner costs for units without a mortgage: $519
Residents with income below the poverty level in 2022:
This zip code:
14.7%
Whole state:
11.9%
Residents with income below 50% of the poverty level in 2022:
This zip code:
11.4%
Whole state:
5.7%
Median number of rooms in houses and condos:
Here:
6.2
State:
6.4
Median number of rooms in apartments:
Here:
5.2
State:
4.1
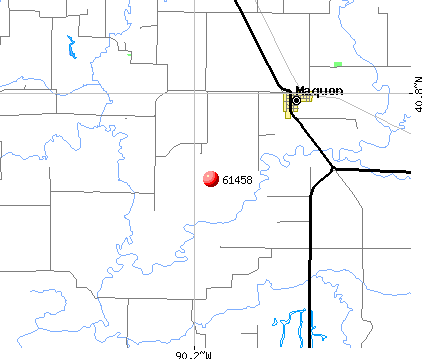
Notable locations in this zip code not listed on our city pages
Creeks: Littlers Creek (A), Hickory Creek (B), Hermon Creek (C), Haw Creek (D), Pig Creek (E), French Creek (F), Flea Creek (G). Display/hide their locations on the map
Size of family households: 105 2-persons, 28 3-persons, 10 4-persons, 9 6-persons
Size of nonfamily households: 69 1-person, 4 2-persons
31 married couples with children.
21 single-parent households (9 men, 12 women).
97.6% of residents of 61458 zip code speak English at home.
2.4% of residents speak other Indo-European language at home (100% very well).
Foreign born population: 28 (6.3%) (0.0% of them are naturalized citizens)
:
6.3%
Whole state:
14.4%
103%France
29%German
16%Irish
15%American
10%English
2%French
2%Scotch-Irish
1%Dutch
Year of entry for the foreign-born population
342010 or later
02000 to 2009
01990 to 1999
0Before 1990
Facilities with environmental interests located in this zip code:
AUSTIN ALAN (109 WEST STREET in MAQUON, IL)
STATE MASTER (Illinois EPA Project) - National Pollutant Discharge Elimination System Permit National Pollutant Discharge Elimination System NON-MAJOR (Tracking pollutant discharge elimination systems) - permit Organizations: ALAN AUSTIN TRUCKING (CONTACT/OWNER)
Alternative names: ALAN AUSTIN TRUCKING
RIVERLAND FS INC (HERMON ELEVATOR in HERMON, IL)
STATE MASTER (Illinois EPA Project) - AIR PROGRAM AIR MINOR (AIRS/AFS) CRITERIA AND HAZARDOUS AIR POLLUTANT INVENTORY (Inventory of air pollution sources) Business SIC classification: GRAIN AND FIELD BEANS Alternative names: SPOON RIVER FS INC.
GROWMARK (CITY OF in MAQUON, IL)
STATE MASTER (Illinois EPA Project) - AIR PROGRAM AIR MINOR (AIRS/AFS) Business SIC classification: PETROLEUM BULK STATIONS AND TERMINALS
MAQUON STP (116 WEST STREET in MAQUON, IL)
STATE MASTER (Illinois EPA Project) - National Pollutant Discharge Elimination System Permit National Pollutant Discharge Elimination System NON-MAJOR (Tracking pollutant discharge elimination systems) - permit Business SIC classification: SEWERAGE SYSTEMS Alternative names: MAQUON STP, VILLAGE OF
HANKS LEROY C&SONS TRUCKING (RR1 BOX 27 in MAQUON, IL)
National Pollutant Discharge Elimination System NON-MAJOR (Tracking pollutant discharge elimination systems) - permit
MAQUON SWG TRT PLT (RURAL ROUTE #1 in MAQUON, IL)
National Pollutant Discharge Elimination System NON-MAJOR (Tracking pollutant discharge elimination systems) - permit Business SIC classification: SEWERAGE SYSTEMS Alternative names: MAQUON STP
Housing units lacking complete plumbing facilities: 4.3% Housing units lacking complete kitchen facilities: 4.0%
58.1%Utility gas
32.4%Bottled, tank, or LP gas
6.8%Electricity
3.2%Other fuel
Population in 1990: 1,226.
Place of birth for U.S.-born residents:
This state: 357
Northeast: 8
Midwest: 20
South: 10
West: 31
67% of the 61458 zip code residents lived in the same house 5 years ago. Out of people who lived in different houses, 55% lived in this county. Out of people who lived in different counties, 50% lived in Illinois.
99% of the 61458 zip code residents lived in the same house 1 year ago. Out of people who lived in different houses, 40% moved from different county within same state. Out of people who lived in different houses, 80% moved from abroad.
Private vs. public school enrollment:
Students in private schools in grades 1 to 8 (elementary and middle school):
Here:
0.0%
Illinois:
13.3%
Students in private schools in grades 9 to 12 (high school):
Here:
0.0%
Illinois:
9.9%
Students in private undergraduate colleges: 2
Here:
100.0%
Illinois:
27.4%
Occupation by median earnings in the past 12 months ($)
58,240Production occupations
55,050Management occupations
52,990Health technologists and technicians
52,039Education, training, and library occupations
48,059Construction and extraction occupations
41,234Food preparation and serving related occupations
Top industries in this zip code by the number of employees in 2005:
Wholesale Trade: Grain and Field Bean Merchant Wholesalers (10-19 employees: 1 establishment)
Other Services (except Public Administration): Religious Organizations (1-4: 1)
Accommodation and Food Services: Drinking Places (Alcoholic Beverages) (1-4: 1)
Other Services (except Public Administration): Other Personal Care Services (1-4: 1)
Fatal accident statistics in 2013:
Fatal accident count: 1
Vehicles involved in fatal accidents: 1
Fatal accidents caused by drunken drivers: 0
Fatalities: 1
Persons involved in fatal accidents: 2
Pedestrians involved in fatal accidents: 0
Fatal accident statistics in 2010:
Fatal accident count: 1
Vehicles involved in fatal accidents: 1
Fatal accidents caused by drunken drivers: 1
Fatalities: 1
Persons involved in fatal accidents: 2
Pedestrians involved in fatal accidents: 0
2002 - 2018 National Fire Incident Reporting System (NFIRS) incidents
According to the data from the years 2002 - 2018 the average number of fires per year is 10. The highest number of fires - 26 took place in 2014, and the least - 3 in 2005. The data has a dropping trend.
When looking into fire subcategories, the most incidents belonged to: Outside Fires (59.0%), and Structure Fires (24.7%).
Fire incident types reported to NFIRS in Zip Code 61458


 Nearest zip codes: 61436, 61544, 61432, 61572, 61448, 61531.


 According to the data from the years 2002 - 2018 the average number of fires per year is 10. The highest number of fires - 26 took place in 2014, and the least - 3 in 2005. The data has a dropping trend.
 When looking into fire subcategories, the most incidents belonged to: Outside Fires (59.0%), and Structure Fires (24.7%).