Estimated zip code population in 2022: 1,899 Zip code population in 2010: 2,184 Zip code population in 2000: 2,477
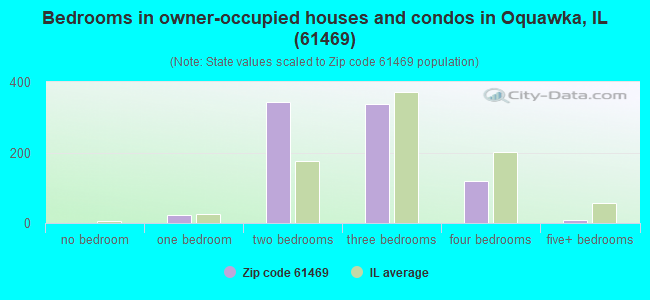
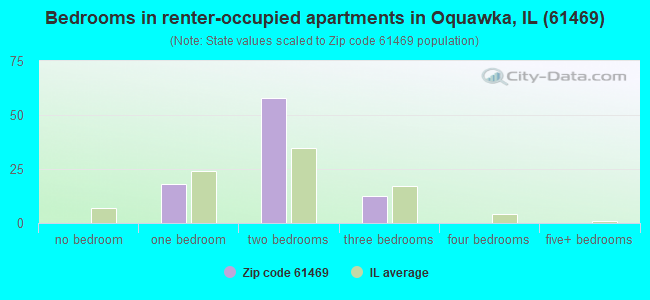
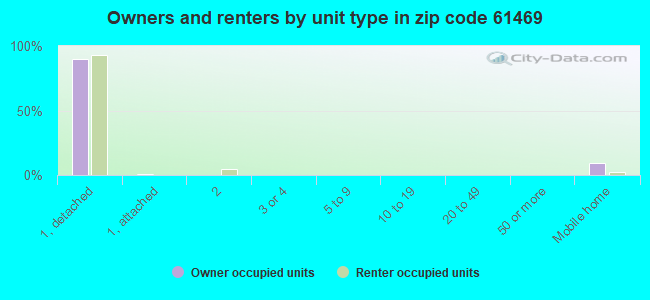
Houses and condos: 1,149 Renter-occupied apartments: 88
% of renters here:
10%
State:
33%
March 2022 cost of living index in zip code 61469: 83.9 (less than average, U.S. average is 100)
Land area: 45.6 sq. mi. Water area: 4.2 sq. mi.
Population density: 42 people per square mile
(very low).
OSM Map
General Map
Google Map
MSN Map
OSM Map
General Map
Google Map
MSN Map
OSM Map
General Map
Google Map
MSN Map
OSM Map
General Map
Google Map
MSN Map
Please wait while loading the map...
Real estate property taxes paid for housing units in 2022:
This zip code:
1.6% ($1,676)
Illinois:
2.0% ($4,912)
Median real estate property taxes paid for housing units with mortgages in 2022: $1,607 (1.4%) Median real estate property taxes paid for housing units with no mortgage in 2022: $1,747 (1.9%)
Business Search- 14 Million verified businesses
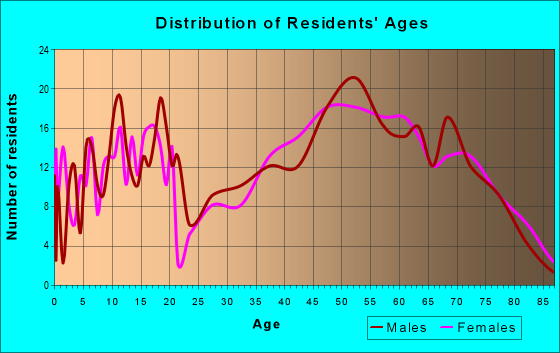
Males: 964
(50.8%)
Females: 935
(49.2%)
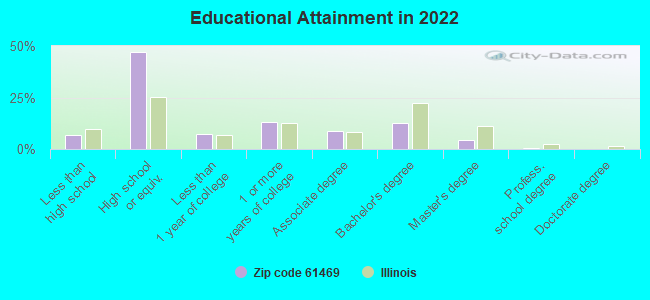
For population 25 years and over in 61469:
High school or higher: 91.6%
Bachelor's degree or higher: 16.9%
Graduate or professional degree: 4.5%
Unemployed: 13.2%
Mean travel time to work (commute): 26.3 minutes
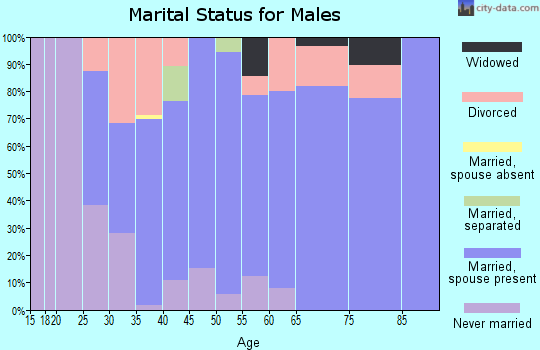
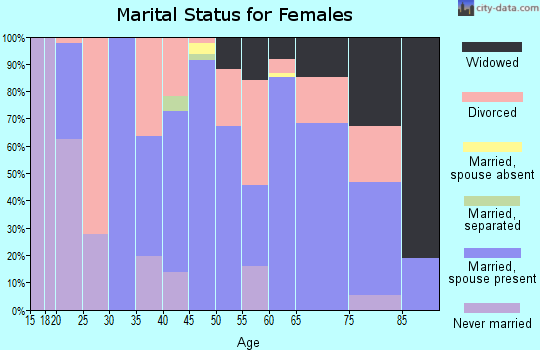
For population 15 years and over in 61469:
Never married: 21.2%
Now married: 55.6%
Separated: 1.4%
Widowed: 11.6%
Divorced: 10.2%
Zip code 61469 compared to state average:
Median household income below state average.
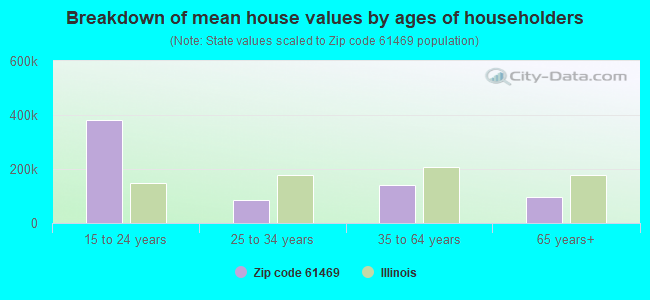
Median house value significantly below state average.
Unemployed percentage above state average.
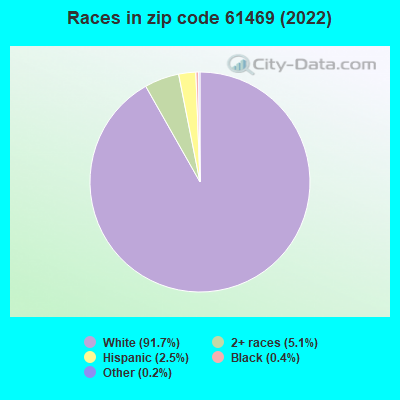
Black race population percentage significantly below state average.
Hispanic race population percentage significantly below state average.
Median age significantly above state average.
Foreign-born population percentage significantly below state average.
Renting percentage significantly below state average.
Length of stay since moving in significantly above state average.
Number of college students significantly below state average.
Percentage of population with a bachelor's degree or higher below state average.
Averages for the 2020 tax year for zip code 61469, filed in 2021:
Average Adjusted Gross Income (AGI) in 2020: $51,671 (Individual Income Tax Returns)
Here:
$51,671
State:
$82,626
Salary/wage: $40,614 (reported on 80.2% of returns)
Here:
$40,614
State:
$66,640
(% of AGI for various income ranges: 1174.1% for AGIs below $25k, 3077.7% for AGIs $25k-50k, 5995.0% for AGIs $50k-75k, 9297.1% for AGIs $75k-100k, 15582.0% for AGIs $100k-200k)
Taxable interest for individuals: $1,062 (reported on 35.2% of returns)
This zip code:
$1,062
Illinois:
$2,376
(% of AGI for various income ranges: 22.7% for AGIs below $25k, 32.7% for AGIs $25k-50k, 83.0% for AGIs $50k-75k, 30.0% for AGIs $75k-100k, 228.0% for AGIs $100k-200k)
Ordinary dividends: $3,422 (reported on 9.9% of returns)
Here:
$3,422
State:
$9,061
(% of AGI for various income ranges: 35.9% for AGIs $25k-50k, 33.0% for AGIs $50k-75k, 280.0% for AGIs $75k-100k)
Net capital gain/loss in AGI: +$9,256 (reported on 9.9% of returns)
Here:
+$9,256
State:
+$31,684
(% of AGI for various income ranges: 1.4% for AGIs below $25k, 49.5% for AGIs $25k-50k, 1030.0% for AGIs $75k-100k)
Profit/loss from business: +$7,727 (reported on 12.1% of returns)
Here:
+$7,727
State:
+$12,175
(% of AGI for various income ranges: 79.5% for AGIs below $25k, 163.2% for AGIs $25k-50k, 451.4% for AGIs $75k-100k)
Taxable individual retirement arrangement distribution: $12,914 (reported on 7.7% of returns)
61469:
$12,914
Illinois:
$21,613
(% of AGI for various income ranges: 180.5% for AGIs $25k-50k, 507.0% for AGIs $50k-75k)
Earned income credit: $2,093 (reported on 15.4% of returns)
Here:
$2,093
State:
$2,311
(% of AGI for various income ranges: 82.7% for AGIs below $25k, 50.5% for AGIs $25k-50k)
Percentage of individuals using paid preparers for their 2020 taxes: 92.3%
Here:
92%
State:
93%
(% for various income ranges: 90.3% for AGIs below $25k, 92.6% for AGIs $25k-50k, 92.9% for AGIs $50k-75k, 90.0% for AGIs $75k-100k, 100.0% for AGIs $100k-200k)
Averages for the 2012 tax year for zip code 61469, filed in 2013:
Average Adjusted Gross Income (AGI) in 2012: $41,719 (Individual Income Tax Returns)
Here:
$41,719
State:
$68,058
Salary/wage: $33,798 (reported on 81.8% of returns)
Here:
$33,798
State:
$55,396
(% of AGI for various income ranges: 68.9% for AGIs below $25k, 77.8% for AGIs $25k-50k, 73.7% for AGIs $50k-75k, 73.8% for AGIs $75k-100k, 41.3% for AGIs $100k-200k)
Taxable interest for individuals: $826 (reported on 38.4% of returns)
This zip code:
$826
Illinois:
$1,969
(% of AGI for various income ranges: 1.5% for AGIs below $25k, 0.7% for AGIs $25k-50k, 0.6% for AGIs $50k-75k, 0.5% for AGIs $75k-100k, 0.7% for AGIs $100k-200k)
Ordinary dividends: $3,536 (reported on 11.1% of returns)
Here:
$3,536
State:
$7,786
(% of AGI for various income ranges: 0.3% for AGIs below $25k, 0.3% for AGIs $25k-50k, 1.0% for AGIs $50k-75k, 2.6% for AGIs $100k-200k)
Net capital gain/loss in AGI: +$4,725 (reported on 8.1% of returns)
Here:
+$4,725
State:
+$22,183
(% of AGI for various income ranges: 0.4% for AGIs $50k-75k, 3.6% for AGIs $100k-200k)
Profit/loss from business: +$6,227 (reported on 11.1% of returns)
Here:
+$6,227
State:
+$12,903
(% of AGI for various income ranges: 4.2% for AGIs below $25k, 1.4% for AGIs $25k-50k, 3.5% for AGIs $50k-75k)
Taxable individual retirement arrangement distribution: $10,067 (reported on 9.1% of returns)
61469:
$10,067
Illinois:
$17,929
(% of AGI for various income ranges: 5.1% for AGIs below $25k, 1.6% for AGIs $50k-75k, 6.7% for AGIs $75k-100k)
Total itemized deductions: $19,660 (22% of AGI, reported on 15.2% of returns)
Here:
$19,660
State:
$26,433
Here:
22.3% of AGI
State:
19.2% of AGI
(% of AGI for various income ranges: 6.5% for AGIs $25k-50k, 6.9% for AGIs $50k-75k, 9.6% for AGIs $75k-100k, 10.1% for AGIs $100k-200k)
Charity contributions: $2,410 (reported on 10.1% of returns)
Here:
$2,410
State:
$4,525
(% of AGI for various income ranges: 0.7% for AGIs $25k-50k, 0.8% for AGIs $75k-100k, 1.2% for AGIs $100k-200k)
Taxes paid: $5,520 (reported on 15.2% of returns)
61469:
$5,520
State:
$11,968
(% of AGI for various income ranges: 1.1% for AGIs $25k-50k, 1.9% for AGIs $50k-75k, 2.6% for AGIs $75k-100k, 3.7% for AGIs $100k-200k)
Earned income credit: $2,045 (reported on 20.2% of returns)
Here:
$2,045
State:
$2,349
(% of AGI for various income ranges: 6.1% for AGIs below $25k, 0.8% for AGIs $25k-50k)
Percentage of individuals using paid preparers for their 2012 taxes: 63.6%
Here:
64%
State:
57%
(% for various income ranges: 53.5% for AGIs below $25k, 63.0% for AGIs $25k-50k, 73.3% for AGIs $50k-75k, 87.5% for AGIs $75k-100k, 83.3% for AGIs $100k-200k)
Averages for the 2004 tax year for zip code 61469, filed in 2005:
Average Adjusted Gross Income (AGI) in 2004: $30,288 (Individual Income Tax Returns)
Here:
$30,288
State:
$54,625
Salary/wage: $28,484 (reported on 78.9% of returns)
Here:
$28,484
State:
$46,811
(% of AGI for various income ranges: 113.4% for AGIs below $10k, 64.9% for AGIs $10k-25k, 77.9% for AGIs $25k-50k, 78.6% for AGIs $50k-75k, 79.4% for AGIs $75k-100k, 43.7% for AGIs over 100k)
Taxable interest for individuals: $858 (reported on 51.2% of returns)
This zip code:
$858
Illinois:
$2,101
(% of AGI for various income ranges: 5.9% for AGIs below $10k, 2.6% for AGIs $10k-25k, 0.7% for AGIs $25k-50k, 1.1% for AGIs $50k-75k, 0.3% for AGIs $75k-100k, 3.6% for AGIs over 100k)
Taxable dividends: $1,892 (reported on 14.6% of returns)
Here:
$1,892
State:
$4,306
(% of AGI for various income ranges: 0.4% for AGIs below $10k, 0.7% for AGIs $10k-25k, 0.2% for AGIs $25k-50k, 0.5% for AGIs $50k-75k, 0.1% for AGIs $75k-100k, 6.7% for AGIs over 100k)
Net capital gain/loss: +$4,135 (reported on 10.2% of returns)
Here:
+$4,135
State:
+$17,321
(% of AGI for various income ranges: -0.4% for AGIs $10k-25k, -0.1% for AGIs $25k-50k, 0.5% for AGIs $50k-75k, 16.3% for AGIs over 100k)
Profit/loss from business: +$4,256 (reported on 15.8% of returns)
Here:
+$4,256
State:
+$11,771
(% of AGI for various income ranges: 10.6% for AGIs below $10k, 5.6% for AGIs $10k-25k, 1.8% for AGIs $25k-50k, 1.6% for AGIs $50k-75k)
IRA payment deduction: $2,722 (reported on 1.8% of returns)
61469:
$2,722
Illinois:
$3,087
Total itemized deductions: $13,643 (25% of AGI, reported on 12.7% of returns)
Here:
$13,643
State:
$20,239
Here:
24.9% of AGI
State:
19.5% of AGI
(% of AGI for various income ranges: 3.4% for AGIs $10k-25k, 5.2% for AGIs $25k-50k, 6.9% for AGIs $50k-75k, 7.4% for AGIs $75k-100k, 7.8% for AGIs over 100k)
Charity contributions deductions: $1,600 (3% of AGI, reported on 8.4% of returns)
Here:
$1,600
State:
$3,719
Here:
2.8% of AGI
State:
3.4% of AGI
(% of AGI for various income ranges: 2.9% for AGIs below $10k, 0.3% for AGIs $25k-50k, 0.3% for AGIs $50k-75k, 1.9% for AGIs $75k-100k)
Total tax: $3,264 (reported on 71.5% of returns)
61469:
$3,264
State:
$9,882
(% of AGI for various income ranges: 3.8% for AGIs below $10k, 4.0% for AGIs $10k-25k, 6.4% for AGIs $25k-50k, 8.5% for AGIs $50k-75k, 10.6% for AGIs $75k-100k, 15.1% for AGIs over 100k)
Earned income credit: $1,526 (reported on 19.3% of returns)
Here:
$1,526
State:
$1,788
Percentage of individuals using paid preparers for their 2004 taxes: 69.2%
Here:
69%
State:
61%
(% for various income ranges: 59.0% for AGIs below $10k, 64.8% for AGIs $10k-25k, 74.0% for AGIs $25k-50k, 79.2% for AGIs $50k-75k, 75.8% for AGIs $75k-100k, 84.2% for AGIs over 100k)
Likely homosexual households (counted as self-reported same-sex unmarried-partner households)
Lesbian couples: 1.0% of all households
Gay men: 0.2% of all households
Household received Food Stamps/SNAP in the past 12 months: 101 Household did not receive Food Stamps/SNAP in the past 12 months: 818
Women who had a birth in the past 12 months: 22 (0 now married, 22 unmarried) Women who did not have a birth in the past 12 months: 275 (138 now married, 136 unmarried)
Housing units in zip code 61469 with a mortgage: 377 (15 second mortgage, 12 both second mortgage and home equity loan) Median monthly owner costs for units with a mortgage: $846 Median monthly owner costs for units without a mortgage: $395
Residents with income below the poverty level in 2022:
This zip code:
12.8%
Whole state:
11.9%
Residents with income below 50% of the poverty level in 2022:
This zip code:
8.7%
Whole state:
5.7%
Median number of rooms in houses and condos:
Here:
5.5
State:
6.4
Median number of rooms in apartments:
Here:
3.5
State:
4.1
Notable locations in this zip code not listed on our city pages
Notable locations in zip code 61469: Sunset Picnic Area (A), Sands Picnic Area (B), Little Deer Picnic Area (C), Great Oaks Picnic Area (D), North Henderson County Ambulance Service - Oquawka (E), Oquawka Fire Department (F). Display/hide their locations on the map
In group quarters: 16 (-1 institutionalized population)
Size of family households: 363 2-persons, 95 3-persons, 64 4-persons, 41 5-persons, 9 7-or-more-persons
Size of nonfamily households: 299 1-person, 53 2-persons
106 married couples with children.
113 single-parent households (36 men, 77 women).
99.0% of residents of 61469 zip code speak English at home.
1.3% of residents speak Spanish at home (96% very well, 4% well).
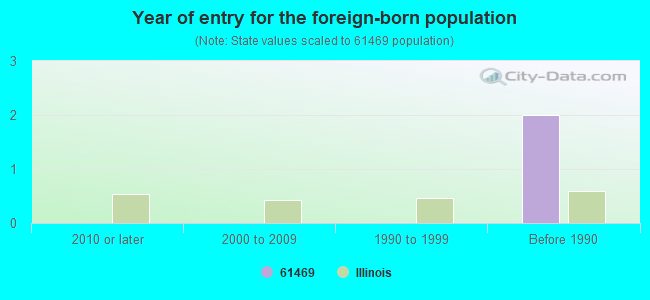
Foreign born population: 0 (0.0%)
:
0.0%
Whole state:
14.4%
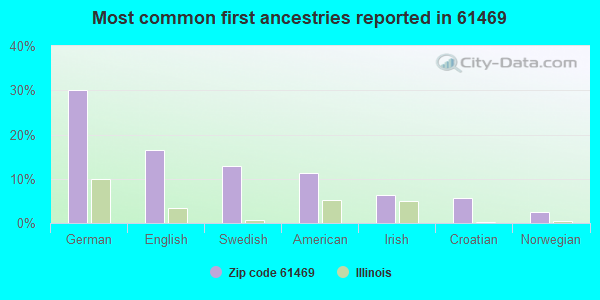
30%German
16%English
13%Swedish
11%American
6%Irish
6%Croatian
2%Norwegian
Year of entry for the foreign-born population
02010 or later
02000 to 2009
01990 to 1999
2Before 1990
Facilities with environmental interests located in this zip code:
CONSOLIDATED GRAIN & BARGE (SOUTH END OF FRONT ST in OQUAWKA, IL)
STATE MASTER (Illinois EPA Project) - AIR PROGRAM AIR MINOR (AIRS/AFS) CRITERIA AND HAZARDOUS AIR POLLUTANT INVENTORY (Inventory of air pollution sources) Business SIC classification: GRAIN AND FIELD BEANS Alternative names: ALTAIR TRADING CORPORATION, CONSOLIDATED GRAIN & BARGE CO.
WARECO 571 (EIGHTH & SCHUYLER in OQUAWKA, IL)
STATE MASTER (Illinois EPA Project) - HAZARDOUS WASTE PROGRAM Conditionally Exempt Small Quantity Generators, less than 100 kg/month of hazardous waste (Resource Conservation and Recovery Act (tracking hazardous waste)) - notification Organizations: WARE KLUMP OIL CO (CONTACT/OWNER)
Alternative names: WARECO SERV STA #571
STOCK LAND FS INCORPORATED (RURAL ROUTE 1 in OQUAWKA, IL)
AIR MINOR (AIRS/AFS) ENFORCEMENT/COMPLIANCE ACTIVITY (Integrated Compliance Information System) CRITERIA AND HAZARDOUS AIR POLLUTANT INVENTORY (Inventory of air pollution sources) Business SIC classification: FARM SUPPLIES Alternative names: RIVERLAND FS INC.
STOCK LAND FS INC (RR 1 in OQUAWKA, IL)
(Resource Conservation and Recovery Act (tracking hazardous waste))
Housing units lacking complete plumbing facilities: 4.2% Housing units lacking complete kitchen facilities: 2.7%
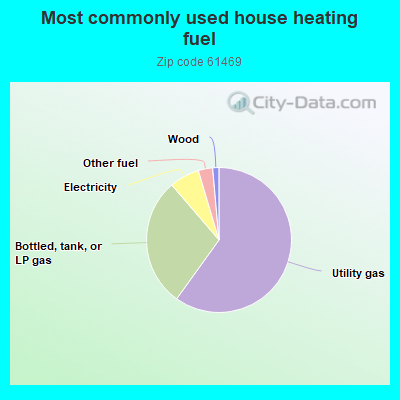
60.0%Utility gas
28.8%Bottled, tank, or LP gas
6.7%Electricity
3.2%Other fuel
1.4%Wood
Population in 1990: 2,410. Population change in the 1990s: +67 (+2.8%).
Place of birth for U.S.-born residents:
This state: 1,071
Northeast: 1
Midwest: 746
South: 48
West: 34
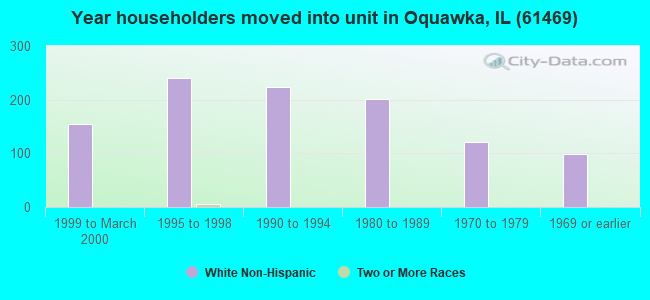
65% of the 61469 zip code residents lived in the same house 5 years ago. Out of people who lived in different houses, 57% lived in this county. Out of people who lived in different counties, 50% lived in Illinois.
92% of the 61469 zip code residents lived in the same house 1 year ago. Out of people who lived in different houses, 20% moved from this county. Out of people who lived in different houses, 51% moved from different county within same state. Out of people who lived in different houses, 33% moved from different state.
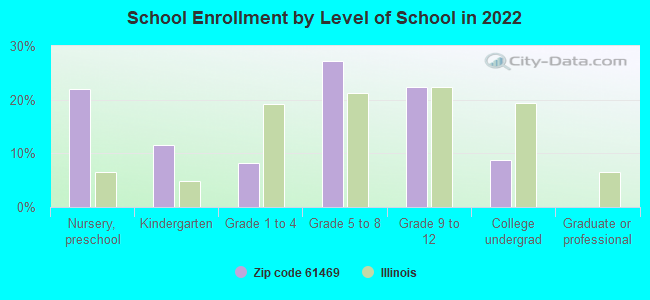
Private vs. public school enrollment:
Students in private schools in grades 1 to 8 (elementary and middle school): 16
Here:
15.2%
Illinois:
13.3%
Students in private schools in grades 9 to 12 (high school): 15
Here:
22.3%
Illinois:
9.9%
Students in private undergraduate colleges: 12
Here:
43.7%
Illinois:
27.4%
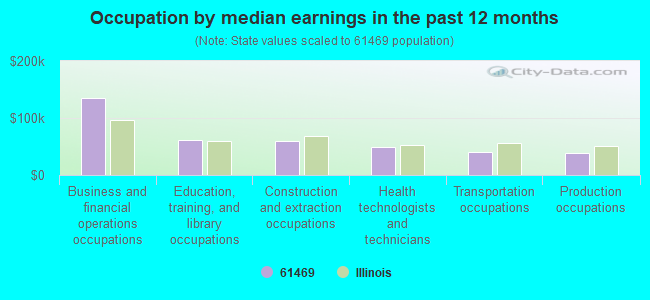
Occupation by median earnings in the past 12 months ($)
134,312Business and financial operations occupations
61,712Education, training, and library occupations
59,864Construction and extraction occupations
48,744Health technologists and technicians
40,405Transportation occupations
38,282Production occupations
Top industries in this zip code by the number of employees in 2005:
Health Care and Social Assistance: Offices of Physicians (except Mental Health Specialists) (20-49 employees: 1 establishment)
Accommodation and Food Services: Full-Service Restaurants (10-19: 1, 1-4: 3)
Construction: Power and Communication Line and Related Structures Construction (10-19: 1, 1-4: 1)
Finance and Insurance: Commercial Banking (10-19: 1)
Wholesale Trade: Metal Service Centers and Other Metal Merchant Wholesalers (10-19: 1)
Accommodation and Food Services: Drinking Places (Alcoholic Beverages) (1-4: 3)
Accommodation and Food Services: Limited-Service Restaurants (1-4: 2)
People in group quarters in 2000:
13 people in other noninstitutional group quarters
8 people in local jails and other confinement facilities (including police lockups)
2003 - 2018 National Fire Incident Reporting System (NFIRS) incidents
According to the data from the years 2003 - 2018 the average number of fires per year is 15. The highest number of fires - 38 took place in 2011, and the least - 3 in 2017. The data has a dropping trend.
When looking into fire subcategories, the most incidents belonged to: Outside Fires (43.8%), and Structure Fires (33.2%).
Fire incident types reported to NFIRS in Zip Code 61469
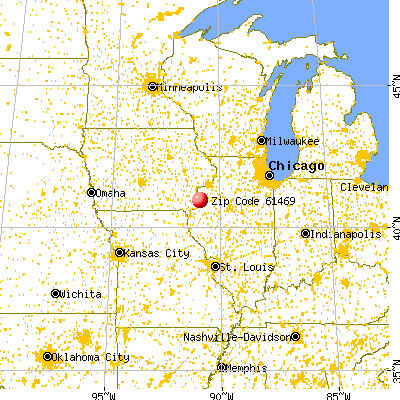


 Nearest zip codes: 61418, 61437, 52646, 61442, 61453, 61476.


 According to the data from the years 2003 - 2018 the average number of fires per year is 15. The highest number of fires - 38 took place in 2011, and the least - 3 in 2017. The data has a dropping trend.
 When looking into fire subcategories, the most incidents belonged to: Outside Fires (43.8%), and Structure Fires (33.2%).