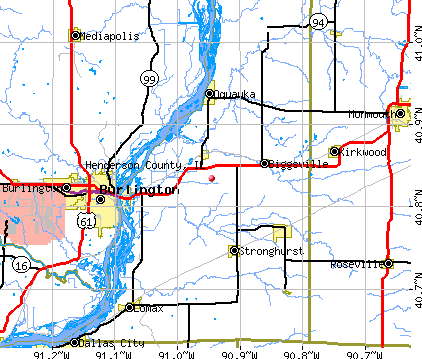
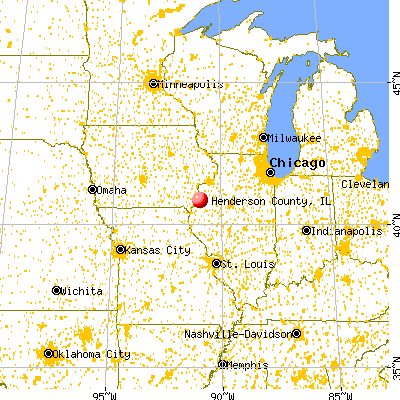
Henderson County, Illinois (IL)
County owner-occupied free and clear houses and condos in 2010: 1,239
County owner-occupied houses and condos in 2000: 2,654
Renter-occupied apartments: 619 (it was 711 in 2000)
| % of renters here: | 21% |
| State: | 33% |
Land area: 379 sq. mi.
Water area: 16.3 sq. mi.
Population density: 17 people per square mile (low).
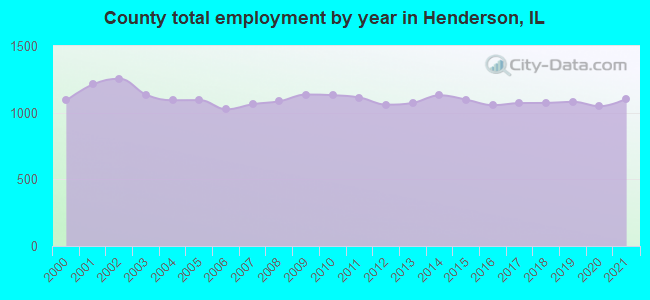
Industries providing employment: Educational, health and social services (19.9%), Manufacturing (17.2%), Retail trade (11.7%), Agriculture,forestry,fishing and hunting, and mining (10.9%).
Type of workers:
- Private wage or salary: 76%
- Government: 14%
- Self-employed, not incorporated: 10%
- Unpaid family work: 0%
- OSM Map
- General Map
- Google Map
- MSN Map

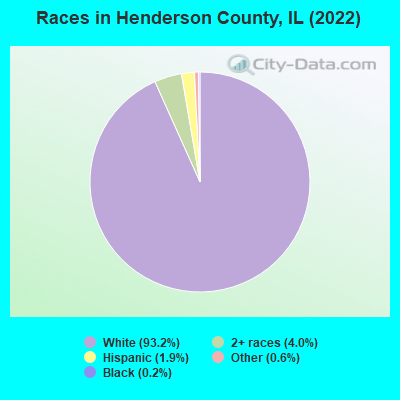
- 5,81793.2%White Non-Hispanic Alone
- 2524.0%Two or more races
- 1211.9%Hispanic or Latino
- 390.6%Some other race alone
- 100.2%Black Non-Hispanic Alone
- 20.03%American Indian and Alaska Native alone
| Median resident age: | 50.1 years |
| Illinois median age: | 39.1 years |
| Males: 3,151 | |
| Females: 3,135 |

| Henderson County: | 2.0 people |
| Illinois: | 3 people |
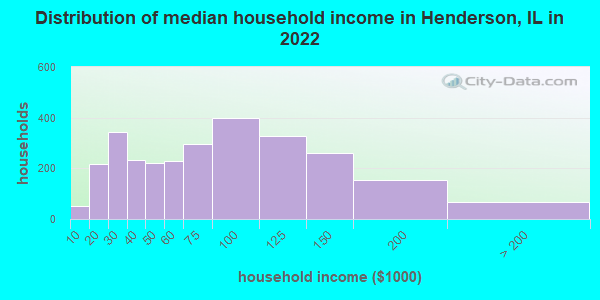
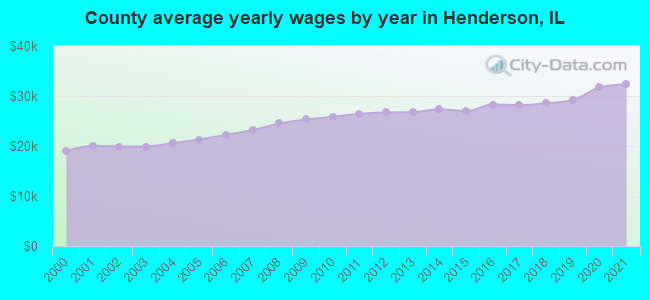
Estimated median household income in 2022: $63,517 ($36,405 in 1999)
| This county: | $63,517 |
| Illinois: | $76,708 |
Median contract rent in 2022 for apartments: $523 (lower quartile is $420, upper quartile is $645)
| This county: | $523 |
| State: | $1008 |
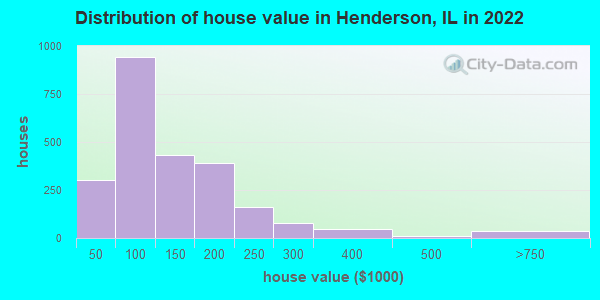
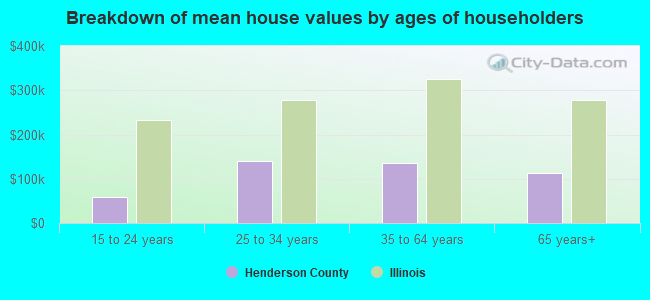
Estimated median house or condo value in 2022: $105,017 (it was $53,500 in 2000)
| Henderson: | $105,017 |
| Illinois: | $251,600 |
Mean price in 2022:
Median monthly housing costs for homes and condos with a mortgage: $1,074Detached houses: $140,671
Here: $140,671 State: $310,164 Townhouses or other attached units: $135,639
Here: $135,639 State: $286,230 Mobile homes: $69,732
Here: $69,732 State: $78,855
Median monthly housing costs for units without a mortgage: $438
Institutionalized population: 51
Crime in 2013 (reported by the sheriff's office or county police, not the county total):
- Murders: 0
- Rapes: 0
- Robberies: 0
- Assaults: 0
- Burglaries: 0
- Thefts: 2
- Auto thefts: 0
Crime in 2012 (reported by the sheriff's office or county police, not the county total):
- Murders: 0
- Rapes: 0
- Robberies: 1
- Assaults: 31
- Burglaries: 56
- Thefts: 85
- Auto thefts: 0
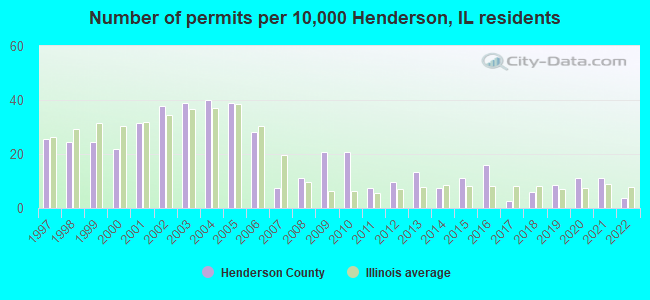
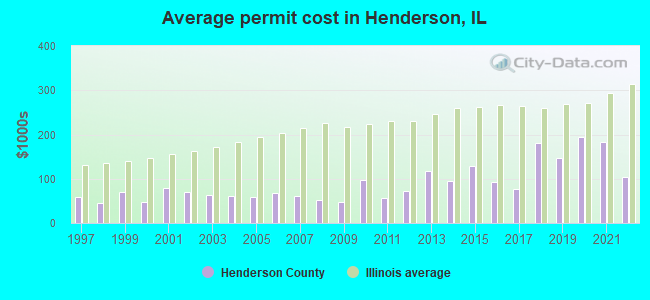
Single-family new house construction building permits:
- 2022: 3 buildings, average cost: $103,300
- 2021: 9 buildings, average cost: $182,900
- 2020: 9 buildings, average cost: $195,100
- 2019: 7 buildings, average cost: $146,400
- 2018: 5 buildings, average cost: $180,800
- 2017: 2 buildings, average cost: $76,000
- 2016: 13 buildings, average cost: $93,100
- 2015: 9 buildings, average cost: $129,000
- 2014: 6 buildings, average cost: $94,000
- 2013: 11 buildings, average cost: $118,100
- 2012: 8 buildings, average cost: $72,400
- 2011: 6 buildings, average cost: $55,700
- 2010: 17 buildings, average cost: $97,600
- 2009: 17 buildings, average cost: $46,700
- 2008: 9 buildings, average cost: $53,000
- 2007: 6 buildings, average cost: $60,500
- 2006: 23 buildings, average cost: $66,700
- 2005: 32 buildings, average cost: $58,900
- 2004: 33 buildings, average cost: $60,900
- 2003: 32 buildings, average cost: $63,000
- 2002: 31 buildings, average cost: $69,700
- 2001: 26 buildings, average cost: $79,900
- 2000: 18 buildings, average cost: $47,200
- 1999: 20 buildings, average cost: $71,400
- 1998: 20 buildings, average cost: $45,100
- 1997: 21 buildings, average cost: $59,400
Median real estate property taxes paid for housing units with mortgages in 2022: $1,859 (1.5%)
Median real estate property taxes paid for housing units with no mortgage in 2022: $1,585 (1.7%)

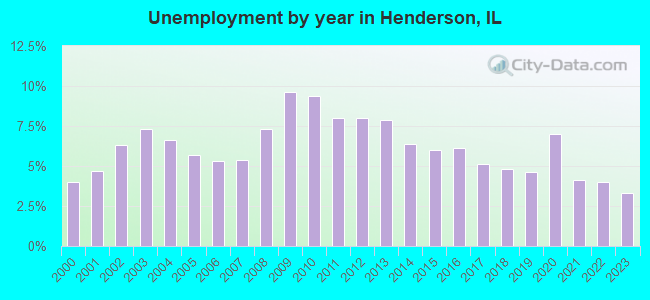
| Henderson County: | 9.2% |
| Illinois: | 11.9% |
Median age of residents in 2022: 50.1 years old
(Males: 47.8 years old, Females: 51.9 years old)
(Median age for: White residents: 51.3 years old, Black residents: 35.8 years old, Hispanic or Latino residents: 17.0 years old, Other race residents: 35.5 years old)
Fair market rent in 2006 for a 1-bedroom apartment in Henderson County is $397 a month.
Fair market rent for a 2-bedroom apartment is $492 a month.
Fair market rent for a 3-bedroom apartment is $621 a month.
Cities in this county include: Oquawka, Stronghurst, Lomax, Biggsville, Gladstone, Gulf Port, Raritan, Media.
Notable locations in this county outside city limits:
Notable locations in Henderson County: Monmouth Country Club (A), Jacksons Corners (B), Twin Bridges (C), Boston Corners (D), Swan Hills Country Club (E), Henderson Grove Grange (F), Point Pleasant Townhall (G), Greenbush Townhall (H), Abingdon Fire Protection District Station 2 (I), Cameron Fire Department (J). Display/hide their locations on the map
Churches in Henderson County include: Fairview Center Church (A), Sugar Tree Grove Church (B). Display/hide their locations on the map
Cemeteries: Asbury Cemetery (1), Bond Cemetery (2), Cedar Creek Cemetery (3), Spring Grove Cemetery (4), Holeman Cemetery (5), McMahill Cemetery (6), Roseville Memorial Cemetery (7). Display/hide their locations on the map
Reservoirs: Glass Lake (A), Paul Lake (B), Roney Lake (C), Lake Warren (D), Youngquist Lake (E), Clyde Young Lake (F), Little Swan Lake (G), Youngs Lake (H). Display/hide their locations on the map
Streams, rivers, and creeks: Slug Run (A), Cedar Fork (B), Middle Henderson Creek (C), Duck Creek (D), Little Swan Creek (E), Davids Creek (F), South Henderson Creek (G), Latimer Creek (H), Johns Creek (I). Display/hide their locations on the map
Parks in Henderson County include: Massasauga Prairie Nature Preserve (1), Spring Grove Cemetery Prairie Nature Preserve (2). Display/hide their locations on the map
Neighboring counties: Davis County, Utah  , Cambria County, Pennsylvania
  , Des Moines County, Iowa , Hancock County
  , Portage County, Ohio .
| Here: | 3.3% |
| Illinois: | 4.2% |
Current college students: 278
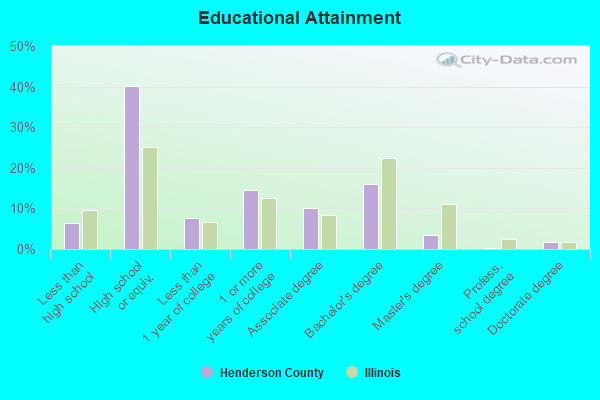
People 25 years of age or older with a high school degree or higher: 93.0%
People 25 years of age or older with a bachelor's degree or higher: 20.7%
Number of foreign born residents: 31 (58.3% naturalized citizens)
| Henderson County: | 0.5% |
| Whole state: | 14.4% |
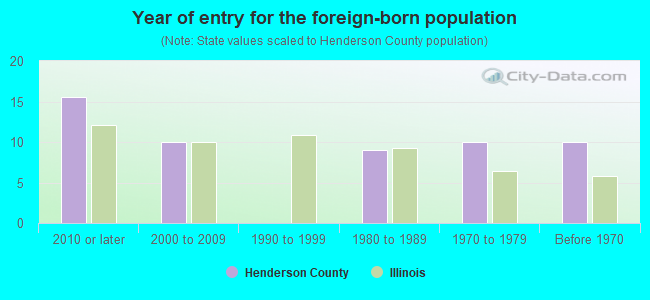
- Year of entry for the foreign-born population
- 162010 or later
- 102000 to 2009
- 01990 to 1999
- 91980 to 1989
- 101970 to 1979
- 10Before 1970
Mean travel time to work (commute): minutes
Percentage of county residents living and working in this county: 51.8%


Housing units in structures:
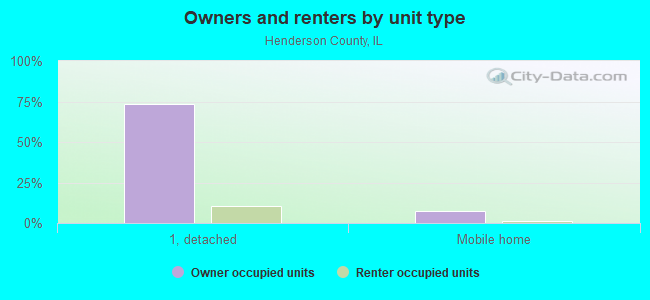
- One, detached: 2,957
- One, attached: 4
- Two: 16
- 3 or 4: 40
- 5 to 9: 4
- 20 or more: 22
- Mobile homes: 327
Housing units in Henderson County with a mortgage: 1,056 (46 second mortgage, 0 home equity loan, 24 both second mortgage and home equity loan)
Houses without a mortgage: 1
| Here: | 50.0% with mortgage |
| State: | 97.4% with mortgage |
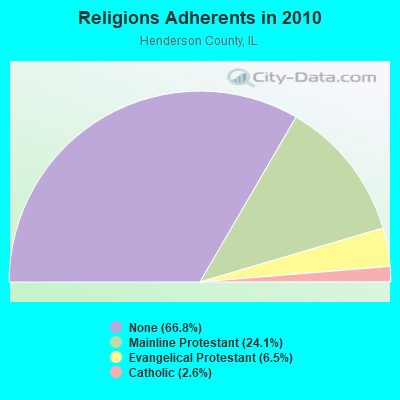
Religion statistics for Henderson County
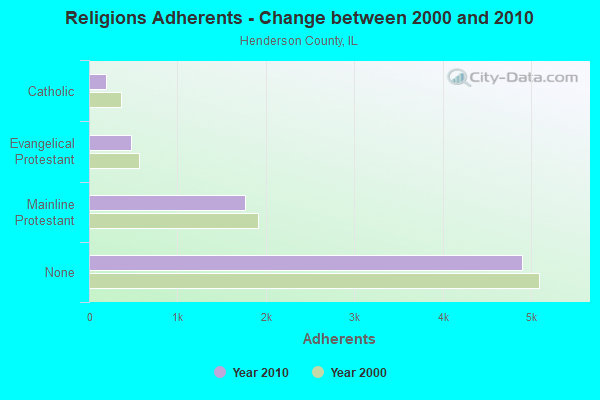
| Religion | Adherents | Congregations |
|---|---|---|
| Mainline Protestant | 1,767 | 13 |
| Evangelical Protestant | 479 | 4 |
| Catholic | 190 | 1 |
| Other | 1 | - |
| None | 4,894 | - |
Source: Clifford Grammich, Kirk Hadaway, Richard Houseal, Dale E.Jones, Alexei Krindatch, Richie Stanley and Richard H.Taylor. 2012. 2010 U.S.Religion Census: Religious Congregations & Membership Study. Association of Statisticians of American Religious Bodies. Jones, Dale E., et al. 2002. Congregations and Membership in the United States 2000. Nashville, TN: Glenmary Research Center.
Food Environment Statistics:
| Henderson County: | 2.65 / 10,000 pop. |
| State: | 2.24 / 10,000 pop. |
| Henderson County: | 7.94 / 10,000 pop. |
| Illinois: | 2.61 / 10,000 pop. |
| This county: | 5.29 / 10,000 pop. |
| State: | 6.86 / 10,000 pop. |
| Henderson County: | 9.5% |
| Illinois: | 8.3% |
| Henderson County: | 27.6% |
| State: | 25.2% |
| Here: | 11.9% |
| State: | 14.5% |
Agriculture in Henderson County:
Average size of farms: 513 acresAverage value of agricultural products sold per farm: $151,048
Average value of crops sold per acre for harvested cropland: $276.53
The value of livestock, poultry, and their products as a percentage of the total market value of agricultural products sold: 27.42%
Average total farm production expenses per farm: $116,499
Harvested cropland as a percentage of land in farms: 77.25%
Irrigated harvested cropland as a percentage of land in farms: 6.67%
Average market value of all machinery and equipment per farm: $109,419
The percentage of farms operated by a family or individual: 90.05%
Average age of principal farm operators: 55 years
Average number of cattle and calves per 100 acres of all land in farms: 9.91
Corn for grain: 88092 harvested acres
All wheat for grain: 577 harvested acres
Soybeans for beans: 59567 harvested acres
Vegetables: 750 harvested acres
Land in orchards: 63 acres
Tornado activity:
Henderson County historical area-adjusted tornado activity is significantly below Illinois state average. It is 2795136.3 times below overall U.S. average.Tornadoes in this county have caused one fatality and 4 injuries recorded between 1950 and 2004.
On 9/26/1959, a category 2 (max. wind speeds 113-157 mph) tornado killed one person and caused between $50,000 and $500,000 in damages.
Earthquake activity:
Henderson County-area historical earthquake activity is significantly above Illinois state average. It is 170% greater than the overall U.S. average.On 4/18/2008 at 09:36:59, a magnitude 5.4 (5.1 MB, 4.8 MS, 5.4 MW, 5.2 MW, Class: Moderate, Intensity: VI - VII) earthquake occurred 231.7 miles away from Henderson County center
On 4/18/2008 at 09:36:59, a magnitude 5.2 (5.2 MW, Depth: 8.9 mi) earthquake occurred 231.7 miles away from the county center
On 6/10/1987 at 23:48:54, a magnitude 5.1 (4.9 MB, 4.4 MS, 4.6 MS, 5.1 LG) earthquake occurred 214.0 miles away from the county center
On 6/18/2002 at 17:37:15, a magnitude 5.0 (4.3 MB, 4.6 MW, 5.0 LG) earthquake occurred 259.6 miles away from the county center
On 9/26/1990 at 13:18:51, a magnitude 5.0 (4.7 MB, 4.8 LG, 5.0 LG, Depth: 7.7 mi) earthquake occurred 264.7 miles away from Henderson County center
On 6/28/2004 at 06:10:52, a magnitude 4.2 (4.2 MW, Depth: 6.2 mi, Class: Light, Intensity: IV - V) earthquake occurred 115.1 miles away from the county center
Magnitude types: regional Lg-wave magnitude (LG), body-wave magnitude (MB), surface-wave magnitude (MS), moment magnitude (MW)
Most recent natural disasters:
- Illinois Covid-19 Pandemic, Incident Period: January 20, 2020, FEMA Id: 4489, Natural disaster type: Other
- Illinois Severe Storms And Flooding, Incident Period: February 24, 2019 - July 3, 2019, FEMA Id: 4461, Natural disaster type: Storm, Flood
- Illinois Severe Storms, Straight-Line Winds and Flooding, Incident Period: April 16, 2013 to May 05, 2013, Major Disaster (Presidential) Declared DR-4116: May 10, 2013, FEMA Id: 4116, Natural disaster type: Storm, Flood, Wind
- Illinois Severe Winter Storm and Snowstorm, Incident Period: January 31, 2011 to February 03, 2011, Major Disaster (Presidential) Declared DR-1960: March 17, 2011, FEMA Id: 1960, Natural disaster type: Snowstorm, Winter Storm
- Illinois Severe Storms and Flooding, Incident Period: June 01, 2008 to July 22, 2008, Major Disaster (Presidential) Declared DR-1771: June 24, 2008, FEMA Id: 1771, Natural disaster type: Storm, Flood
- Illinois Hurricane Katrina Evacuation, Incident Period: August 29, 2005 to October 01, 2005, Emergency Declared EM-3230: September 07, 2005, FEMA Id: 3230, Natural disaster type: Hurricane
- Illinois Flooding, Incident Period: April 18, 2001 to May 29, 2001, Major Disaster (Presidential) Declared DR-1368: May 09, 2001, FEMA Id: 1368, Natural disaster type: Flood
- Illinois Severe Winter Storm, Incident Period: December 11, 2000 to December 31, 2000, Emergency Declared EM-3161: January 17, 2001, FEMA Id: 3161, Natural disaster type: Winter Storm
- Illinois Winter Snow Storm, Incident Period: January 01, 1999 to January 15, 1999, Emergency Declared EM-3134: January 08, 1999, FEMA Id: 3134, Natural disaster type: Storm, Snow
- Illinois Flooding, Severe Storms, Incident Period: April 13, 1993 to October 22, 1993, Major Disaster (Presidential) Declared DR-997: July 09, 1993, FEMA Id: 997, Natural disaster type: Storm, Flood
- 5 other natural disasters have been reported since 1953.
The number of natural disasters in Henderson County (15) is near the US average (15).
Major Disasters (Presidential) Declared: 10
Emergencies Declared: 3
Causes of natural disasters: Floods: 10, Storms: 8, Winter Storms: 2, Heavy Rain: 1, Hurricane: 1, Snow: 1, Snowstorm: 1, Tornado: 1, Wind: 1, Other: 1 (Note: some incidents may be assigned to more than one category).
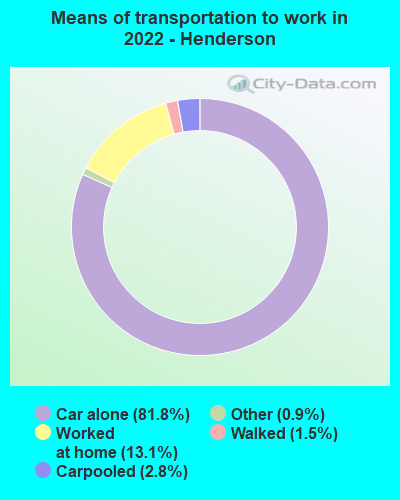
Means of transportation to work:
- Drove a car alone: 974 (78.8%)
- Carpooled: 35 (2.8%)
- Taxicab, motorcycle, or other means: 11 (0.9%)
- Walked: 17 (1.4%)
- Worked at home: 211 (17.1%)

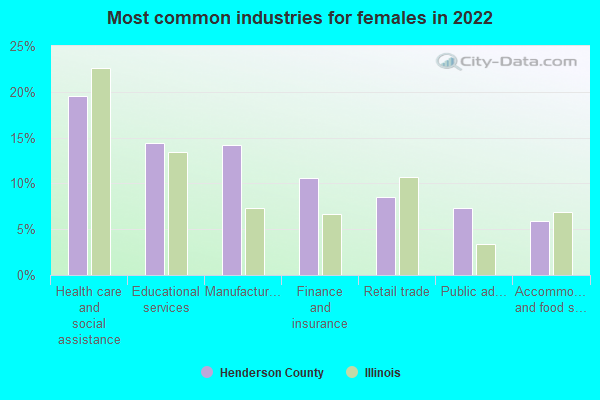
- Health care and social assistance (17%)
- Educational services (13%)
- Manufacturing (13%)
- Finance and insurance (9%)
- Retail trade (8%)
- Public administration (6%)
- Accommodation and food services (5%)
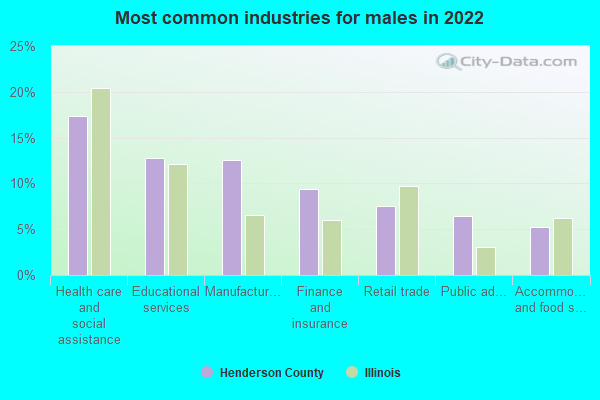
- Health care and social assistance (20%)
- Educational services (14%)
- Manufacturing (14%)
- Finance and insurance (11%)
- Retail trade (9%)
- Public administration (7%)
- Accommodation and food services (6%)
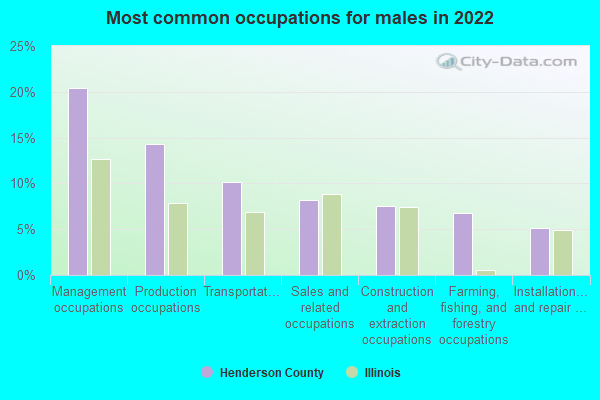
- Management occupations (20%)
- Production occupations (14%)
- Transportation occupations (10%)
- Sales and related occupations (8%)
- Construction and extraction occupations (7%)
- Farming, fishing, and forestry occupations (7%)
- Installation, maintenance, and repair occupations (5%)
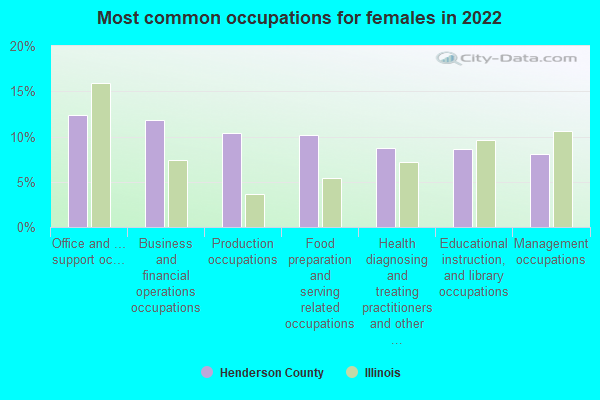
- Office and administrative support occupations (12%)
- Business and financial operations occupations (12%)
- Production occupations (10%)
- Food preparation and serving related occupations (10%)
- Health diagnosing and treating practitioners and other technical occupations (9%)
- Educational instruction, and library occupations (9%)
- Management occupations (8%)

- Turkey (65%)
- Germany (23%)
- Mexico (13%)
- Norway (0%)
- Sweden (0%)
- United Kingdom, excluding England and Scotland (0%)
- England (0%)
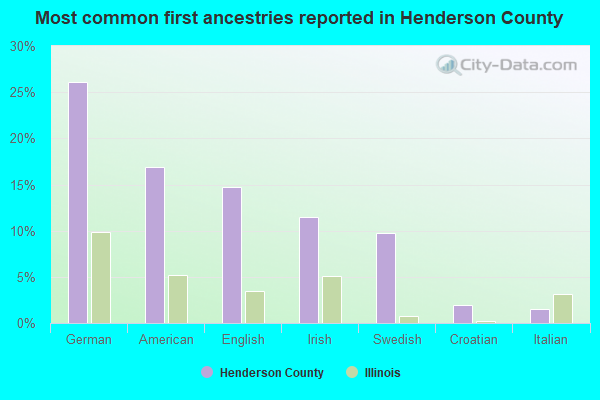
- German (26%)
- American (17%)
- English (15%)
- Irish (11%)
- Swedish (10%)
- Croatian (2%)
- Italian (2%)
People in group quarters in Henderson County, Illinois in 2000:
- 56 people in nursing homes
- 13 people in other noninstitutional group quarters
- 8 people in local jails and other confinement facilities (including police lockups)
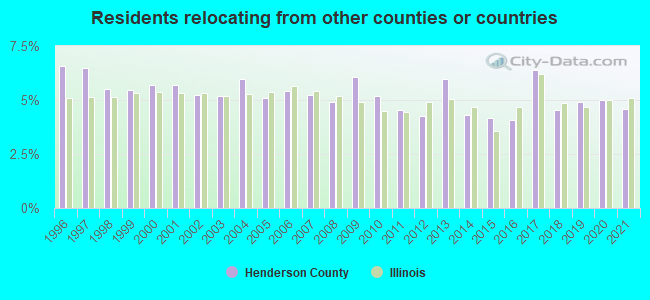
4.58% of this county's 2021 resident taxpayers lived in other counties in 2020 ($34,591 average adjusted gross income)
| Here: | 4.58% |
| Illinois average: | 5.09% |
10 or fewer of this county's residents moved from foreign countries.
2.55% relocated from other counties in Illinois ($20,122 average AGI)
2.03% relocated from other states ($14,470 average AGI)
Henderson County: 2.03% Illinois average: 2.01%
Top counties from which taxpayers relocated into this county between 2020 and 2021:
| from Des Moines County, IA | |
| from Warren County, IL |
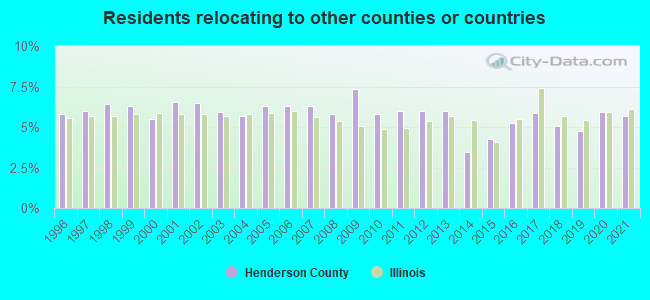
5.67% of this county's 2020 resident taxpayers moved to other counties in 2021 ($56,431 average adjusted gross income)
| Here: | 5.67% |
| Illinois average: | 6.10% |
10 or fewer of this county's residents moved to foreign countries.
2.60% relocated to other counties in Illinois ($26,194 average AGI)
3.07% relocated to other states ($30,243 average AGI)
Henderson County: 3.07% Illinois average: 3.06%
Top counties to which taxpayers relocated from this county between 2020 and 2021:
| to Des Moines County, IA | |
| to Warren County, IL |
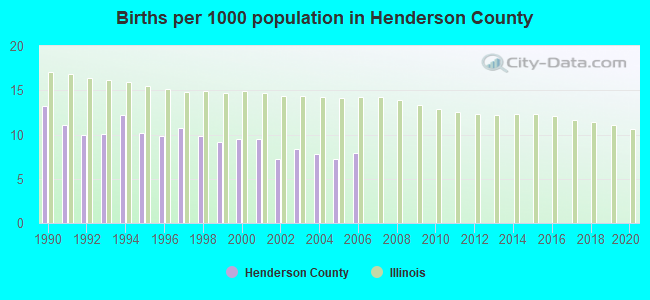
Births per 1000 population from 1990 to 1999: 10.6
Births per 1000 population from 2000 to 2006: 8.2
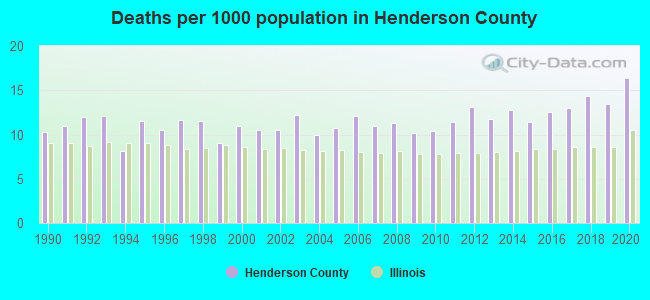
Deaths per 1000 population from 1990 to 1999: 10.8
Deaths per 1000 population from 2000 to 2009: 10.9
Deaths per 1000 population from 2010 to 2020: 12.8
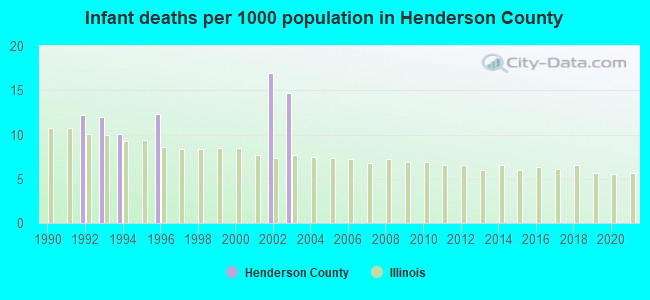
Infant deaths per 1000 live births from 1990 to 1999: 4.7
Infant deaths per 1000 live births from 2000 to 2006: 4.5
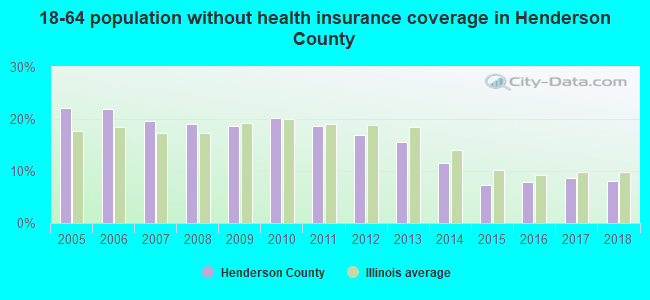
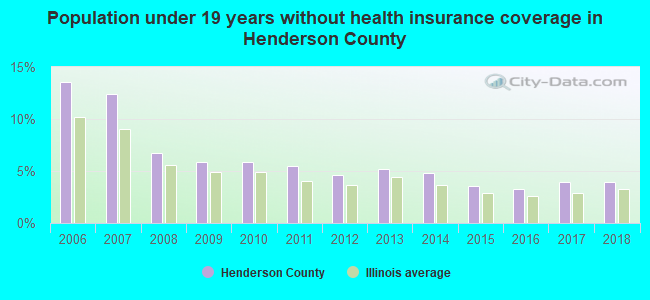
Persons under 19 years old without health insurance coverage in 2018: 3.9%
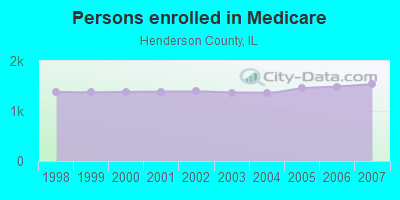
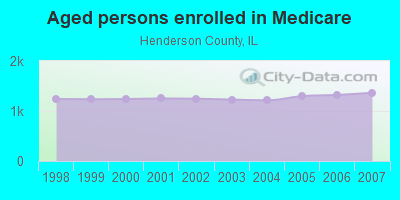
Persons enrolled in hospital insurance and/or supplemental medical insurance (Medicare) in July 1, 2007: 1,537 (1,364 aged, 173 disabled)
Children under 18 without health insurance coverage in 2007: 95 (6%)

Most common underlying causes of death in Henderson County, Illinois in 1999 - 2019:
- Acute myocardial infarction, unspecified (98)
- Atherosclerotic heart disease (72)
- Bronchus or lung, unspecified - Malignant neoplasms (30)
- Chronic obstructive pulmonary disease, unspecified (21)
- Stroke, not specified as haemorrhage or infarction (21)
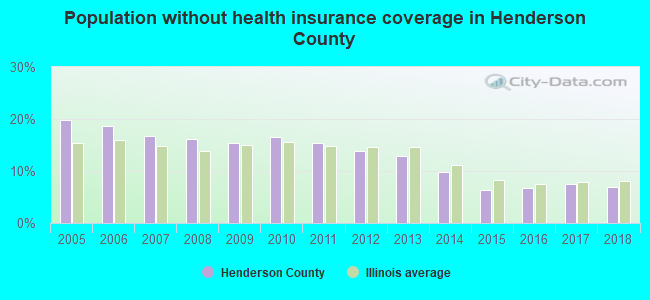
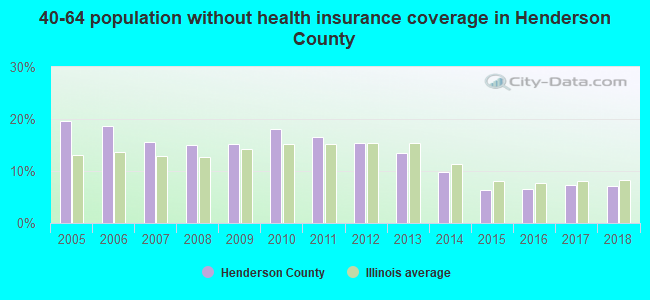
Population without health insurance coverage in 2000: 12%
Children under 18 without health insurance coverage in 2000: 11%
Medical specialist MDs per 100,000 population in 2005: 1,104
Dentists per 100,000 population in 1998: 13
Total births per 100,000 population, July 2005 - July 2006 : 12
Total deaths per 100,000 population, July 2005 - July 2006: 38
Limited-service eating places per 100,000 population in 2005 : 13
Household type by relationship:
Households: 6,286- Male householders: 1,465 (364 living alone), Female householders: 1,324 (438 living alone)
1,501 spouses (1,464 opposite-sex spouses), 248 unmarried partners, (245 opposite-sex unmarried partners), 1,406 children (1,241 natural, 10 adopted, 158 stepchildren), 102 grandchildren, 20 brothers or sisters, 49 parents, 0 foster children, 91 other relatives, 61 non-relatives
- In group quarters: 58
Size of family households: 1,094 2-persons, 303 3-persons, 276 4-persons, 118 5-persons, 40 6-persons, 20 7-or-more-persons.
Size of nonfamily households: 802 1-person, 138 2-persons.
733 married couples with children.
279 single-parent households (49 men, 230 women).
98.8% of residents of Henderson speak English at home.
0.6% of residents speak Spanish at home (82% speak English very well, 18% speak English well).
0.3% of residents speak Asian or Pacific Island language at home (65% speak English very well, 35% speak English not well).
0.3% of residents speak other language at home (100% speak English very well).
In fiscal year 2004:
Federal Government expenditure: $49,027,000 ($6,093 per capita)
Department of Defense expenditure: $929,000
Federal direct payments to individuals for retirement and disability: $20,455,000
Federal other direct payments to individuals: $8,625,000
Federal direct payments not to individuals: $10,991,000
Federal grants: $6,324,000
Federal procurement contracts: $481,000 ($34,000 Department of Defense)
Federal salaries and wages: $2,151,000 ($371,000 Department of Defense)
Federal Government direct loans: $447,000
Federal guaranteed/insured loans: $1,806,000
Federal Government insurance: $38,966,000
Population change from April 1, 2000 to July 1, 2005:
Births: 360| Here: | 45 per 1000 residents |
| State: | 75 per 1000 residents |
Deaths: 471
| Here: | 59 per 1000 residents |
| State: | 43 per 1000 residents |
Net international migration: -4
| Here: | |
| State: |
Net internal migration: -113
| Here: | |
| State: |
Total withdrawal of fresh water for public supply: 6.19 millions of gallons per day (all from ground)
| Here: | 6.0 |
| State: | 6.4 |
| Here: | 5.0 |
| State: | 4.1 |
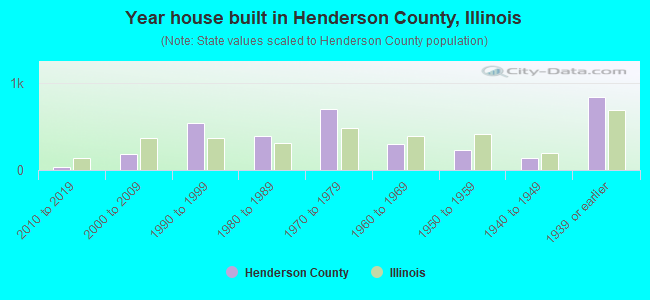
- Year house built in Henderson County, Illinois
- 22020 or later
- 392010 to 2019
- 1822000 to 2009
- 5351990 to 1999
- 3901980 to 1989
- 7011970 to 1979
- 2941960 to 1969
- 2291950 to 1959
- 1331940 to 1949
- 8321939 or earlier
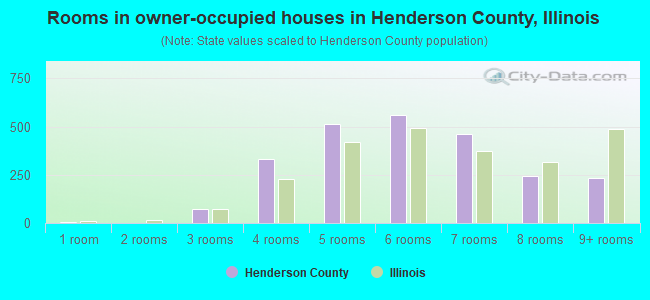
- Rooms in owner-occupied houses in Henderson County, Illinois
- 31 room
- 02 rooms
- 713 rooms
- 3324 rooms
- 5145 rooms
- 5616 rooms
- 4627 rooms
- 2428 rooms
- 2319+ rooms
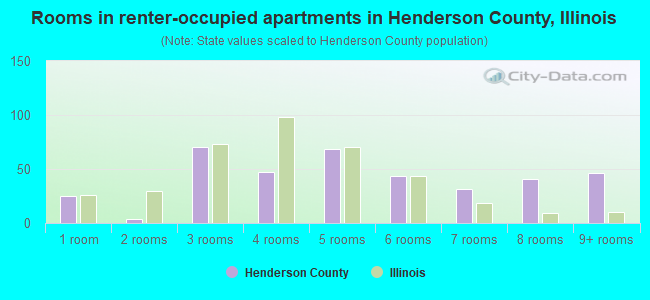
- Rooms in renter-occupied apartments in Henderson County, Illinois
- 251 room
- 32 rooms
- 713 rooms
- 474 rooms
- 685 rooms
- 446 rooms
- 327 rooms
- 418 rooms
- 469+ rooms
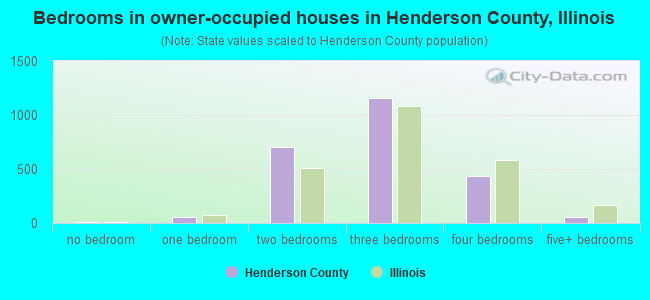
- Bedrooms in owner-occupied houses in Henderson County, Illinois
- 6no bedroom
- 561 bedroom
- 7072 bedrooms
- 1,1533 bedrooms
- 4384 bedrooms
- 585+ bedrooms
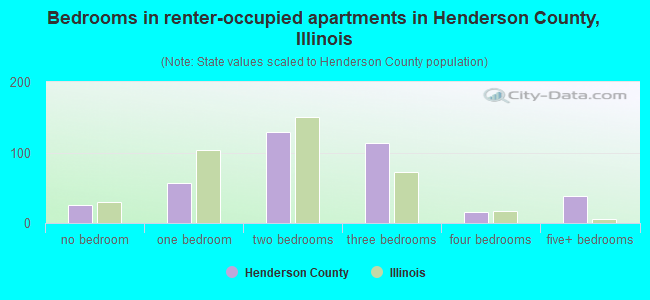
- Bedrooms in renter-occupied apartments in Henderson County, Illinois
- 25no bedroom
- 571 bedroom
- 1292 bedrooms
- 1143 bedrooms
- 164 bedrooms
- 395+ bedrooms
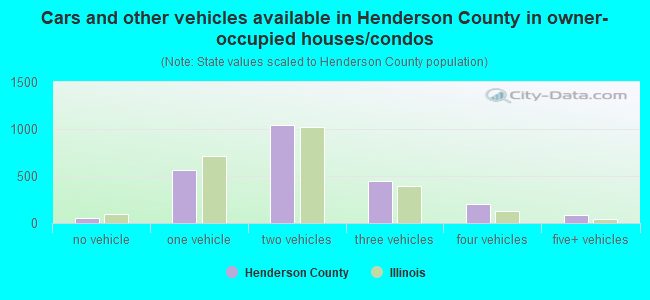
- Cars and other vehicles available in Henderson County in owner-occupied houses/condos
- 58no vehicle
- 5691 vehicle
- 1,0472 vehicles
- 4473 vehicles
- 2014 vehicles
- 895+ vehicles
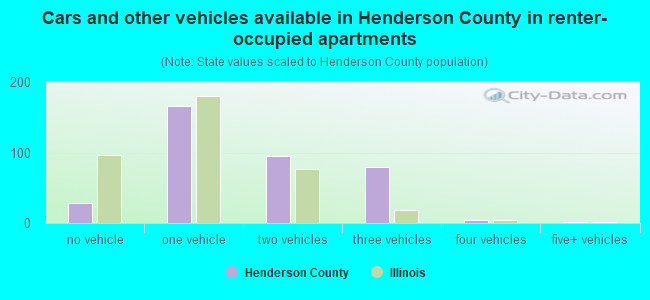
- Cars and other vehicles available in Henderson County in renter-occupied apartments
- 29no vehicle
- 1661 vehicle
- 952 vehicles
- 793 vehicles
- 44 vehicles
- 25+ vehicles
94.2% of Henderson County residents lived in the same house 1 years ago.
Out of people who lived in different houses, 23% lived in this county.
Out of people who lived in different counties, 39% lived in Illinois.
| Henderson County: | 94.2% |
| State average: | 88.3% |
Place of birth for U.S.-born residents:
- This state: 3,088
- Other state: 3,146
- Northeast: 30
- Midwest: 2,827
- South: 181
- West: 132
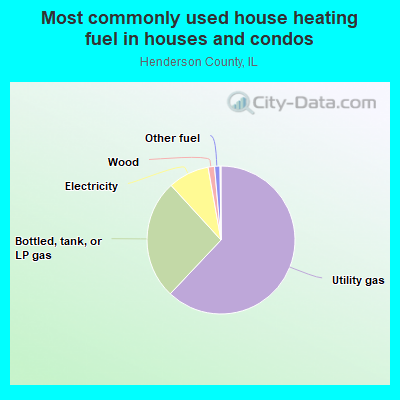
- 62.1%Utility gas
- 26.2%Bottled, tank, or LP gas
- 9.0%Electricity
- 1.4%Wood
- 1.2%Other fuel
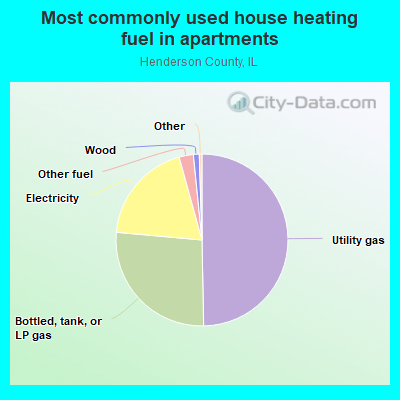
- 50.0%Utility gas
- 26.9%Bottled, tank, or LP gas
- 19.4%Electricity
- 2.7%Other fuel
- 1.1%Wood
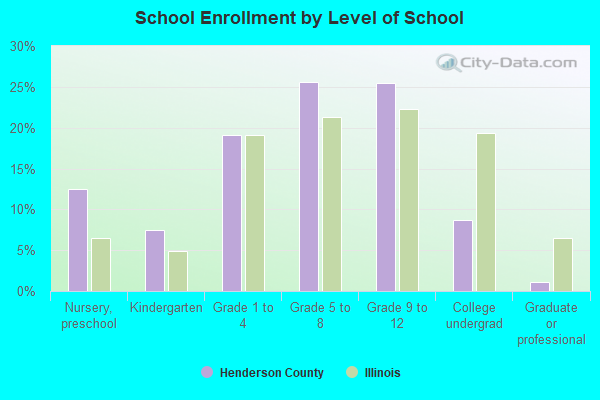
Private vs. public school enrollment:
| Here: | 14.5% |
| Illinois: | 13.3% |
| Here: | 13.0% |
| Illinois: | 9.9% |
| Here: | 12.2% |
| Illinois: | 27.4% |

Henderson County government finances - Expenditure in 2017:
- Charges - Other: $232,000
- Current Operations - Police Protection: $1,239,000
Health - Other: $950,000
General - Other: $923,000
Financial Administration: $709,000
Regular Highways: $707,000
Judicial and Legal Services: $582,000
- Federal Intergovernmental - Health and Hospitals: $851,000
Other: $32,000
- General - Interest on Debt: $13,000
- Long Term Debt - Beginning Outstanding - Unspecified Public Purpose: $295,000
Outstanding Unspecified Public Purpose: $175,000
Retired Unspecified Public Purpose: $120,000
- Miscellaneous - Fines and Forfeits: $478,000
General Revenue - Other: $143,000
Interest Earnings: $11,000
- Other Capital Outlay - Regular Highways: $359,000
Central Staff Services: $43,000
- Other Funds - Cash and Securities: $3,616,000
- State Intergovernmental - Highways: $1,101,000
General Local Government Support: $646,000
Other: $347,000
- Tax - Property: $2,006,000
Other License: $25,000
- Total Salaries and Wages: $2,234,000
Henderson County government finances - Revenue in 2017:
- Charges - Other: $232,000
- Current Operations - Police Protection: $1,239,000
Health - Other: $950,000
General - Other: $923,000
Financial Administration: $709,000
Regular Highways: $707,000
Judicial and Legal Services: $582,000
- Federal Intergovernmental - Health and Hospitals: $851,000
Other: $32,000
- General - Interest on Debt: $13,000
- Long Term Debt - Beginning Outstanding - Unspecified Public Purpose: $295,000
Outstanding Unspecified Public Purpose: $175,000
Retired Unspecified Public Purpose: $120,000
- Miscellaneous - Fines and Forfeits: $478,000
General Revenue - Other: $143,000
Interest Earnings: $11,000
- Other Capital Outlay - Regular Highways: $359,000
Central Staff Services: $43,000
- Other Funds - Cash and Securities: $3,616,000
- State Intergovernmental - Highways: $1,101,000
General Local Government Support: $646,000
Other: $347,000
- Tax - Property: $2,006,000
Other License: $25,000
- Total Salaries and Wages: $2,234,000
Henderson County government finances - Debt in 2017:
- Charges - Other: $232,000
- Current Operations - Police Protection: $1,239,000
Health - Other: $950,000
General - Other: $923,000
Financial Administration: $709,000
Regular Highways: $707,000
Judicial and Legal Services: $582,000
- Federal Intergovernmental - Health and Hospitals: $851,000
Other: $32,000
- General - Interest on Debt: $13,000
- Long Term Debt - Beginning Outstanding - Unspecified Public Purpose: $295,000
Outstanding Unspecified Public Purpose: $175,000
Retired Unspecified Public Purpose: $120,000
- Miscellaneous - Fines and Forfeits: $478,000
General Revenue - Other: $143,000
Interest Earnings: $11,000
- Other Capital Outlay - Regular Highways: $359,000
Central Staff Services: $43,000
- Other Funds - Cash and Securities: $3,616,000
- State Intergovernmental - Highways: $1,101,000
General Local Government Support: $646,000
Other: $347,000
- Tax - Property: $2,006,000
Other License: $25,000
- Total Salaries and Wages: $2,234,000
Henderson County government finances - Cash and Securities in 2017:
- Charges - Other: $232,000
- Current Operations - Police Protection: $1,239,000
Health - Other: $950,000
General - Other: $923,000
Financial Administration: $709,000
Regular Highways: $707,000
Judicial and Legal Services: $582,000
- Federal Intergovernmental - Health and Hospitals: $851,000
Other: $32,000
- General - Interest on Debt: $13,000
- Long Term Debt - Beginning Outstanding - Unspecified Public Purpose: $295,000
Outstanding Unspecified Public Purpose: $175,000
Retired Unspecified Public Purpose: $120,000
- Miscellaneous - Fines and Forfeits: $478,000
General Revenue - Other: $143,000
Interest Earnings: $11,000
- Other Capital Outlay - Regular Highways: $359,000
Central Staff Services: $43,000
- Other Funds - Cash and Securities: $3,616,000
- State Intergovernmental - Highways: $1,101,000
General Local Government Support: $646,000
Other: $347,000
- Tax - Property: $2,006,000
Other License: $25,000
- Total Salaries and Wages: $2,234,000
Supplemental Security Income (SSI) in 2006:
- Total number of recipients: 103
- Number of aged recipients: 4
- Number of blind and disabled recipients: 99
- Number of recipients under 18: 13
- Number of recipients between 18 and 64: 74
- Number of recipients older than 64: 16
- Number of recipients also receiving OASDI: 41
- Amount of payments (thousands of dollars): 45
| Most common first names in Henderson County, IL among deceased individuals | ||
| Name | Count | Lived (average) |
|---|---|---|
| William | 62 | 71.2 years |
| Robert | 60 | 67.1 years |
| John | 56 | 76.4 years |
| Charles | 51 | 77.1 years |
| James | 48 | 74.6 years |
| Mary | 48 | 80.1 years |
| George | 31 | 79.3 years |
| Richard | 28 | 67.0 years |
| Harold | 25 | 75.1 years |
| Clarence | 24 | 78.0 years |
| Most common last names in Henderson County, IL among deceased individuals | ||
| Last name | Count | Lived (average) |
|---|---|---|
| Smith | 43 | 76.7 years |
| Johnson | 36 | 77.4 years |
| Olson | 22 | 74.0 years |
| Peterson | 20 | 80.3 years |
| Anderson | 20 | 77.8 years |
| Stevenson | 19 | 73.6 years |
| Pence | 19 | 74.6 years |
| Cook | 18 | 71.1 years |
| Jones | 15 | 80.2 years |
| Thompson | 14 | 70.4 years |
Businesses in Henderson County, IL
- MasterBrand Cabinets: 2