Estimated zip code population in 2022: 988 Zip code population in 2010: 1,067 Zip code population in 2000: 1,251
Houses and condos: 521 Renter-occupied apartments: 97
% of renters here:
22%
State:
33%
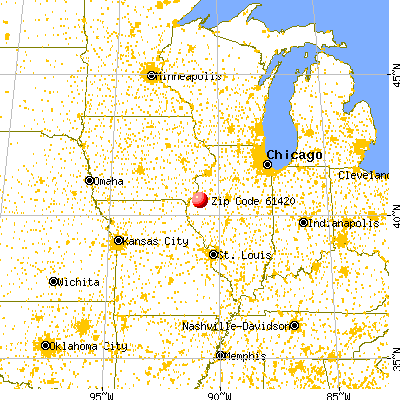
March 2022 cost of living index in zip code 61420: 83.9 (less than average, U.S. average is 100)
Land area: 71.1 sq. mi. Water area: 0.0 sq. mi.
Population density: 14 people per square mile
(very low).
OSM Map
General Map
Google Map
MSN Map
OSM Map
General Map
Google Map
MSN Map
OSM Map
General Map
Google Map
MSN Map
OSM Map
General Map
Google Map
MSN Map
Please wait while loading the map...
Real estate property taxes paid for housing units in 2022:
This zip code:
1.5% ($1,425)
Illinois:
2.0% ($4,912)
Median real estate property taxes paid for housing units with mortgages in 2022: $1,435 (1.4%) Median real estate property taxes paid for housing units with no mortgage in 2022: $1,414 (1.6%)
Business Search- 14 Million verified businesses
Males: 551
(55.8%)
Females: 436
(44.2%)
For population 25 years and over in 61420:
High school or higher: 95.2%
Bachelor's degree or higher: 14.7%
Graduate or professional degree: 2.1%
Unemployed: 1.3%
Mean travel time to work (commute): 24.9 minutes
For population 15 years and over in 61420:
Never married: 22.7%
Now married: 54.1%
Separated: 0.5%
Widowed: 6.7%
Divorced: 16.1%
Zip code 61420 compared to state average:
Median house value significantly below state average.
Unemployed percentage significantly below state average.
Black race population percentage significantly below state average.
Hispanic race population percentage significantly below state average.
Foreign-born population percentage significantly below state average.
Length of stay since moving in significantly above state average.
Number of college students significantly below state average.
Percentage of population with a bachelor's degree or higher significantly below state average.
Averages for the 2020 tax year for zip code 61420, filed in 2021:
Average Adjusted Gross Income (AGI) in 2020: $59,085 (Individual Income Tax Returns)
Here:
$59,085
State:
$82,626
Salary/wage: $43,308 (reported on 75.0% of returns)
Here:
$43,308
State:
$66,640
(% of AGI for various income ranges: 1092.2% for AGIs below $25k, 3329.0% for AGIs $25k-50k, 6328.3% for AGIs $50k-75k, 7437.5% for AGIs $75k-100k, 11267.5% for AGIs $100k-200k)
Taxable interest for individuals: $1,565 (reported on 35.4% of returns)
This zip code:
$1,565
Illinois:
$2,376
(% of AGI for various income ranges: 23.3% for AGIs below $25k, 30.0% for AGIs $25k-50k, 80.0% for AGIs $50k-75k, 90.0% for AGIs $75k-100k, 327.5% for AGIs $100k-200k)
Ordinary dividends: $2,288 (reported on 16.7% of returns)
Here:
$2,288
State:
$9,061
(% of AGI for various income ranges: 20.0% for AGIs below $25k, 98.3% for AGIs $50k-75k, 265.0% for AGIs $100k-200k)
Net capital gain/loss in AGI: +$4,014 (reported on 14.6% of returns)
Here:
+$4,014
State:
+$31,684
(% of AGI for various income ranges: 48.3% for AGIs $50k-75k, 630.0% for AGIs $100k-200k)
Profit/loss from business: +$4,150 (reported on 16.7% of returns)
Here:
+$4,150
State:
+$12,175
(% of AGI for various income ranges: 255.0% for AGIs $25k-50k, 192.5% for AGIs $75k-100k)
Taxable individual retirement arrangement distribution: $6,720 (reported on 10.4% of returns)
61420:
$6,720
Illinois:
$21,613
(% of AGI for various income ranges: 187.0% for AGIs $25k-50k, 372.5% for AGIs $75k-100k)
Earned income credit: $2,286 (reported on 14.6% of returns)
Here:
$2,286
State:
$2,311
(% of AGI for various income ranges: 102.2% for AGIs below $25k, 68.0% for AGIs $25k-50k)
Percentage of individuals using paid preparers for their 2020 taxes: 93.8%
Here:
94%
State:
93%
(% for various income ranges: 100.0% for AGIs below $25k, 92.3% for AGIs $25k-50k, 88.9% for AGIs $50k-75k, 83.3% for AGIs $75k-100k, 100.0% for AGIs $100k-200k)
Averages for the 2012 tax year for zip code 61420, filed in 2013:
Average Adjusted Gross Income (AGI) in 2012: $49,455 (Individual Income Tax Returns)
Here:
$49,455
State:
$68,058
Salary/wage: $35,614 (reported on 79.2% of returns)
Here:
$35,614
State:
$55,396
(% of AGI for various income ranges: 74.7% for AGIs below $25k, 72.2% for AGIs $25k-50k, 73.1% for AGIs $50k-75k, 67.6% for AGIs $75k-100k, 29.9% for AGIs $100k-200k)
Taxable interest for individuals: $1,286 (reported on 39.6% of returns)
This zip code:
$1,286
Illinois:
$1,969
(% of AGI for various income ranges: 1.7% for AGIs below $25k, 0.5% for AGIs $25k-50k, 0.5% for AGIs $50k-75k, 0.4% for AGIs $75k-100k, 1.7% for AGIs $100k-200k)
Ordinary dividends: $1,460 (reported on 18.9% of returns)
Here:
$1,460
State:
$7,786
(% of AGI for various income ranges: 0.2% for AGIs $25k-50k, 0.3% for AGIs $50k-75k, 1.3% for AGIs $100k-200k)
Net capital gain/loss in AGI: +$2,943 (reported on 13.2% of returns)
Here:
+$2,943
State:
+$22,183
Profit/loss from business: +$8,522 (reported on 17.0% of returns)
Here:
+$8,522
State:
+$12,903
(% of AGI for various income ranges: 10.3% for AGIs below $25k, 5.4% for AGIs $25k-50k, 4.8% for AGIs $50k-75k)
Taxable individual retirement arrangement distribution: $4,983 (reported on 11.3% of returns)
61420:
$4,983
Illinois:
$17,929
Total itemized deductions: $17,025 (20% of AGI, reported on 15.1% of returns)
Here:
$17,025
State:
$26,433
Here:
19.6% of AGI
State:
19.2% of AGI
Charity contributions: $4,383 (reported on 11.3% of returns)
Here:
$4,383
State:
$4,525
Taxes paid: $5,725 (reported on 15.1% of returns)
61420:
$5,725
State:
$11,968
Earned income credit: $1,822 (reported on 17.0% of returns)
Here:
$1,822
State:
$2,349
(% of AGI for various income ranges: 4.4% for AGIs below $25k, 1.3% for AGIs $25k-50k)
Percentage of individuals using paid preparers for their 2012 taxes: 73.6%
Here:
74%
State:
57%
(% for various income ranges: 60.0% for AGIs below $25k, 84.6% for AGIs $25k-50k, 77.8% for AGIs $50k-75k, 80.0% for AGIs $75k-100k, 83.3% for AGIs $100k-200k)
Averages for the 2004 tax year for zip code 61420, filed in 2005:
Average Adjusted Gross Income (AGI) in 2004: $32,998 (Individual Income Tax Returns)
Here:
$32,998
State:
$54,625
Salary/wage: $26,772 (reported on 80.0% of returns)
Here:
$26,772
State:
$46,811
(% of AGI for various income ranges: 94.8% for AGIs below $10k, 73.5% for AGIs $10k-25k, 69.1% for AGIs $25k-50k, 76.6% for AGIs $50k-75k, 59.7% for AGIs $75k-100k, 30.1% for AGIs over 100k)
Taxable interest for individuals: $1,529 (reported on 51.0% of returns)
This zip code:
$1,529
Illinois:
$2,101
(% of AGI for various income ranges: 13.2% for AGIs below $10k, 4.1% for AGIs $10k-25k, 2.0% for AGIs $25k-50k, 0.5% for AGIs $50k-75k, 1.5% for AGIs $75k-100k, 3.2% for AGIs over 100k)
Taxable dividends: $608 (reported on 22.8% of returns)
Here:
$608
State:
$4,306
(% of AGI for various income ranges: 2.6% for AGIs below $10k, 0.5% for AGIs $10k-25k, 0.4% for AGIs $25k-50k, 0.2% for AGIs $50k-75k, 0.8% for AGIs $75k-100k)
Net capital gain/loss: +$3,520 (reported on 18.6% of returns)
Here:
+$3,520
State:
+$17,321
(% of AGI for various income ranges: 7.4% for AGIs below $10k, 1.4% for AGIs $10k-25k, 2.2% for AGIs $25k-50k, 0.2% for AGIs $50k-75k, 7.2% for AGIs $75k-100k)
Profit/loss from business: +$3,660 (reported on 18.8% of returns)
Here:
+$3,660
State:
+$11,771
(% of AGI for various income ranges: 0.2% for AGIs below $10k, 6.7% for AGIs $10k-25k, 2.3% for AGIs $25k-50k, 1.9% for AGIs $50k-75k)
Profit/loss from farming: +$6,459 (reported on 11.1% of returns)
Here:
+$6,459
State:
+$2,327
IRA payment deduction: $3,176 (reported on 3.1% of returns)
61420:
$3,176
Illinois:
$3,087
Total itemized deductions: $14,983 (25% of AGI, reported on 10.7% of returns)
Here:
$14,983
State:
$20,239
Here:
25.2% of AGI
State:
19.5% of AGI
(% of AGI for various income ranges: 5.3% for AGIs $10k-25k, 5.4% for AGIs $25k-50k, 3.8% for AGIs $50k-75k, 12.9% for AGIs $75k-100k)
Charity contributions deductions: $3,889 (7% of AGI, reported on 6.6% of returns)
Here:
$3,889
State:
$3,719
Here:
7.0% of AGI
State:
3.4% of AGI
Total tax: $4,000 (reported on 76.5% of returns)
61420:
$4,000
State:
$9,882
(% of AGI for various income ranges: 5.0% for AGIs below $10k, 4.7% for AGIs $10k-25k, 6.6% for AGIs $25k-50k, 9.1% for AGIs $50k-75k, 11.3% for AGIs $75k-100k, 18.0% for AGIs over 100k)
Earned income credit: $1,488 (reported on 15.3% of returns)
Here:
$1,488
State:
$1,788
Percentage of individuals using paid preparers for their 2004 taxes: 72.7%
Here:
73%
State:
61%
(% for various income ranges: 65.9% for AGIs below $10k, 66.2% for AGIs $10k-25k, 77.7% for AGIs $25k-50k, 83.3% for AGIs $50k-75k, 75.0% for AGIs $75k-100k, 87.5% for AGIs over 100k)
Household received Food Stamps/SNAP in the past 12 months: 51 Household did not receive Food Stamps/SNAP in the past 12 months: 379
Women who did not have a birth in the past 12 months: 163 (81 now married, 81 unmarried)
Housing units in zip code 61420 with a mortgage: 149 (1 second mortgage, 1 both second mortgage and home equity loan) Median monthly owner costs for units with a mortgage: $1,014 Median monthly owner costs for units without a mortgage: $475
Residents with income below the poverty level in 2022:
This zip code:
12.9%
Whole state:
11.9%
Residents with income below 50% of the poverty level in 2022:
This zip code:
8.4%
Whole state:
5.7%
Median number of rooms in houses and condos:
Here:
6.9
State:
6.4
Median number of rooms in apartments:
Here:
5.5
State:
4.1
Notable locations in this zip code not listed on our city pages
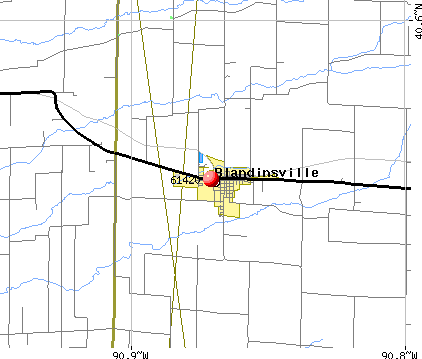
Notable locations in zip code 61420: Twin Oaks Country Club (A), Blandinsville-Hire Community Center (B), Hire Townhall (C), Blandinsville - Hire Fire Protection District (D). Display/hide their locations on the map
Churches in zip code 61420 include: Old Bedford Christian Church (A), Blandinsville United Methodist Church (B), First Baptist Church of Blandinsville (C), First Christian Church (D), Friendship United Methodist Church (E). Display/hide their locations on the map
Cemeteries: Anderson Cemetery (1), Liberty Cemetery (2), Lincoln Catholic Cemetery (3), Mourning Cemetery (4), Wilson Cemetery (5), South Cemetery (6), Duncan Cemetery (7). Display/hide their locations on the map
Size of family households: 140 2-persons, 51 3-persons, 40 4-persons, 14 5-persons, 3 6-persons, 5 7-or-more-persons
Size of nonfamily households: 138 1-person, 41 2-persons
99 married couples with children.
37 single-parent households (34 men, 3 women).
99.0% of residents of 61420 zip code speak English at home.
0.7% of residents speak other Indo-European language at home (50% very well, 50% well).
Foreign born population: 22 (2.2%) (100.0% of them are naturalized citizens)
This zip code:
2.2%
Whole state:
14.4%
59%Japan
18%Croatia
19%European
18%German
12%American
6%English
5%Swedish
4%Scottish
4%Irish
Year of entry for the foreign-born population
02010 or later
02000 to 2009
21990 to 1999
18Before 1990
Facilities with environmental interests located in this zip code:
ROQUETTE AMERICA INC (201 N BUSHNELL in BLANDINSVILLE, IL)
STATE MASTER (Illinois EPA Project) - AIR PROGRAM AIR MINOR (AIRS/AFS) CRITERIA AND HAZARDOUS AIR POLLUTANT INVENTORY (Inventory of air pollution sources) Business SIC classification: GRAIN AND FIELD BEANS
NORTS MINI MART NORTHRUP PETROLEUM (115 WEST WASHINGTON STREET in BLANDINSVILLE, IL)
National Pollutant Discharge Elimination System NON-MAJOR (Tracking pollutant discharge elimination systems) - permit (Resource Conservation and Recovery Act (tracking hazardous waste)) Organizations: NORTHRUP'S PETROLEUM, INC. (CONTACT/OWNER)
, NORTHRUP PETROLEUM INC (CONTACT/OWNER)
Alternative names: NORTHRUP'S PETROLEUM INC.
ADAMS FS INC (HWY 96 in BLANDINSVILLE, IL)
(Resource Conservation and Recovery Act (tracking hazardous waste))
AMOCO FERTILIZER PLANT (3MI E ON RTE 9 in BLANDINSVILLE, IL)
(Resource Conservation and Recovery Act (tracking hazardous waste))
MCDONOUGH FS INC B 1 (TP&W AT BUSHNELL ST in BLANDINSVILLE, IL)
(Resource Conservation and Recovery Act (tracking hazardous waste))
CURTIS?NEIL (405 S. BUSHNELL STREET in BLANDINSVILLE, IL)
National Pollutant Discharge Elimination System NON-MAJOR (Tracking pollutant discharge elimination systems) - permit Alternative names: CURTIS, NEIL
Housing units lacking complete plumbing facilities: 0.6%
43.9%Utility gas
32.1%Bottled, tank, or LP gas
23.4%Electricity
0.9%Other fuel
Population in 1990: 1,272.
Place of birth for U.S.-born residents:
This state: 798
Northeast: 2
Midwest: 155
South: 5
West: 2
72% of the 61420 zip code residents lived in the same house 5 years ago. Out of people who lived in different houses, 71% lived in this county. Out of people who lived in different counties, 50% lived in Illinois.
90% of the 61420 zip code residents lived in the same house 1 year ago. Out of people who lived in different houses, 64% moved from this county. Out of people who lived in different houses, 32% moved from different county within same state.
Private vs. public school enrollment:
Students in private schools in grades 1 to 8 (elementary and middle school):
Here:
0.0%
Illinois:
13.3%
Students in private schools in grades 9 to 12 (high school): 6
Here:
30.9%
Illinois:
9.9%
Students in private undergraduate colleges:
Here:
0.0%
Illinois:
27.4%
Occupation by median earnings in the past 12 months ($)
59,993Construction and extraction occupations
57,841Installation, maintenance, and repair occupations
54,594Transportation occupations
54,561Production occupations
36,773Healthcare support occupations
33,243Management occupations
Top industries in this zip code by the number of employees in 2005:
Finance and Insurance: Commercial Banking (10-19: 1)
Finance and Insurance: Insurance Agencies and Brokerages (1-4: 2)
Finance and Insurance: Direct Property and Casualty Insurance Carriers (1-4: 1)
Administrative and Support and Waste Management and Remediation Services: Locksmiths (1-4: 1)
2002 - 2018 National Fire Incident Reporting System (NFIRS) incidents
Based on the data from the years 2002 - 2018 the average number of fires per year is 9. The highest number of fires - 18 took place in 2003, and the least - 0 in 2004. The data has a dropping trend.
When looking into fire subcategories, the most incidents belonged to: Outside Fires (38.4%), and Other (23.8%).
Fire incident types reported to NFIRS in Zip Code 61420


 Nearest zip codes: 61450, 61475, 62326, 62374, 61471, 61460.


 Based on the data from the years 2002 - 2018 the average number of fires per year is 9. The highest number of fires - 18 took place in 2003, and the least - 0 in 2004. The data has a dropping trend.
 When looking into fire subcategories, the most incidents belonged to: Outside Fires (38.4%), and Other (23.8%).