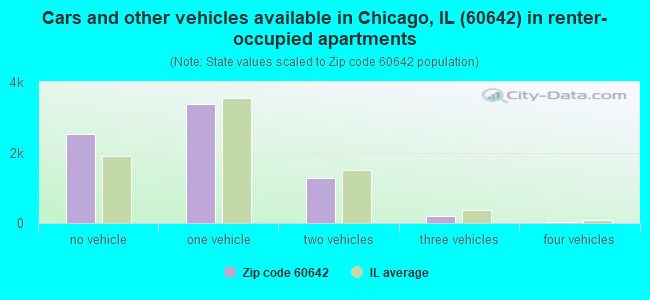
Houses and condos: 11,840 Renter-occupied apartments: 7,375
% of renters here:
66%
State:
33%
March 2022 cost of living index in zip code 60642: 99.5 (near average, U.S. average is 100)
Land area: 1.7 sq. mi. Water area: 0.0 sq. mi.
Population density: 12,434 people per square mile
(very high).
OSM Map
Google Map
MSN Map
OSM Map
General Map
Google Map
MSN Map
OSM Map
Google Map
MSN Map
OSM Map
Google Map
MSN Map
Please wait while loading the map...
Real estate property taxes paid for housing units in 2022:
This zip code:
1.5% ($9,275)
Illinois:
2.0% ($4,912)
Median real estate property taxes paid for housing units with mortgages in 2022: $9,034 (1.4%) Median real estate property taxes paid for housing units with no mortgage in 2022: $9,944 (1.7%)
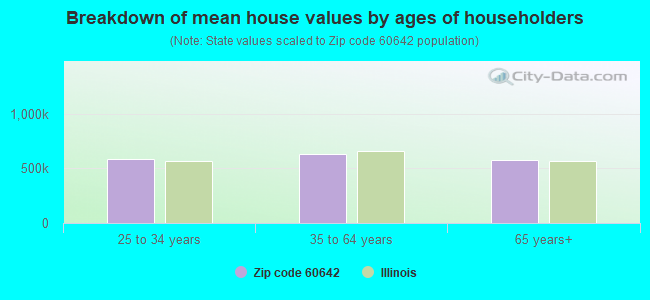
Estimated median house/condo value in 2022: $624,317
60642:
$624,317
Illinois:
$251,600
According to our research of Illinois and other state lists, there were 3 registered sex offenders living in 60642 zip code as of May 08, 2024. The ratio of all residents to sex offenders in zip code 60642 is 6,596 to 1. The ratio of registered sex offenders to all residents in this zip code is much lower than the state average.
Median resident age:
This zip code:
32.3 years
Illinois median age:
39.1 years
Average household size:
This zip code:
1.9 people
Illinois:
2.4 people
Averages for the 2020 tax year for zip code 60642, filed in 2021:
Average Adjusted Gross Income (AGI) in 2020: $118,095 (Individual Income Tax Returns)
Here:
$118,095
State:
$82,626
Salary/wage: $104,399 (reported on 92.0% of returns)
Here:
$104,399
State:
$66,640
(% of AGI for various income ranges: 1229.8% for AGIs below $25k, 3785.2% for AGIs $25k-50k, 7210.5% for AGIs $50k-75k, 10767.6% for AGIs $75k-100k, 20137.9% for AGIs $100k-200k, 92496.7% for AGIs over 200k)
Taxable interest for individuals: $1,123 (reported on 32.0% of returns)
This zip code:
$1,123
Illinois:
$2,376
(% of AGI for various income ranges: 8.6% for AGIs below $25k, 9.2% for AGIs $25k-50k, 10.7% for AGIs $50k-75k, 15.4% for AGIs $75k-100k, 50.4% for AGIs $100k-200k, 536.2% for AGIs over 200k)
Ordinary dividends: $3,700 (reported on 33.8% of returns)
Here:
$3,700
State:
$9,061
(% of AGI for various income ranges: 17.7% for AGIs below $25k, 37.8% for AGIs $25k-50k, 41.1% for AGIs $50k-75k, 81.6% for AGIs $75k-100k, 182.9% for AGIs $100k-200k, 1780.0% for AGIs over 200k)
Net capital gain/loss in AGI: +$19,806 (reported on 32.5% of returns)
Here:
+$19,806
State:
+$31,684
(% of AGI for various income ranges: 15.8% for AGIs below $25k, 34.2% for AGIs $25k-50k, 56.6% for AGIs $50k-75k, 132.7% for AGIs $75k-100k, 418.5% for AGIs $100k-200k, 12619.0% for AGIs over 200k)
Profit/loss from business: +$18,714 (reported on 14.9% of returns)
Here:
+$18,714
State:
+$12,175
(% of AGI for various income ranges: 186.8% for AGIs below $25k, 186.8% for AGIs $25k-50k, 208.4% for AGIs $50k-75k, 234.5% for AGIs $75k-100k, 520.8% for AGIs $100k-200k, 2426.7% for AGIs over 200k)
Taxable individual retirement arrangement distribution: $16,020 (reported on 3.5% of returns)
60642:
$16,020
Illinois:
$21,613
(% of AGI for various income ranges: 30.5% for AGIs below $25k, 22.9% for AGIs $25k-50k, 34.1% for AGIs $50k-75k, 58.0% for AGIs $75k-100k, 120.8% for AGIs $100k-200k, 504.0% for AGIs over 200k)
Self-employed (Keogh) retirement plans: $26,923 (reported on 1.1% of returns)
60642:
$26,923
Illinois:
$30,962
(% of AGI for various income ranges: 38.1% for AGIs $100k-200k, 558.7% for AGIs over 200k)
Total itemized deductions: $27,147 (reported on 16.5% of returns)
Here:
$27,147
State:
$34,948
(% of AGI for various income ranges: 64.1% for AGIs below $25k, 90.2% for AGIs $25k-50k, 182.4% for AGIs $50k-75k, 359.1% for AGIs $75k-100k, 1004.4% for AGIs $100k-200k, 5192.1% for AGIs over 200k)
Charity contributions: $6,104 (reported on 12.1% of returns)
Here:
$6,104
State:
$13,122
(% of AGI for various income ranges: 10.3% for AGIs $25k-50k, 24.9% for AGIs $50k-75k, 28.4% for AGIs $75k-100k, 97.4% for AGIs $100k-200k, 1193.8% for AGIs over 200k)
Taxes paid: $9,259 (reported on 16.5% of returns)
60642:
$9,259
State:
$8,563
(% of AGI for various income ranges: 17.8% for AGIs below $25k, 29.1% for AGIs $25k-50k, 63.7% for AGIs $50k-75k, 143.4% for AGIs $75k-100k, 414.2% for AGIs $100k-200k, 1520.0% for AGIs over 200k)
Earned income credit: $1,779 (reported on 6.6% of returns)
Here:
$1,779
State:
$2,311
(% of AGI for various income ranges: 70.2% for AGIs below $25k, 27.0% for AGIs $25k-50k)
Percentage of individuals using paid preparers for their 2020 taxes: 95.1%
Here:
95%
State:
93%
(% for various income ranges: 92.7% for AGIs below $25k, 93.3% for AGIs $25k-50k, 95.9% for AGIs $50k-75k, 95.5% for AGIs $75k-100k, 95.9% for AGIs $100k-200k, 96.9% for AGIs over 200k)
Averages for the 2012 tax year for zip code 60642, filed in 2013:
Average Adjusted Gross Income (AGI) in 2012: $75,198 (Individual Income Tax Returns)
Here:
$75,198
State:
$68,058
Salary/wage: $71,866 (reported on 91.2% of returns)
Here:
$71,866
State:
$55,396
(% of AGI for various income ranges: 82.3% for AGIs below $25k, 92.2% for AGIs $25k-50k, 93.6% for AGIs $50k-75k, 92.2% for AGIs $75k-100k, 90.1% for AGIs $100k-200k, 78.5% for AGIs over 200k)
Taxable interest for individuals: $981 (reported on 29.4% of returns)
This zip code:
$981
Illinois:
$1,969
(% of AGI for various income ranges: 0.4% for AGIs below $25k, 0.2% for AGIs $25k-50k, 0.1% for AGIs $50k-75k, 0.2% for AGIs $75k-100k, 0.5% for AGIs $100k-200k, 0.5% for AGIs over 200k)
Ordinary dividends: $3,317 (reported on 21.2% of returns)
Here:
$3,317
State:
$7,786
(% of AGI for various income ranges: 1.0% for AGIs below $25k, 0.7% for AGIs $25k-50k, 0.4% for AGIs $50k-75k, 0.6% for AGIs $75k-100k, 0.9% for AGIs $100k-200k, 1.5% for AGIs over 200k)
Net capital gain/loss in AGI: +$8,643 (reported on 17.8% of returns)
Here:
+$8,643
State:
+$22,183
(% of AGI for various income ranges: 0.5% for AGIs $25k-50k, 0.1% for AGIs $50k-75k, 0.8% for AGIs $75k-100k, 1.5% for AGIs $100k-200k, 4.9% for AGIs over 200k)
Profit/loss from business: +$15,826 (reported on 16.3% of returns)
Here:
+$15,826
State:
+$12,903
(% of AGI for various income ranges: 12.9% for AGIs below $25k, 3.7% for AGIs $25k-50k, 2.5% for AGIs $50k-75k, 2.9% for AGIs $75k-100k, 3.1% for AGIs $100k-200k, 2.8% for AGIs over 200k)
Taxable individual retirement arrangement distribution: $18,549 (reported on 3.4% of returns)
60642:
$18,549
Illinois:
$17,929
(% of AGI for various income ranges: 1.0% for AGIs below $25k, 0.7% for AGIs $25k-50k, 0.7% for AGIs $50k-75k, 0.5% for AGIs $75k-100k, 0.9% for AGIs $100k-200k, 1.1% for AGIs over 200k)
Self-employment retirement plans: $20,838 (reported on 0.7% of returns)
60642:
$20,838
Illinois:
$24,666
Total itemized deductions: $24,539 (16% of AGI, reported on 31.1% of returns)
Here:
$24,539
State:
$26,433
Here:
16.2% of AGI
State:
19.2% of AGI
(% of AGI for various income ranges: 6.7% for AGIs below $25k, 5.7% for AGIs $25k-50k, 7.3% for AGIs $50k-75k, 10.3% for AGIs $75k-100k, 13.5% for AGIs $100k-200k, 10.9% for AGIs over 200k)
Charity contributions: $2,432 (reported on 24.2% of returns)
Here:
$2,432
State:
$4,525
(% of AGI for various income ranges: 0.3% for AGIs below $25k, 0.6% for AGIs $25k-50k, 0.6% for AGIs $50k-75k, 0.8% for AGIs $75k-100k, 0.9% for AGIs $100k-200k, 0.9% for AGIs over 200k)
Taxes paid: $11,423 (reported on 31.0% of returns)
60642:
$11,423
State:
$11,968
(% of AGI for various income ranges: 1.9% for AGIs below $25k, 1.7% for AGIs $25k-50k, 2.5% for AGIs $50k-75k, 3.9% for AGIs $75k-100k, 6.2% for AGIs $100k-200k, 6.4% for AGIs over 200k)
Earned income credit: $1,932 (reported on 10.6% of returns)
Here:
$1,932
State:
$2,349
(% of AGI for various income ranges: 4.9% for AGIs below $25k, 0.4% for AGIs $25k-50k)
Percentage of individuals using paid preparers for their 2012 taxes: 45.6%
Here:
46%
State:
57%
(% for various income ranges: 46.1% for AGIs below $25k, 42.2% for AGIs $25k-50k, 37.3% for AGIs $50k-75k, 43.4% for AGIs $75k-100k, 51.9% for AGIs $100k-200k, 71.4% for AGIs over 200k)
Averages for the 2004 tax year for zip code 60642, filed in 2005:
Average Adjusted Gross Income (AGI) in 2004: $75,665 (Individual Income Tax Returns)
Here:
$75,665
State:
$54,625
Salary/wage: $64,575 (reported on 68.0% of returns)
Here:
$64,575
State:
$46,811
(% of AGI for various income ranges: 75.0% for AGIs below $10k, 50.1% for AGIs $25k-50k, 63.3% for AGIs $50k-75k, 86.8% for AGIs $75k-100k, 54.2% for AGIs over 100k)
Taxable interest for individuals: $2,076 (reported on 80.2% of returns)
This zip code:
$2,076
Illinois:
$2,101
(% of AGI for various income ranges: 29.0% for AGIs below $10k, 4.2% for AGIs $10k-25k, 7.0% for AGIs $25k-50k, 3.3% for AGIs $50k-75k, 1.0% for AGIs $75k-100k, 0.8% for AGIs over 100k)
Taxable dividends: $2,878 (reported on 45.7% of returns)
Here:
$2,878
State:
$4,306
(% of AGI for various income ranges: 1.9% for AGIs $10k-25k, 3.5% for AGIs $25k-50k, 0.8% for AGIs $50k-75k, 0.5% for AGIs $75k-100k, 2.0% for AGIs over 100k)
Net capital gain/loss: +$1,422 (reported on 22.8% of returns)
Here:
+$1,422
State:
+$17,321
(% of AGI for various income ranges: -0.8% for AGIs $10k-25k, -0.4% for AGIs $50k-75k, 0.9% for AGIs over 100k)
Profit/loss from business: +$7,375 (reported on 12.2% of returns)
Here:
+$7,375
State:
+$11,771
Total itemized deductions: $16,584 (15% of AGI, reported on 45.2% of returns)
Here:
$16,584
State:
$20,239
Here:
14.9% of AGI
State:
19.5% of AGI
(% of AGI for various income ranges: 18.7% for AGIs $25k-50k, 10.7% for AGIs $50k-75k, 8.5% for AGIs $75k-100k, 9.1% for AGIs over 100k)
Charity contributions deductions: $2,867 (3% of AGI, reported on 42.1% of returns)
Here:
$2,867
State:
$3,719
Here:
2.9% of AGI
State:
3.4% of AGI
(% of AGI for various income ranges: 1.9% for AGIs $25k-50k, 2.7% for AGIs $50k-75k, 1.1% for AGIs $75k-100k, 1.5% for AGIs over 100k)
Total tax: $12,680 (reported on 88.8% of returns)
60642:
$12,680
State:
$9,882
(% of AGI for various income ranges: 5.7% for AGIs $10k-25k, 8.0% for AGIs $25k-50k, 9.3% for AGIs $50k-75k, 11.2% for AGIs $75k-100k, 19.3% for AGIs over 100k)
Percentage of individuals using paid preparers for their 2004 taxes: 49.2%
Here:
49%
State:
61%
(% for various income ranges: 54.5% for AGIs below $10k, 33.3% for AGIs $10k-25k, 47.4% for AGIs $25k-50k, 47.4% for AGIs $50k-75k, 56.5% for AGIs $75k-100k, 56.5% for AGIs over 100k)
Likely homosexual households (counted as self-reported same-sex unmarried-partner households)
Lesbian couples: 0.4% of all households
Gay men: 0.4% of all households
Household received Food Stamps/SNAP in the past 12 months: 821 Household did not receive Food Stamps/SNAP in the past 12 months: 10,313
Women who had a birth in the past 12 months: 289 (236 now married, 52 unmarried) Women who did not have a birth in the past 12 months: 7,740 (1,829 now married, 5,956 unmarried)
Housing units in zip code 60642 with a mortgage: 3,153 (201 second mortgage, 13 home equity loan, 131 both second mortgage and home equity loan) Houses without a mortgage: 17
Median monthly owner costs for units with a mortgage: $3,225 Median monthly owner costs for units without a mortgage: $1,519
Residents with income below the poverty level in 2022:
This zip code:
8.0%
Whole state:
11.9%
Residents with income below 50% of the poverty level in 2022:
This zip code:
2.5%
Whole state:
5.7%
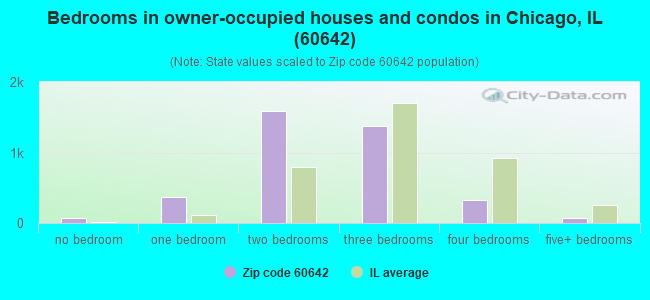
Median number of rooms in houses and condos:
Here:
4.7
State:
6.4
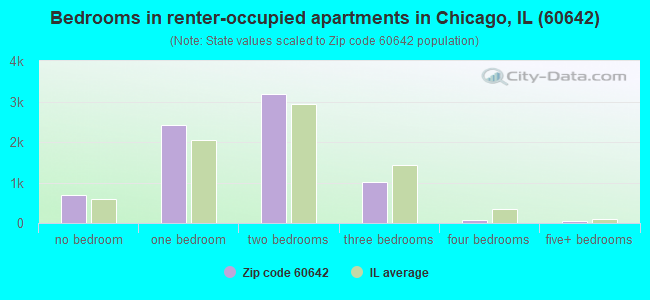
Median number of rooms in apartments:
Here:
3.6
State:
4.1
Notable locations in this zip code not listed on our city pages
Notable locations in zip code 60642: AAA Marina Incorporated (A), Chicago Fire Department District 1 Station 14 (B), Chicago Fire Department District 1 Station 30 (C), Urban West Associates Building (D), River West Plaza (E), Chicago Engine Company 30 (F), Chicago Engine Company 14 (G), Saint Boniface Church Hall (H). Display/hide their locations on the map
Churches in zip code 60642 include: Apostolic Assemby of the Faith in Christ Jesus (A), Israel Samuel African Methodist Episcopal Zion Church (B), New Macedonia Baptist Church (C), Holy Innocents Catholic Church (D), Holy Trinity Catholic Church (E), Saint Boniface Catholic Church (F), Saint John Cantius Roman Catholic Church (G), Saint Stanislaus Kostka Roman Catholic Church (H), Saint Stephen Catholic Church (I). Display/hide their locations on the map
1,143 married couples with children.
609 single-parent households (128 men, 481 women).
80.8% of residents of 60642 zip code speak English at home.
10.8% of residents speak Spanish at home (56% very well, 23% well, 9% not well, 11% not at all).
4.3% of residents speak other Indo-European language at home (79% very well, 12% well, 8% not well).
2.6% of residents speak Asian or Pacific Island language at home (91% very well, 9% well).
0.5% of residents speak other language at home (70% very well, 30% well).
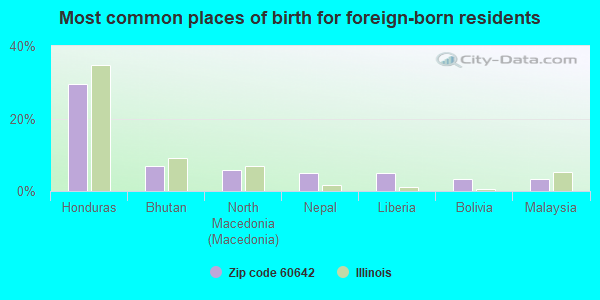
Foreign born population: 2,123 (10.0%) (57.2% of them are naturalized citizens)
This zip code:
10.0%
Whole state:
14.4%
30%Honduras
7%Bhutan
6%North Macedonia (Macedonia)
5%Nepal
5%Liberia
3%Bolivia
3%Malaysia
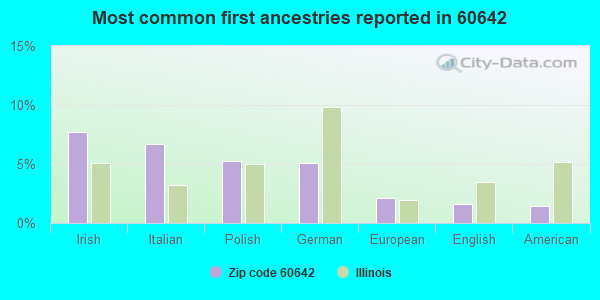
8%Irish
7%Italian
5%Polish
5%German
2%European
2%English
1%American
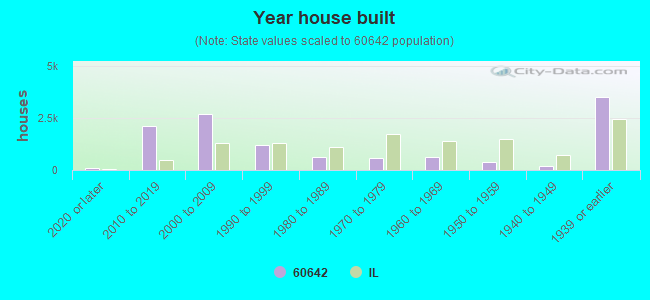
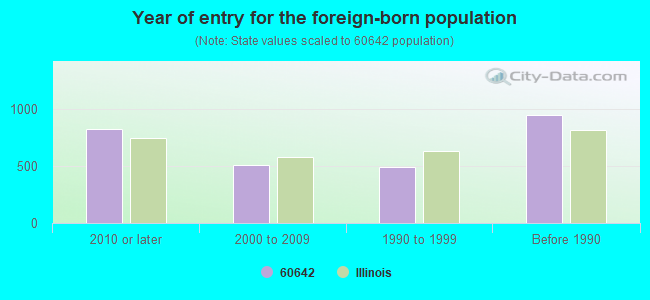
Year of entry for the foreign-born population
8272010 or later
5052000 to 2009
4921990 to 1999
947Before 1990
Housing units lacking complete plumbing facilities: 0.4% Housing units lacking complete kitchen facilities: 0.8%
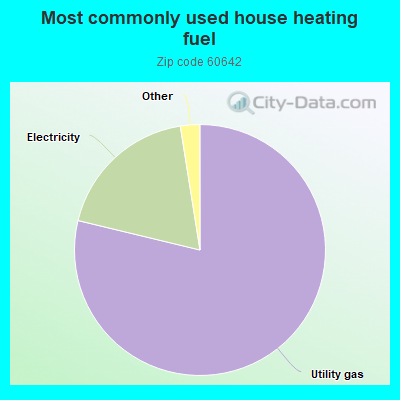
78.7%Utility gas
18.7%Electricity
1.0%Bottled, tank, or LP gas
0.6%No fuel used
Place of birth for U.S.-born residents:
This state: 11,111
Northeast: 1,228
Midwest: 3,795
South: 1,611
West: 697
76% of the 60642 zip code residents lived in the same house 1 year ago. Out of people who lived in different houses, 71% moved from this county. Out of people who lived in different houses, 8% moved from different county within same state. Out of people who lived in different houses, 17% moved from different state. Out of people who lived in different houses, 1% moved from abroad.
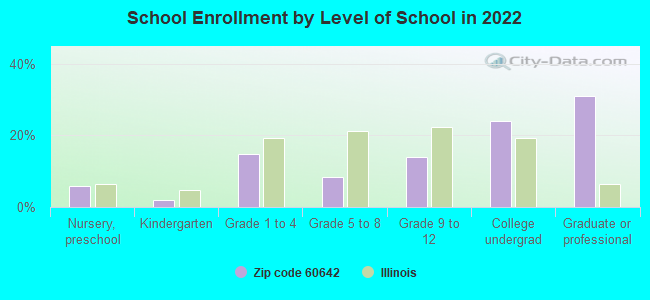
Private vs. public school enrollment:
Students in private schools in grades 1 to 8 (elementary and middle school): 99
Here:
16.5%
Illinois:
13.3%
Students in private schools in grades 9 to 12 (high school): 25
Here:
7.0%
Illinois:
9.9%
Students in private undergraduate colleges: 221
Here:
35.3%
Illinois:
27.4%
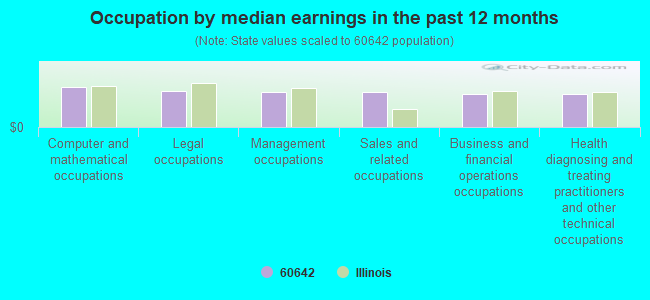
Occupation by median earnings in the past 12 months ($)
113,824Computer and mathematical occupations
102,857Legal occupations
100,228Management occupations
98,105Sales and related occupations
94,536Business and financial operations occupations
92,379Health diagnosing and treating practitioners and other technical occupations
Fatal accident statistics in 2014:
Fatal accident count: 5
Vehicles involved in fatal accidents: 6
Fatal accidents caused by drunken drivers: 3
Fatalities: 5
Persons involved in fatal accidents: 8
Pedestrians involved in fatal accidents: 3
Fatal accident statistics in 2013:
Fatal accident count: 1
Vehicles involved in fatal accidents: 1
Fatal accidents caused by drunken drivers: 0
Fatalities: 1
Persons involved in fatal accidents: 1
Pedestrians involved in fatal accidents: 1
2009 - 2018 National Fire Incident Reporting System (NFIRS) incidents
Based on the data from the years 2009 - 2018 the average number of fires per year is 84. The highest number of fire incidents - 105 took place in 2010, and the least - 33 in 2012. The data has an increasing trend.
When looking into fire subcategories, the most reports belonged to: Structure Fires (52.4%), and Mobile Property/Vehicle Fires (22.0%).
Fire incident types reported to NFIRS in Zip Code 60642


 Based on the data from the years 2009 - 2018 the average number of fires per year is 84. The highest number of fire incidents - 105 took place in 2010, and the least - 33 in 2012. The data has an increasing trend.
 When looking into fire subcategories, the most reports belonged to: Structure Fires (52.4%), and Mobile Property/Vehicle Fires (22.0%).