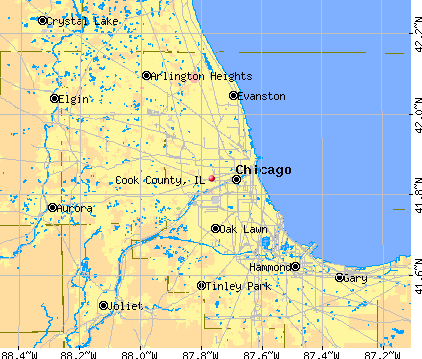
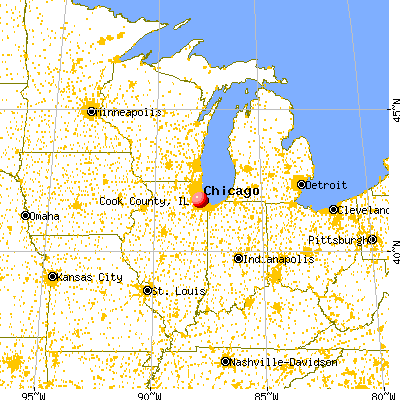
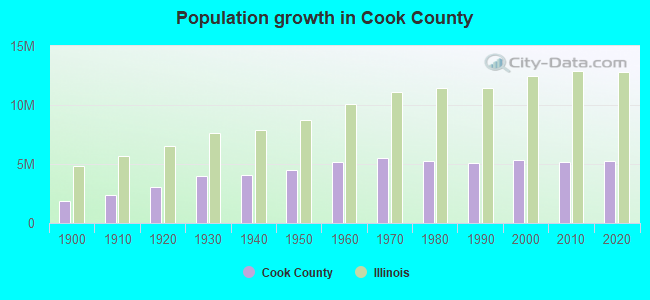
Cook County, Illinois (IL)
County owner-occupied free and clear houses and condos in 2010: 297,048
County owner-occupied houses and condos in 2000: 1,142,743
Renter-occupied apartments: 822,499 (it was 831,438 in 2000)
| % of renters here: | 42% |
| State: | 33% |
Land area: 946 sq. mi.
Water area: 689.4 sq. mi.
Population density: 5403 people per square mile (very high).
Industries providing employment: Educational, health and social services (22.8%), Professional, scientific, management, administrative, and waste management services (16.1%).
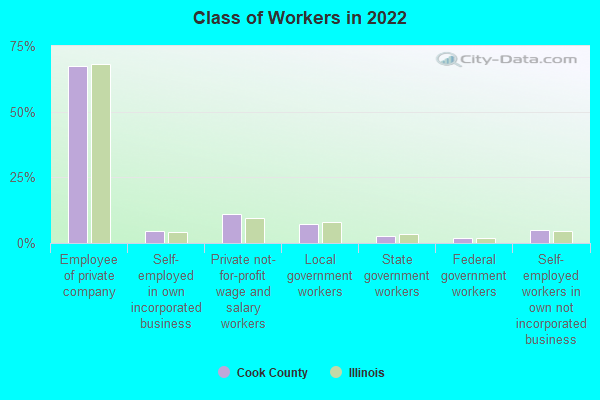
Type of workers:
- Private wage or salary: 83%
- Government: 12%
- Self-employed, not incorporated: 5%
- Unpaid family work: 0%
- OSM Map
- General Map
- Google Map
- MSN Map

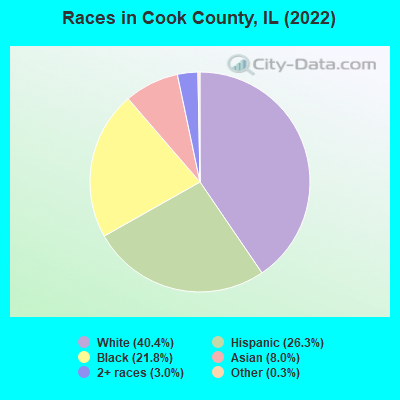
- 2,064,89040.4%White Non-Hispanic Alone
- 1,345,75226.3%Hispanic or Latino
- 1,115,71721.8%Black Non-Hispanic Alone
- 407,9128.0%Asian alone
- 152,8493.0%Two or more races
- 16,6060.3%Some other race alone
- 4,3300.08%American Indian and Alaska Native alone
- 1,2360.02%Native Hawaiian and Other
Pacific Islander alone
| Median resident age: | 38.1 years |
| Illinois median age: | 39.1 years |
| Males: 2,496,346 | |
| Females: 2,612,946 |

 | Pleasant, quiet, boring North or West suburb (48 replies) |
| Moving to Chicago suburbs 2021 (64 replies) |
| Suburbs that are obscure or little-known (240 replies) |
| Cook county again poised to have highest sales tax (51 replies) |
| Commercial Property Taxes - Cook County (9 replies) |
| Deciding between north shore villages for our "forever ish" home (15 replies) |
| Cook County: | 2.0 people |
| Illinois: | 3 people |
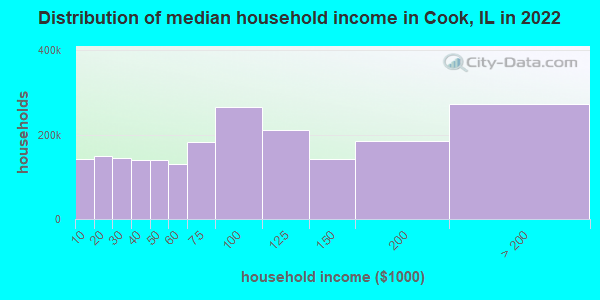
Estimated median household income in 2022: $76,632 ($45,922 in 1999)
| This county: | $76,632 |
| Illinois: | $76,708 |
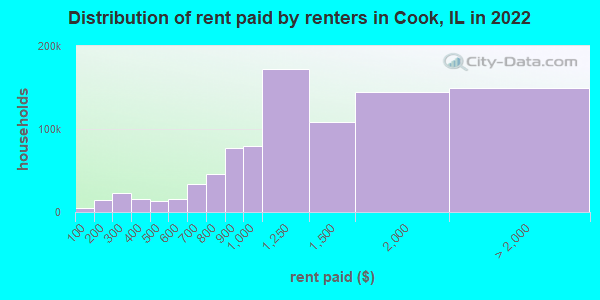
Median contract rent in 2022 for apartments: $1,161 (lower quartile is $865, upper quartile is $1,666)
| This county: | $1161 |
| State: | $1008 |
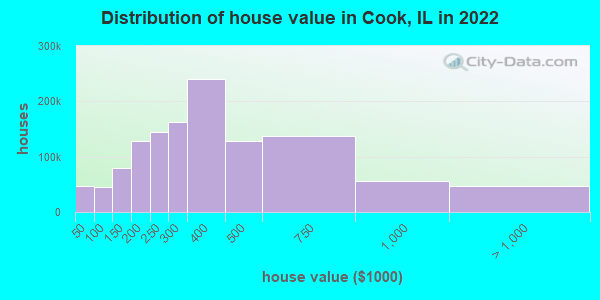
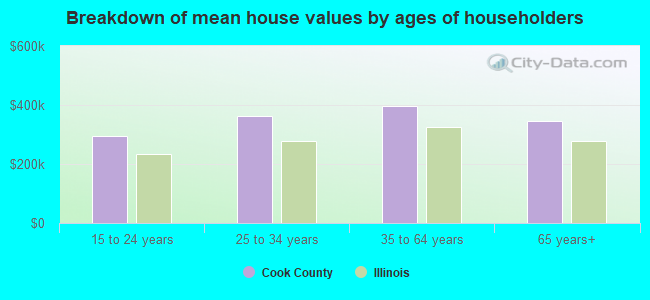
Estimated median house or condo value in 2022: $301,400 (it was $154,300 in 2000)
| Cook: | $301,400 |
| Illinois: | $251,600 |
Mean price in 2022:
Median monthly housing costs for homes and condos with a mortgage: $2,031Detached houses: $398,817
Here: $398,817 State: $310,164 Townhouses or other attached units: $348,645
Here: $348,645 State: $286,230 In 2-unit structures: $310,273
Here: $310,273 State: $299,638 In 3-to-4-unit structures: $366,192
Here: $366,192 State: $330,907 In 5-or-more-unit structures: $341,015
Here: $341,015 State: $318,887 Mobile homes: $69,289
Here: $69,289 State: $78,855 Occupied boats, RVs, vans, etc.: $126,496
Here: $126,496 State: $171,856
Median monthly housing costs for units without a mortgage: $851
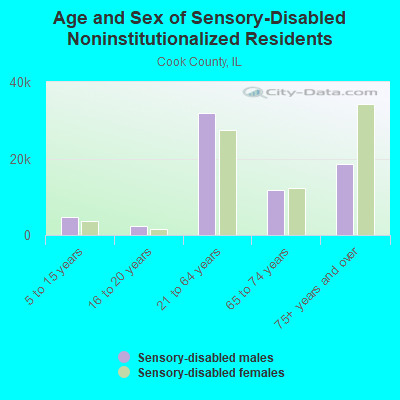
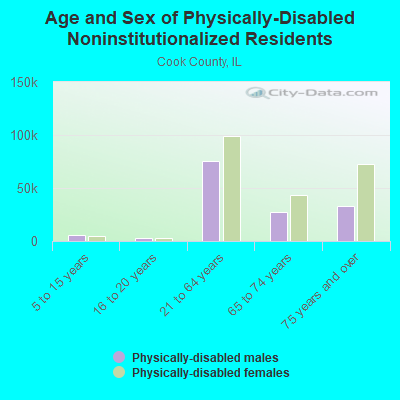
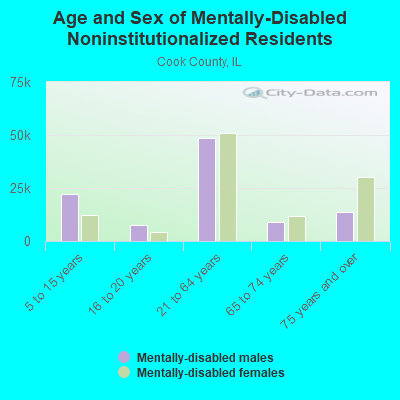
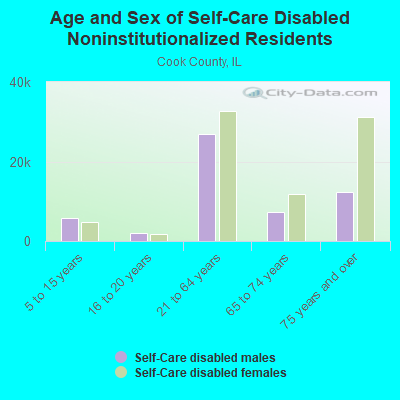
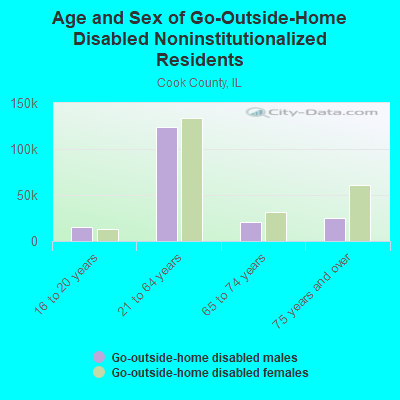
Institutionalized population: 45,749
Crime in 2020 (reported by the sheriff's office or county police, not the county total):
- Murders: 2
- Rapes: 55
- Robberies: 35
- Assaults: 130
- Burglaries: 117
- Thefts: 908
- Auto thefts: 116
Crime in 2019 (reported by the sheriff's office or county police, not the county total):
- Murders: 4
- Rapes: 61
- Robberies: 37
- Assaults: 129
- Burglaries: 156
- Thefts: 745
- Auto thefts: 134
Health of residents in Cook County based on CDC Behavioral Risk Factor Surveillance System Survey Questionnaires from 2013 to 2021:
General health status score of residents in this county from 1 (poor) to 5 (excellent) is 3.5. This is about average.73.0% of residents exercised in the past month. This is about average.
40.5% of residents smoked 100+ cigarettes in their lives. This is less than average.
58.1% of adult residents drank alcohol in the past 30 days. This is less than average.
68.0% of residents visited a dentist within the past year. This is about average.
Average weight of males is 197 pounds. This is about average.
Average weight of females is 164 pounds. This is about average.
Health of residents in Cook County based on CDC Behavioral Risk Factor Surveillance System Survey Questionnaires from 2003 to 2012:
General health status score of residents in this county from 1 (poor) to 5 (excellent) is 3.5. This is about average.74.7% of residents exercised in the past month. This is about average.
44.9% of residents smoked 100+ cigarettes in their lives. This is about average.
79.1% of adult residents drank alcohol in the past 30 days. This is about average.
69.5% of residents visited a dentist within the past year. This is about average.
Average weight of males is 191 pounds. This is about average.
Average weight of females is 164 pounds. This is about average.
9.8% of residents keep firearms around their homes. This is less than average.
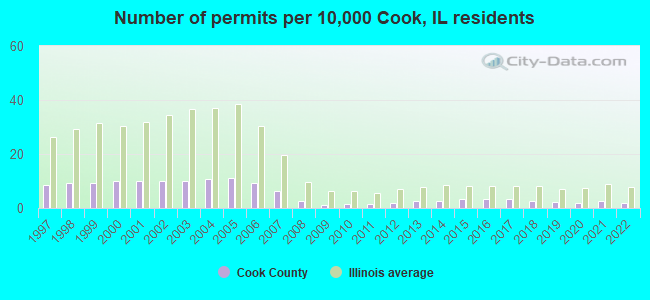
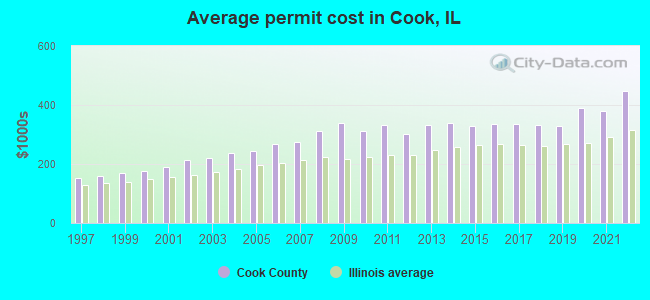
Single-family new house construction building permits:
- 2022: 1052 buildings, average cost: $447,600
- 2021: 1338 buildings, average cost: $381,400
- 2020: 932 buildings, average cost: $390,900
- 2019: 1171 buildings, average cost: $329,800
- 2018: 1448 buildings, average cost: $332,500
- 2017: 1707 buildings, average cost: $336,900
- 2016: 1812 buildings, average cost: $336,900
- 2015: 1735 buildings, average cost: $330,100
- 2014: 1476 buildings, average cost: $339,900
- 2013: 1396 buildings, average cost: $332,200
- 2012: 1070 buildings, average cost: $301,400
- 2011: 778 buildings, average cost: $332,000
- 2010: 725 buildings, average cost: $311,100
- 2009: 662 buildings, average cost: $340,100
- 2008: 1466 buildings, average cost: $311,400
- 2007: 3318 buildings, average cost: $275,900
- 2006: 5001 buildings, average cost: $269,400
- 2005: 6033 buildings, average cost: $244,800
- 2004: 5835 buildings, average cost: $237,200
- 2003: 5419 buildings, average cost: $221,300
- 2002: 5462 buildings, average cost: $211,900
- 2001: 5339 buildings, average cost: $190,000
- 2000: 5369 buildings, average cost: $177,100
- 1999: 4997 buildings, average cost: $168,700
- 1998: 4976 buildings, average cost: $160,800
- 1997: 4519 buildings, average cost: $152,300
Median real estate property taxes paid for housing units with mortgages in 2022: $5,940 (1.9%)
Median real estate property taxes paid for housing units with no mortgage in 2022: $5,250 (1.9%)
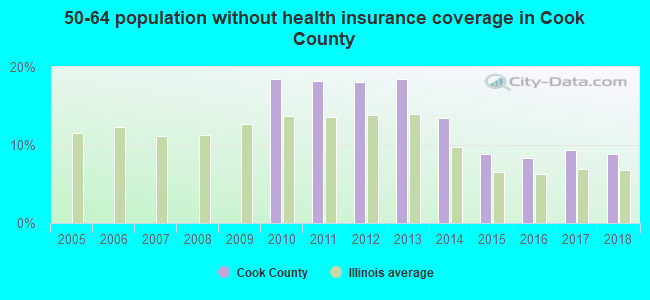
| Cook County: | 13.6% |
| Illinois: | 11.9% |
Median age of residents in 2022: 38.1 years old
(Males: 37.0 years old, Females: 39.3 years old)
(Median age for: White residents: 43.4 years old, Black residents: 37.6 years old, American Indian residents: 34.5 years old, Asian residents: 38.8 years old, Hispanic or Latino residents: 31.7 years old, Other race residents: 32.6 years old)
Area name: Chicago-Naperville-Joliet, IL HUD Metro FMR Area
Fair market rent in 2006 for a 1-bedroom apartment in Cook County is $802 a month.
Fair market rent for a 2-bedroom apartment is $901 a month.
Fair market rent for a 3-bedroom apartment is $1102 a month.
Cities in this county include: Chicago, Cicero, Arlington Heights, Schaumburg, Evanston, Palatine, Skokie, Des Plaines, Mount Prospect, Oak Lawn.
2023 air pollution in Cook County:
Carbon Monoxide: 0.337 ppm (standard limit: 9 ppm). Above U.S. average.
Nitrogen Dioxide: 0.02 ppm (standard limit: 0.053 ppm). Significanly above U.S. average.
Ozone (1-hour): 0.035 ppm (standard limit: 0.12 ppm). Near U.S. average.
Particulate Matter (PM10) Annual: 27.6 µg/m3. Above U.S. average.
Particulate Matter (PM2.5) Annual: 11.0 µg/m3(standard limit: 15.0 µg/m3). Near U.S. average.
Sulfur Oxides Annual: 0.001 ppm (standard limit: 0.03 ppm). Near U.S. average.
Notable locations in this county outside city limits:
Notable locations in Cook County: Camp Rotary McQueen (A), Shabbona Grove Picnic Area (B), Sommonauk Point Picnic Area (C), Three Fires Picnic Area (D), Ohio Grove Grange (E), Chief Shabbona Historical Site (F), Indian Oaks Country Club (G), Honey Hill Orchard (H), Jonamac Orchards (I), Kauffman Poultry Farm (J), Heisner Dairy Farm (K), DeKalb County Landfill (L), Montavon Seed Farm (M), Nordic Farms (N), Gogol Farm (O), Timber Edge Farm (P), Johnson Farm (Q), Holly Hock Farms (R), Tom Kennedy Recycling Center (S). Display/hide their locations on the map
Churches in Cook County include: Calvary Church (A), Saint Mary Catholic Church (B), Immanuel Lutheran Church (C), Rollo Congregational Church (D), Mayfield Church (E), Northwest United Church (F), Pierce Community Church (G), Somonauk Church (H), Northside Baptist Church (I). Display/hide their locations on the map
Cemeteries: Mayfield Cemetery (1), Immauel Lutheran Cemetery (2), Community Methodist Cemetery (3), Saint Paul's Catholic Cemetery (4), Afton Center Cemetery (5), Lee Calvary Cemetery (6), Charter Grove Cemetery (7). Display/hide their locations on the map
Lakes and reservoirs: Parris Lake (A), Shabbona Lake (B), Lake Prestbury (C), Buck Lake (D). Display/hide their locations on the map
Rivers and creeks: Deer Creek (A), Battle Creek (B), South Branch South Branch Kishwaukee River (C), East Branch Kilbuck Creek (D), Owens Creek (E), North Branch South Branch Kishwaukee River (F), Middle Branch South Branch Kishwaukee River (G), Kingsbury Creek (H), East Branch South Branch Kishwaukee River (I). Display/hide their locations on the map
Parks in Cook County include: MacQueen Forest Preserve (1), Saunnak Forest Preserve (2), Wetzel Park (3), Shabbona Lake State Recreational Area (4), Wilkinson - Renwick Marsh Nature Preserve (5), J Walter Becker Memorial Park (6), Katz Park (7). Display/hide their locations on the map
Neighboring counties: Boone County, Nebraska  , Oneida County, Idaho , Orange County, New York
  , Lake County
  , McHenry County
  , Ulster County, New York , Story County, Iowa , Will County
  .
.
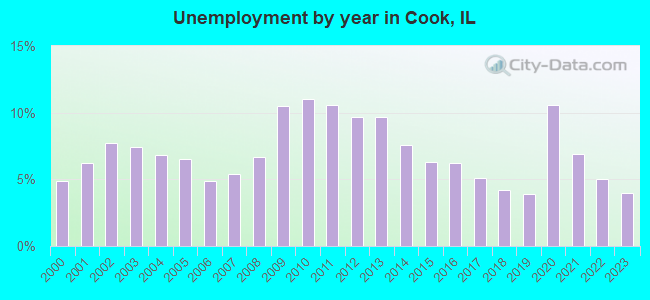
| Here: | 4.0% |
| Illinois: | 4.2% |
Current college students: 359,786
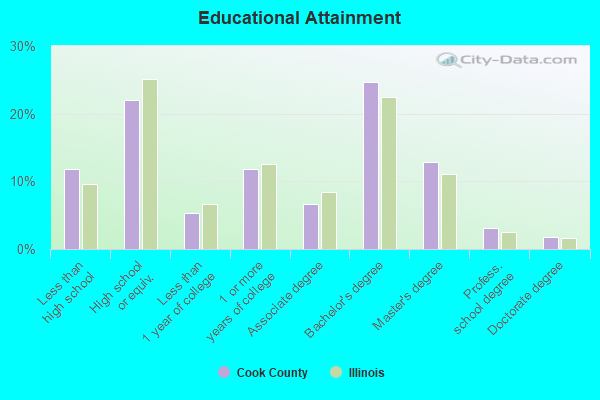
People 25 years of age or older with a high school degree or higher: 88.2%
People 25 years of age or older with a bachelor's degree or higher: 42.4%
Number of foreign born residents: 1,091,530 (53.3% naturalized citizens)
| Cook County: | 21.4% |
| Whole state: | 14.4% |
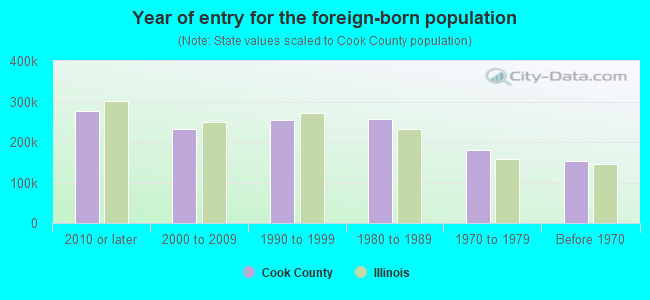
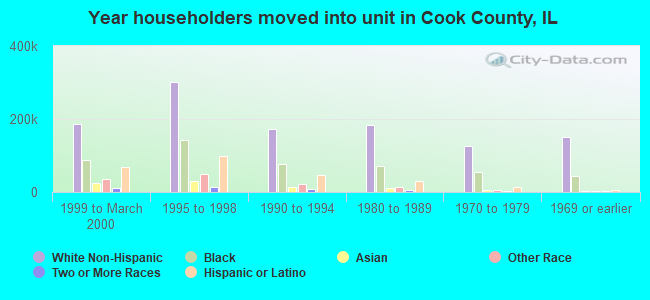
- Year of entry for the foreign-born population
- 275,5342010 or later
- 231,4142000 to 2009
- 255,5031990 to 1999
- 257,5451980 to 1989
- 180,1781970 to 1979
- 153,715Before 1970
Mean travel time to work (commute): minutes
Percentage of county residents living and working in this county: 98.8%
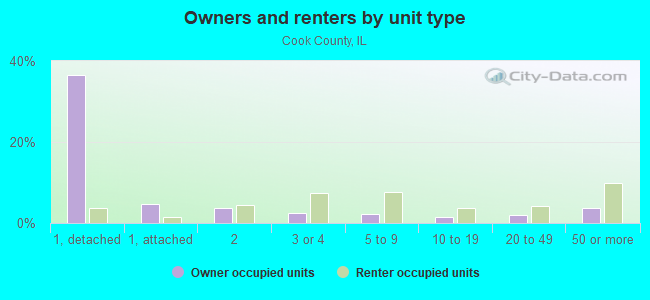
Housing units in structures:
- One, detached: 888,617
- One, attached: 131,551
- Two: 195,684
- 3 or 4: 231,064
- 5 to 9: 228,125
- 10 to 19: 118,225
- 20 to 49: 141,844
- 50 or more: 319,725
- Mobile homes: 15,315
- Boats, RVs, vans, etc.: 802
Housing units in Cook County with a mortgage: 764,125 (60,512 second mortgage, 2,184 home equity loan, 46,834 both second mortgage and home equity loan)
Houses without a mortgage: 20,151
| Here: | 97.4% with mortgage |
| State: | 97.4% with mortgage |
Religion statistics for Cook County


| Religion | Adherents | Congregations |
|---|---|---|
| Catholic | 1,947,223 | 376 |
| Evangelical Protestant | 432,975 | 1,484 |
| Other | 312,636 | 403 |
| Mainline Protestant | 202,114 | 630 |
| Black Protestant | 148,895 | 395 |
| Orthodox | 53,276 | 66 |
| None | 2,097,556 | - |
Source: Clifford Grammich, Kirk Hadaway, Richard Houseal, Dale E.Jones, Alexei Krindatch, Richie Stanley and Richard H.Taylor. 2012. 2010 U.S.Religion Census: Religious Congregations & Membership Study. Association of Statisticians of American Religious Bodies. Jones, Dale E., et al. 2002. Congregations and Membership in the United States 2000. Nashville, TN: Glenmary Research Center.
Food Environment Statistics:
| Cook County: | 2.77 / 10,000 pop. |
| State: | 2.24 / 10,000 pop. |
| Here: | 0.04 / 10,000 pop. |
| Illinois: | 0.08 / 10,000 pop. |
| This county: | 0.93 / 10,000 pop. |
| Illinois: | 0.75 / 10,000 pop. |
| Cook County: | 1.53 / 10,000 pop. |
| Illinois: | 2.61 / 10,000 pop. |
| This county: | 6.67 / 10,000 pop. |
| State: | 6.86 / 10,000 pop. |
| Cook County: | 8.4% |
| Illinois: | 8.3% |
| Cook County: | 23.5% |
| State: | 25.2% |
| Here: | 16.3% |
| State: | 14.5% |
Agriculture in Cook County:
Average size of farms: 113 acresAverage value of agricultural products sold per farm: $100,867
Average value of crops sold per acre for harvested cropland: $1401.79
The value of nursery, greenhouse, floriculture, and sod as a percentage of the total market value of agricultural products sold: 73.17%
The value of livestock, poultry, and their products as a percentage of the total market value of agricultural products sold: 1.41%
Average total farm production expenses per farm: $85,176
Harvested cropland as a percentage of land in farms: 62.80%
Irrigated harvested cropland as a percentage of land in farms: 0.90%
Average market value of all machinery and equipment per farm: $63,348
The percentage of farms operated by a family or individual: 81.52%
Average age of principal farm operators: 59 years
Average number of cattle and calves per 100 acres of all land in farms: 0.31
Corn for grain: 4413 harvested acres
All wheat for grain: 185 harvested acres
Soybeans for beans: 7463 harvested acres
Vegetables: 766 harvested acres
Land in orchards: 116 acres
Tornado activity:
Cook County historical area-adjusted tornado activity is significantly below Illinois state average. It is 26988261.5 times below overall U.S. average.Tornadoes in this county have caused one injury recorded between 1950 and 2004.
On 6/18/1975, a category 2 (max. wind speeds 113-157 mph) tornado injured one person and caused between $50,000 and $500,000 in damages.
Earthquake activity:
Cook County-area historical earthquake activity is significantly above Illinois state average. It is 39% greater than the overall U.S. average.On 4/18/2008 at 09:36:59, a magnitude 5.4 (5.1 MB, 4.8 MS, 5.4 MW, 5.2 MW, Class: Moderate, Intensity: VI - VII) earthquake occurred 234.3 miles away from Cook County center
On 6/10/1987 at 23:48:54, a magnitude 5.1 (4.9 MB, 4.4 MS, 4.6 MS, 5.1 LG) earthquake occurred 208.7 miles away from the county center
On 4/18/2008 at 09:36:59, a magnitude 5.2 (5.2 MW, Depth: 8.9 mi) earthquake occurred 234.3 miles away from the county center
On 6/28/2004 at 06:10:52, a magnitude 4.2 (4.2 MW, Depth: 6.2 mi, Class: Light, Intensity: IV - V) earthquake occurred 64.1 miles away from the county center
On 6/18/2002 at 17:37:15, a magnitude 5.0 (4.3 MB, 4.6 MW, 5.0 LG) earthquake occurred 266.3 miles away from Cook County center
On 4/18/2008 at 15:14:16, a magnitude 4.8 (4.5 MB, 4.8 MW, 4.6 MW) earthquake occurred 232.6 miles away from the county center
Magnitude types: regional Lg-wave magnitude (LG), body-wave magnitude (MB), surface-wave magnitude (MS), moment magnitude (MW)
Most recent natural disasters:
- Illinois Covid-19 Pandemic, Incident Period: January 20, 2020, FEMA Id: 4489, Natural disaster type: Other
- Illinois Severe Storms, Straight-Line Winds and Flooding, Incident Period: April 16, 2013 to May 05, 2013, Major Disaster (Presidential) Declared DR-4116: May 10, 2013, FEMA Id: 4116, Natural disaster type: Storm, Flood, Wind
- Illinois Severe Winter Storm and Snowstorm, Incident Period: January 31, 2011 to February 03, 2011, Major Disaster (Presidential) Declared DR-1960: March 17, 2011, FEMA Id: 1960, Natural disaster type: Snowstorm, Winter Storm
- Illinois Severe Storms and Flooding, Incident Period: July 19, 2010 to August 07, 2010, Major Disaster (Presidential) Declared DR-1935: August 19, 2010, FEMA Id: 1935, Natural disaster type: Storm, Flood
- Illinois Severe Storms and Flooding, Incident Period: September 13, 2008 to October 05, 2008, Major Disaster (Presidential) Declared DR-1800: October 03, 2008, FEMA Id: 1800, Natural disaster type: Storm, Flood
- Illinois Severe Storms and Flooding, Incident Period: August 20, 2007 to August 31, 2007, Major Disaster (Presidential) Declared DR-1729: September 25, 2007, FEMA Id: 1729, Natural disaster type: Storm, Flood
- Illinois Hurricane Katrina Evacuation, Incident Period: August 29, 2005 to October 01, 2005, Emergency Declared EM-3230: September 07, 2005, FEMA Id: 3230, Natural disaster type: Hurricane
- Illinois Severe Winter Storm, Incident Period: December 11, 2000 to December 31, 2000, Emergency Declared EM-3161: January 17, 2001, FEMA Id: 3161, Natural disaster type: Winter Storm
- Illinois Winter Snow Storm, Incident Period: January 01, 1999 to January 15, 1999, Emergency Declared EM-3134: January 08, 1999, FEMA Id: 3134, Natural disaster type: Storm, Snow
- Illinois Flooding, Incident Period: August 16, 1997 to August 17, 1997, Major Disaster (Presidential) Declared DR-1188: September 17, 1997, FEMA Id: 1188, Natural disaster type: Flood
- 10 other natural disasters have been reported since 1953.
The number of natural disasters in Cook County (20) is greater than the US average (15).
Major Disasters (Presidential) Declared: 15
Emergencies Declared: 4
Causes of natural disasters: Floods: 13, Storms: 12, Tornadoes: 3, Snowstorms: 2, Winter Storms: 2, Blizzard: 1, Hurricane: 1, Snow: 1, Wind: 1, Other: 1 (Note: some incidents may be assigned to more than one category).
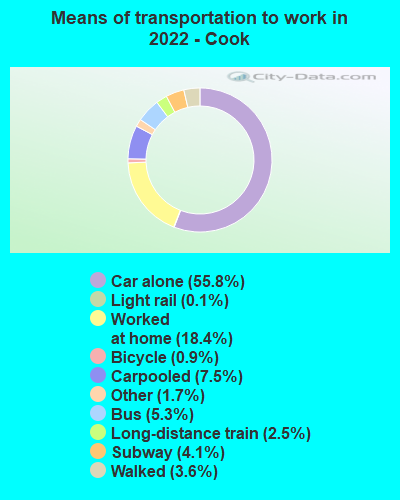
Means of transportation to work:
- Drove a car alone: 1,484,529 (55.8%)
- Carpooled: 200,592 (7.5%)
- Bus: 140,286 (5.3%)
- Subway or elevated rail: 109,080 (4.1%)
- Long-distance train or commuter rail: 66,639 (2.5%)
- Light rail, streetcar or trolley: 3,275 (0.1%)
- Ferryboat: 190 (0.0%)
- Taxicab, motorcycle, or other means: 45,203 (1.7%)
- Bicycle: 23,944 (0.9%)
- Walked: 96,120 (3.6%)
- Worked at home: 490,221 (18.4%)
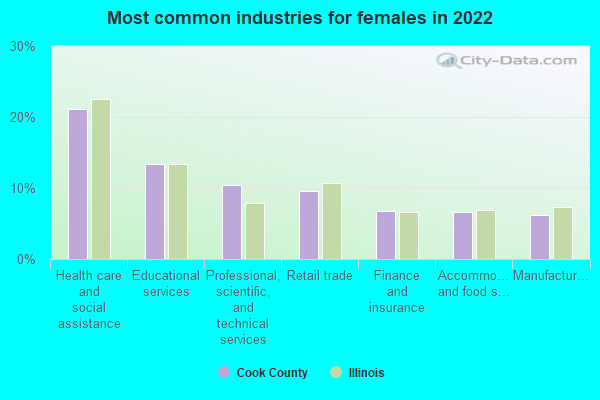
- Health care and social assistance (20%)
- Educational services (12%)
- Professional, scientific, and technical services (10%)
- Retail trade (9%)
- Finance and insurance (6%)
- Accommodation and food services (6%)
- Manufacturing (6%)
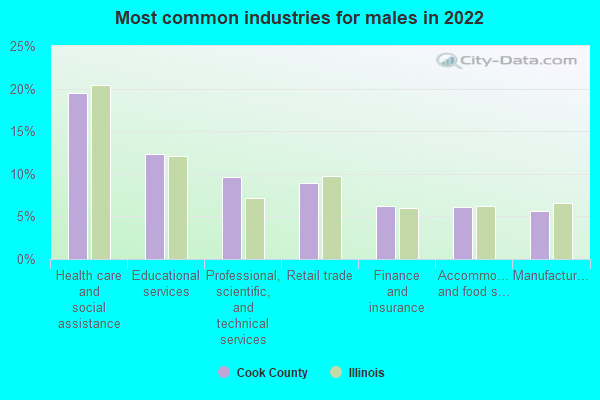
- Health care and social assistance (21%)
- Educational services (13%)
- Professional, scientific, and technical services (10%)
- Retail trade (10%)
- Finance and insurance (7%)
- Accommodation and food services (7%)
- Manufacturing (6%)
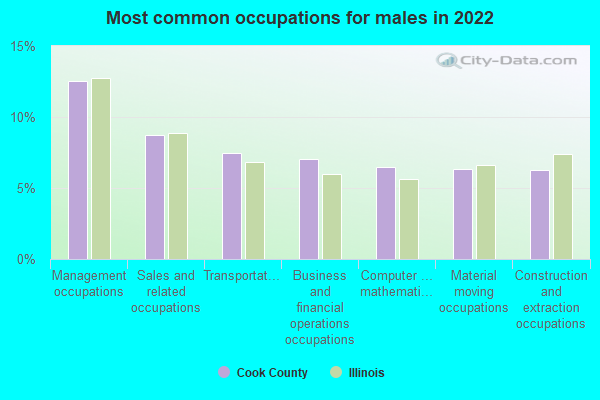
- Management occupations (13%)
- Sales and related occupations (9%)
- Transportation occupations (7%)
- Business and financial operations occupations (7%)
- Computer and mathematical occupations (6%)
- Material moving occupations (6%)
- Construction and extraction occupations (6%)
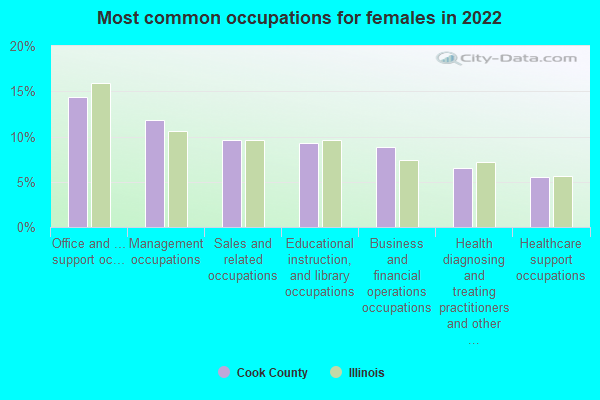
- Office and administrative support occupations (14%)
- Management occupations (12%)
- Sales and related occupations (10%)
- Educational instruction, and library occupations (9%)
- Business and financial operations occupations (9%)
- Health diagnosing and treating practitioners and other technical occupations (6%)
- Healthcare support occupations (6%)
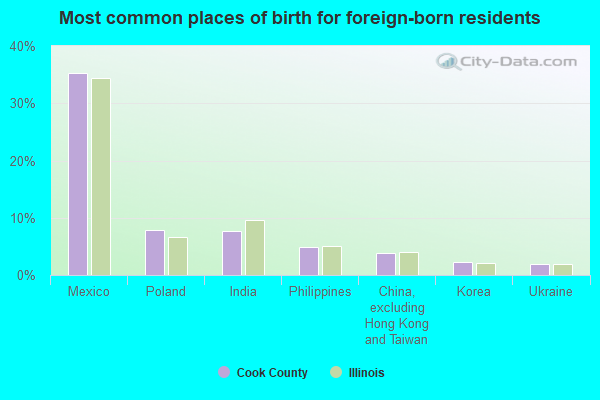
- Mexico (35%)
- Poland (8%)
- India (8%)
- Philippines (5%)
- China, excluding Hong Kong and Taiwan (4%)
- Korea (2%)
- Ukraine (2%)
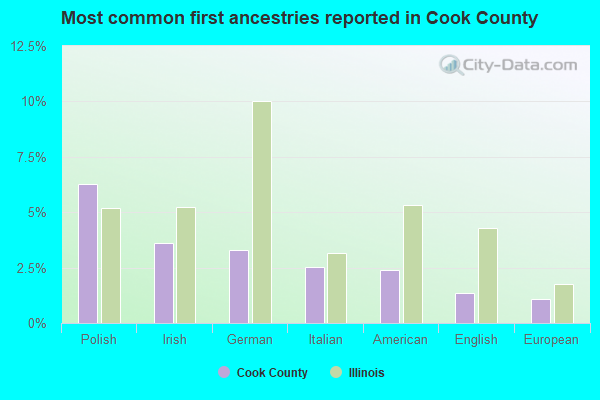
- Polish (6%)
- Irish (4%)
- German (3%)
- Italian (3%)
- American (2%)
- English (1%)
- European (1%)
People in group quarters in Cook County, Illinois in 2010:
- 31,842 people in nursing facilities/skilled-nursing facilities
- 27,674 people in college/university student housing
- 9,538 people in local jails and other municipal confinement facilities
- 5,363 people in other noninstitutional facilities
- 4,608 people in emergency and transitional shelters (with sleeping facilities) for people experiencing homelessness
- 3,285 people in group homes intended for adults
- 2,837 people in residential treatment centers for adults
- 1,323 people in correctional residential facilities
- 795 people in mental (psychiatric) hospitals and psychiatric units in other hospitals
- 750 people in workers' group living quarters and job corps centers
- 654 people in residential treatment centers for juveniles (non-correctional)
- 609 people in federal detention centers
- 343 people in group homes for juveniles (non-correctional)
- 277 people in hospitals with patients who have no usual home elsewhere
- 179 people in state prisons
- 139 people in correctional facilities intended for juveniles
- 31 people in in-patient hospice facilities
- 19 people in residential schools for people with disabilities
- 16 people in military barracks and dormitories (nondisciplinary)
People in group quarters in Cook County, Illinois in 2000:
- 31,861 people in nursing homes
- 22,643 people in college dormitories (includes college quarters off campus)
- 10,565 people in local jails and other confinement facilities (including police lockups)
- 7,997 people in other noninstitutional group quarters
- 5,513 people in other nonhousehold living situations
- 3,605 people in religious group quarters
- 1,942 people in other group homes
- 1,801 people in homes or halfway houses for drug/alcohol abuse
- 1,045 people in mental (psychiatric) hospitals or wards
- 1,020 people in homes for the mentally ill
- 966 people in schools, hospitals, or wards for the intellectually disabled
- 917 people in homes for the mentally retarded
- 876 people in hospitals/wards and hospices for chronically ill
- 876 people in other hospitals or wards for chronically ill
- 522 people in state prisons
- 473 people in federal prisons and detention centers
- 426 people in hospitals or wards for drug/alcohol abuse
- 320 people in homes for the physically handicapped
- 280 people in agriculture workers' dormitories on farms
- 271 people in homes for abused, dependent, and neglected children
- 143 people in halfway houses
- 139 people in training schools for juvenile delinquents
- 96 people in wards in general hospitals for patients who have no usual home elsewhere
- 90 people in unknown juvenile institutions
- 41 people in residential treatment centers for emotionally disturbed children
- 28 people in other workers' dormitories
- 17 people in job corps and vocational training facilities
- 13 people in short-term care, detention or diagnostic centers for delinquent children
- 4 people in institutions for the blind
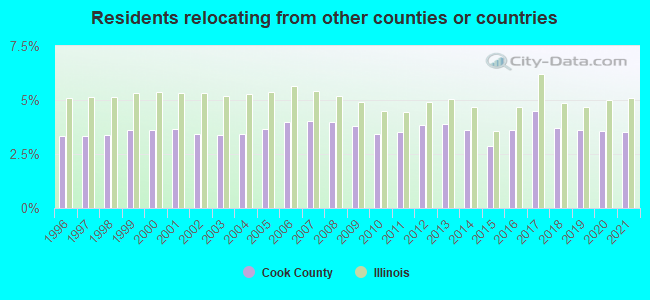
3.53% of this county's 2021 resident taxpayers lived in other counties in 2020 ($82,405 average adjusted gross income)
| Here: | 3.53% |
| Illinois average: | 5.09% |
0.01% of residents moved from foreign countries ($114 average AGI)
Cook County: 0.01% Illinois average: 0.01%
1.31% relocated from other counties in Illinois ($29,682 average AGI)
2.21% relocated from other states ($52,609 average AGI)
Cook County: 2.21% Illinois average: 2.01%
Top counties from which taxpayers relocated into this county between 2020 and 2021:
| from DuPage County, IL | |
| from Lake County, IL | |
| from Will County, IL | |
| from Kane County, IL | |
| from Lake County, IN | |
| from McHenry County, IL | |
| from Los Angeles County, CA |
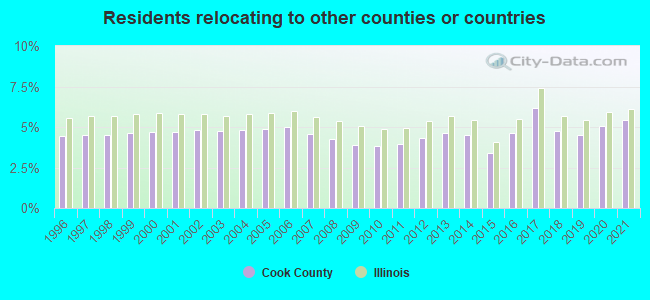
5.44% of this county's 2020 resident taxpayers moved to other counties in 2021 ($120,340 average adjusted gross income)
| Here: | 5.44% |
| Illinois average: | 6.10% |
0.01% of residents moved to foreign countries ($140 average AGI)
Cook County: 0.01% Illinois average: 0.01%
2.12% relocated to other counties in Illinois ($33,322 average AGI)
3.31% relocated to other states ($86,878 average AGI)
Cook County: 3.31% Illinois average: 3.06%
Top counties to which taxpayers relocated from this county between 2020 and 2021:
| to DuPage County, IL | |
| to Will County, IL | |
| to Lake County, IL | |
| to Kane County, IL | |
| to Lake County, IN | |
| to McHenry County, IL | |
| to Maricopa County, AZ |
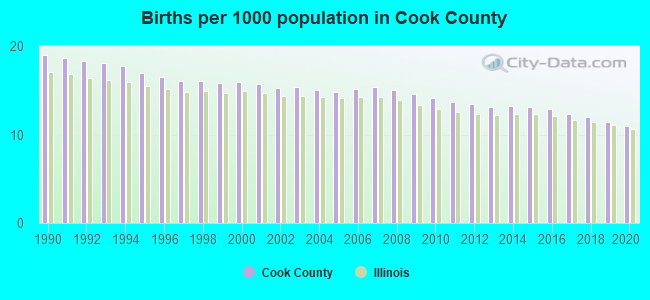
Births per 1000 population from 1990 to 1999: 17.3
Births per 1000 population from 2000 to 2009: 15.2
Births per 1000 population from 2010 to 2022: 10.8
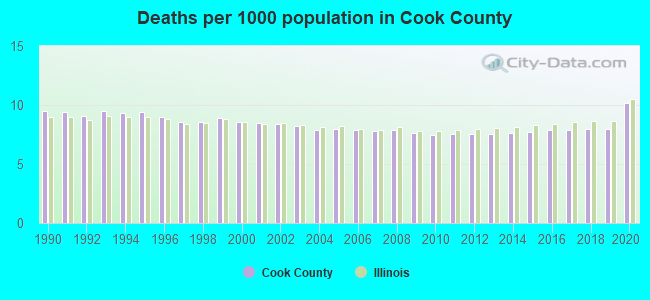
Deaths per 1000 population from 1990 to 1999: 9.1
Deaths per 1000 population from 2000 to 2009: 8.1
Deaths per 1000 population from 2010 to 2020: 7.9
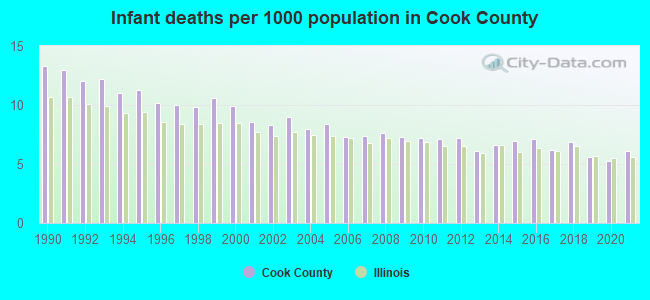
Infant deaths per 1000 live births from 1990 to 1999: 11.3
Infant deaths per 1000 live births from 2000 to 2009: 8.2
Infant deaths per 1000 live births from 2010 to 2021: 6.5
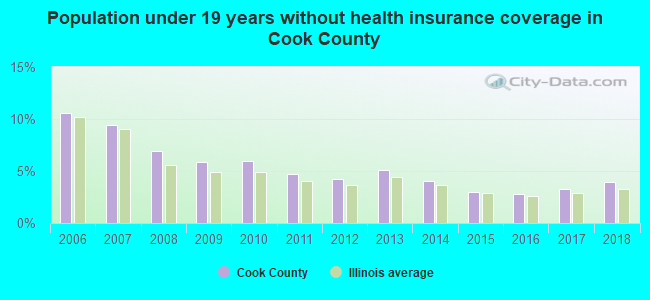
Persons under 19 years old without health insurance coverage in 2018: 3.9%
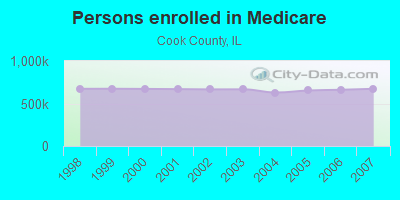
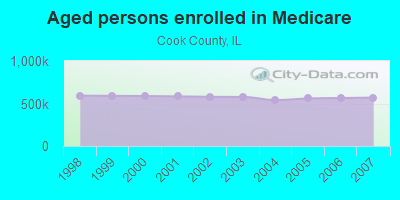
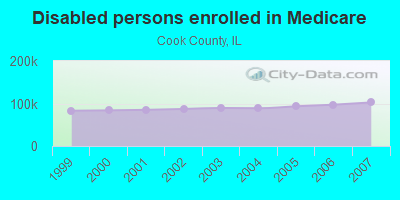
Persons enrolled in hospital insurance and/or supplemental medical insurance (Medicare) in July 1, 2007: 672,717 (570,166 aged, 102,551 disabled)
Children under 18 without health insurance coverage in 2007: 142,577 (10%)
Most common underlying causes of death in Cook County, Illinois in 1999 - 2019:
- Atherosclerotic heart disease (63,958)
- Acute myocardial infarction, unspecified (52,456)
- Bronchus or lung, unspecified - Malignant neoplasms (51,007)
- Unspecified dementia (28,006)
- Atherosclerotic cardiovascular disease, so described (25,955)
- Chronic obstructive pulmonary disease, unspecified (24,267)
- Stroke, not specified as haemorrhage or infarction (24,079)
- Alzheimer disease, unspecified (20,141)
- Congestive heart failure (19,607)
- Pneumonia, unspecified (19,025)
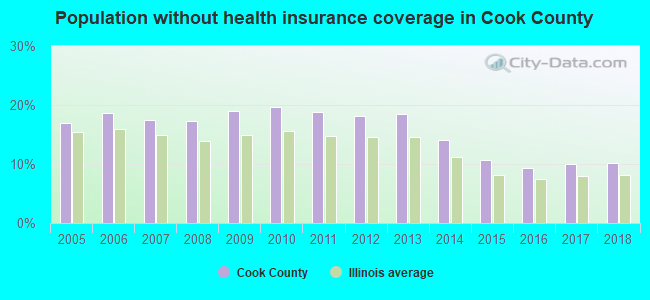
Population without health insurance coverage in 2000: 16%
Children under 18 without health insurance coverage in 2000: 12%
Short term general hospital admissions per 100,000 population in 2004: 15,143
Short term general hospital beds per 100,000 population in 2004: 321
Emergency room visits per 100,000 population in 2004: 41,270
General practice office based MDs per 100,000 population in 2005: 1,484
Medical specialist MDs per 100,000 population in 2005: 814
Dentists per 100,000 population in 1998: 10
Total births per 100,000 population, July 2005 - July 2006 : 65
Total deaths per 100,000 population, July 2005 - July 2006: 89
Limited-service eating places per 100,000 population in 2005 : 8
Beer, wine & liquor stores per 100,000 population in 2005: 1
Fitness & recreation sports centers per 100,000 population in 2005: 9,454
EPA green book nonattainment status in 2004-2006: 1
Homicides per 1,000,000 population from 2000 to 2006: 133.8. This is more than state average.
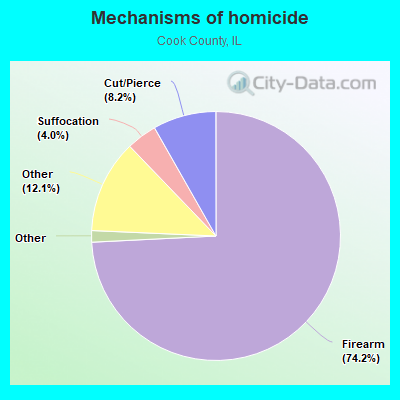
- Firearm - 99.3
- Cut/Pierce - 11.0
- Suffocation - 5.3
- Fire/Burn - 1.1
- Struck by/against - 0.9
- Other - 16.2
Suicides per 1,000,000 population from 2000 to 2006: 72.2. This is less than state average.
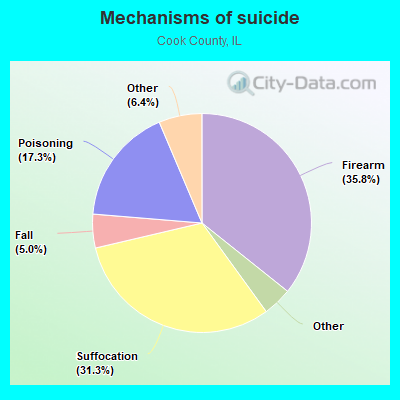
- Firearm - 25.8
- Suffocation - 22.6
- Poisoning - 12.5
- Fall - 3.6
- Cut/Pierce - 1.9
- Drowning - 1.3
- Other - 4.6
Household type by relationship:
Households: 5,109,292- Male householders: 1,006,154 (323,219 living alone), Female householders: 1,104,344 (410,779 living alone)
802,592 spouses (788,096 opposite-sex spouses), 153,016 unmarried partners, (141,114 opposite-sex unmarried partners), 1,429,798 children (1,373,972 natural, 20,312 adopted, 35,514 stepchildren), 136,655 grandchildren, 75,869 brothers or sisters, 79,688 parents, 1,328 foster children, 96,675 other relatives, 142,778 non-relatives
- In group quarters: 80,395
Size of family households: 489,956 2-persons, 285,360 3-persons, 247,721 4-persons, 110,619 5-persons, 42,529 6-persons, 30,626 7-or-more-persons.
Size of nonfamily households: 733,998 1-person, 144,650 2-persons, 18,357 3-persons, 4,902 4-persons, 1,221 5-persons, 118 6-persons, 441 7-or-more-persons.
590,223 married couples with children.
326,072 single-parent households (71,125 men, 254,947 women).
64.2% of residents of Cook speak English at home.
20.9% of residents speak Spanish at home (59% speak English very well, 20% speak English well, 15% speak English not well, 6% don't speak English at all).
8.6% of residents speak other Indo-European language at home (64% speak English very well, 22% speak English well, 12% speak English not well, 3% don't speak English at all).
4.4% of residents speak Asian or Pacific Island language at home (60% speak English very well, 24% speak English well, 12% speak English not well, 4% don't speak English at all).
1.9% of residents speak other language at home (71% speak English very well, 20% speak English well, 7% speak English not well, 2% don't speak English at all).
In fiscal year 2004:
Federal Government expenditure: $32,974,429,000 ($6,189 per capita)
Department of Defense expenditure: $1,506,095,000
Federal direct payments to individuals for retirement and disability: $9,935,576,000
Federal other direct payments to individuals: $7,747,334,000
Federal direct payments not to individuals: $393,883,000
Federal grants: $8,346,084,000
Federal procurement contracts: $3,516,075,000 ($1,253,127,000 Department of Defense)
Federal salaries and wages: $3,035,477,000 ($125,218,000 Department of Defense)
Federal Government direct loans: $669,839,000
Federal guaranteed/insured loans: $2,922,277,000
Federal Government insurance: $2,163,875,000
Population change from April 1, 2000 to July 1, 2005:
Births: 438,660| Here: | 83 per 1000 residents |
| State: | 75 per 1000 residents |
Deaths: 233,819
| Here: | 44 per 1000 residents |
| State: | 43 per 1000 residents |
Net international migration: +222,123
| Here: | +42 per 1000 residents |
| State: | +26 per 1000 residents |
Net internal migration: -500,099
| Here: | |
| State: |
Total withdrawal of fresh water for public supply: 1043.16 millions of gallons per day (1% from ground, 99% from surface)
| Here: | 6.1 |
| State: | 6.4 |
| Here: | 4.0 |
| State: | 4.1 |
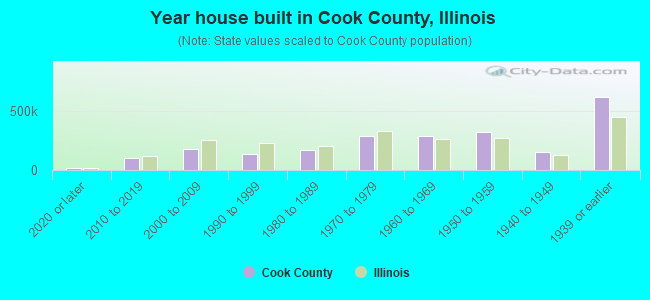
- Year house built in Cook County, Illinois
- 13,0122020 or later
- 104,8822010 to 2019
- 182,7352000 to 2009
- 132,5071990 to 1999
- 166,1421980 to 1989
- 287,2721970 to 1979
- 291,8561960 to 1969
- 323,7681950 to 1959
- 150,6121940 to 1949
- 618,1661939 or earlier
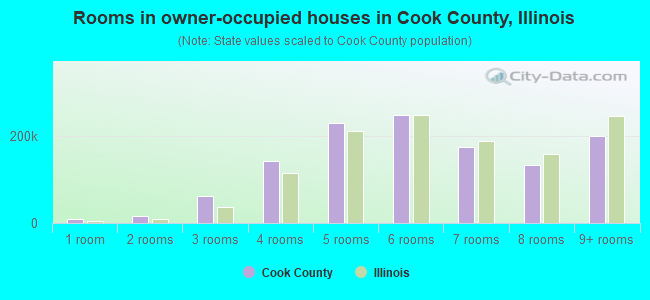
- Rooms in owner-occupied houses in Cook County, Illinois
- 8,9291 room
- 15,0902 rooms
- 62,0393 rooms
- 142,0124 rooms
- 228,2475 rooms
- 247,3276 rooms
- 174,6207 rooms
- 133,4628 rooms
- 199,3429+ rooms
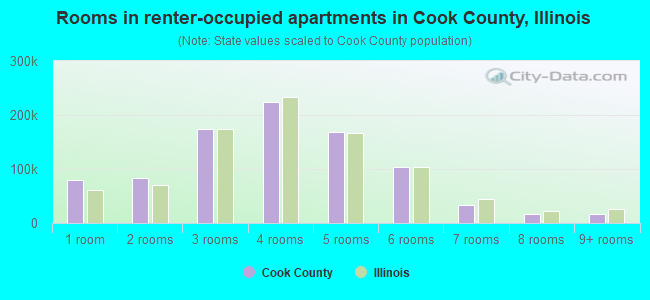
- Rooms in renter-occupied apartments in Cook County, Illinois
- 79,4781 room
- 83,9212 rooms
- 173,8803 rooms
- 223,6784 rooms
- 168,2985 rooms
- 103,5636 rooms
- 33,3507 rooms
- 16,4958 rooms
- 16,7679+ rooms
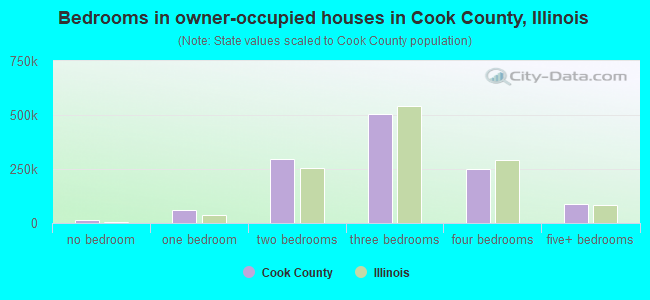
- Bedrooms in owner-occupied houses in Cook County, Illinois
- 12,309no bedroom
- 60,7721 bedroom
- 298,2832 bedrooms
- 504,0583 bedrooms
- 248,5794 bedrooms
- 87,0675+ bedrooms
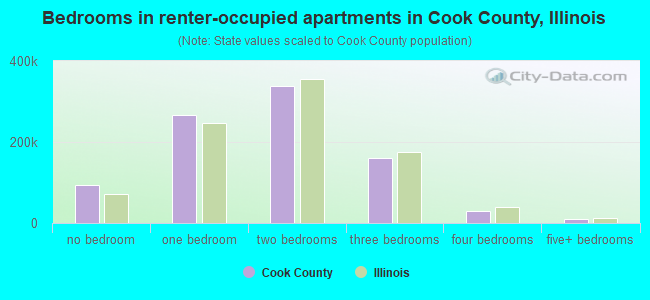
- Bedrooms in renter-occupied apartments in Cook County, Illinois
- 94,369no bedroom
- 266,3061 bedroom
- 338,3772 bedrooms
- 161,7023 bedrooms
- 28,5934 bedrooms
- 10,0835+ bedrooms
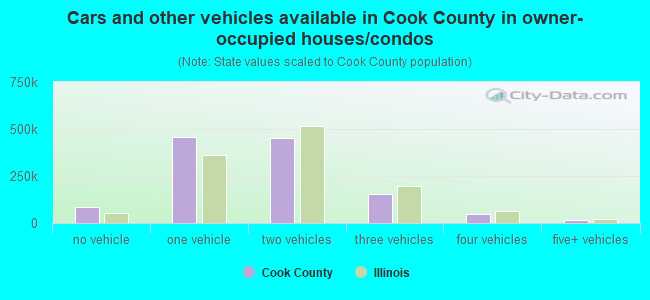
- Cars and other vehicles available in Cook County in owner-occupied houses/condos
- 86,820no vehicle
- 457,6251 vehicle
- 449,7262 vehicles
- 154,0153 vehicles
- 48,4814 vehicles
- 14,4015+ vehicles
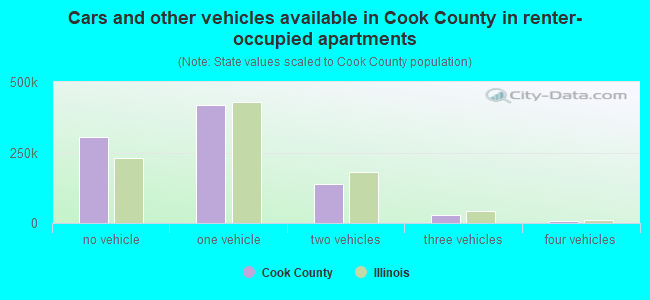
- Cars and other vehicles available in Cook County in renter-occupied apartments
- 304,586no vehicle
- 419,3301 vehicle
- 138,4192 vehicles
- 29,9353 vehicles
- 5,6334 vehicles
- 1,5275+ vehicles
87.7% of Cook County residents lived in the same house 1 years ago.
Out of people who lived in different houses, 42% lived in this county.
Out of people who lived in different counties, 31% lived in Illinois.
| Cook County: | 87.7% |
| State average: | 88.3% |
Place of birth for U.S.-born residents:
- This state: 3,115,572
- Other state: 812,462
- Northeast: 133,592
- Midwest: 324,947
- South: 253,140
- West: 100,783
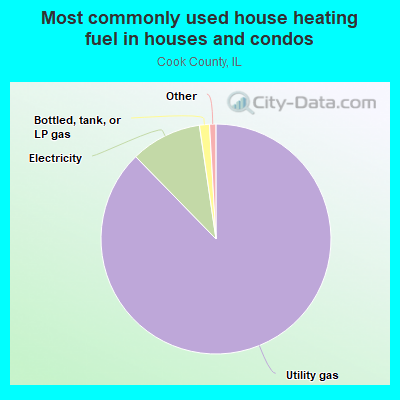
- 87.7%Utility gas
- 10.0%Electricity
- 1.4%Bottled, tank, or LP gas
- 0.4%No fuel used
- 0.3%Other fuel
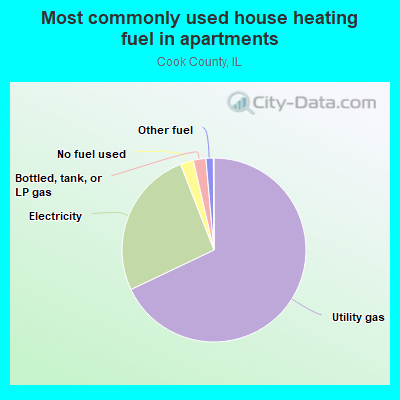
- 67.8%Utility gas
- 26.1%Electricity
- 2.3%No fuel used
- 2.2%Bottled, tank, or LP gas
- 1.3%Other fuel
- 0.1%Fuel oil, kerosene, etc.
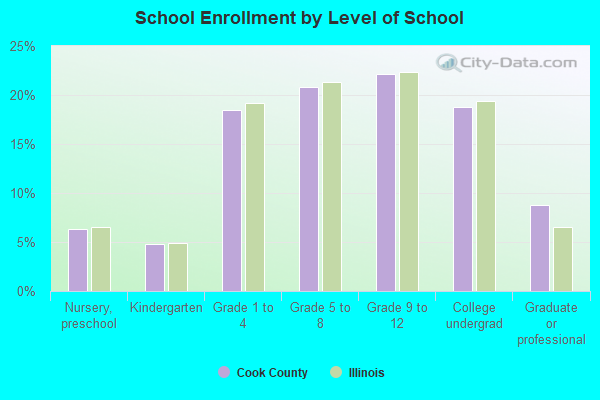
Private vs. public school enrollment:
| Here: | 14.6% |
| Illinois: | 13.3% |
| Here: | 11.7% |
| Illinois: | 9.9% |
| Here: | 37.2% |
| Illinois: | 27.4% |
Cook County government finances - Expenditure in 2020:
- Bond Funds - Cash and Securities: $134,215,000
Cash and Securities: $6,782,000
- Charges - Hospital Public: $608,677,000
Hospital Public: $276,679,000
Other: $245,746,000
Other: $221,383,000
Parks and Recreation: $66,300,000
Parks and Recreation: $58,927,000
- Construction - General Public Buildings: $111,221,000
General Public Buildings: $96,945,000
Parks and Recreation: $14,202,000
- Current Operations - Hospitals: $2,812,785,000
Hospitals: $1,543,879,000
General - Other: $534,580,000
Judicial and Legal Services: $520,519,000
Judicial and Legal Services: $437,510,000
Correctional Institutions: $376,704,000
Correctional Institutions: $351,914,000
Health - Other: $242,126,000
Natural Resources - Other: $241,187,000
Health - Other: $238,461,000
Natural Resources - Other: $199,790,000
Parks and Recreation: $127,333,000
Corrections - Other: $117,814,000
Police Protection: $104,773,000
Corrections - Other: $96,096,000
General - Other: $87,021,000
Parks and Recreation: $71,631,000
Financial Administration: $61,725,000
Financial Administration: $58,973,000
General Public Buildings: $55,048,000
Central Staff Services: $41,124,000
Public Welfare - Other: $16,215,000
Protective Inspection and Regulation - Other: $5,731,000
Protective Inspection and Regulation - Other: $5,444,000
- Federal Intergovernmental - Other: $60,564,000
Other: $14,085,000
General Local Government Support: $3,464,000
- General - Interest on Debt: $149,667,000
Interest on Debt: $6,770,000
- Local Intergovernmental - Other: $1,368,000
Highways: $1,276,000
- Long Term Debt - Beginning Outstanding - Unspecified Public Purpose: $3,397,806,000
Outstanding Unspecified Public Purpose: $3,379,916,000
Retired Unspecified Public Purpose: $230,740,000
Issue, Unspecified Public Purpose: $212,850,000
Beginning Outstanding - Unspecified Public Purpose: $142,360,000
Outstanding Unspecified Public Purpose: $141,050,000
Beginning Outstanding - Public Debt for Private Purpose: $99,503,000
Outstanding Nonguaranteed - Industrial Revenue: $98,200,000
Retired Unspecified Public Purpose: $9,370,000
Issue, Unspecified Public Purpose: $8,060,000
- Miscellaneous - Interest Earnings: $31,736,000
Fines and Forfeits: $18,948,000
General Revenue - Other: $2,182,000
Interest Earnings: $1,755,000
Fines and Forfeits: $76,000
General Revenue - Other: $37,000
- Other Capital Outlay - General - Other: $79,318,000
Parks and Recreation: $1,598,000
- Other Funds - Cash and Securities: $967,873,000
Cash and Securities: $103,120,000
- Sinking Funds - Cash and Securities: $89,503,000
- State Intergovernmental - Public Welfare: $1,162,944,000
Other: $55,777,000
General Local Government Support: $32,206,000
Health and Hospitals: $14,883,000
Health and Hospitals: $11,803,000
Other: $3,678,000
- Tax - Property: $943,044,000
General Sales and Gross Receipts: $925,024,000
General Sales and Gross Receipts: $892,708,000
Tobacco Products Sales: $127,727,000
Tobacco Products Sales: $104,523,000
Property: $103,576,000
Other Selective Sales: $101,844,000
Motor Fuels Sales: $96,327,000
Other Selective Sales: $96,011,000
Motor Fuels Sales: $90,939,000
Amusements Sales: $43,189,000
Alcoholic Beverage Sales: $37,968,000
Alcoholic Beverage Sales: $37,167,000
Other: $19,494,000
Other License: $6,713,000
Motor Vehicle License: $4,030,000
Motor Vehicle License: $3,731,000
Public Utilities Sales: $1,174,000
Alcoholic Beverage License: $318,000
- Total Salaries and Wages: $36,000,000
Cook County government finances - Revenue in 2020:
- Bond Funds - Cash and Securities: $134,215,000
Cash and Securities: $6,782,000
- Charges - Hospital Public: $608,677,000
Hospital Public: $276,679,000
Other: $245,746,000
Other: $221,383,000
Parks and Recreation: $66,300,000
Parks and Recreation: $58,927,000
- Construction - General Public Buildings: $111,221,000
General Public Buildings: $96,945,000
Parks and Recreation: $14,202,000
- Current Operations - Hospitals: $2,812,785,000
Hospitals: $1,543,879,000
General - Other: $534,580,000
Judicial and Legal Services: $520,519,000
Judicial and Legal Services: $437,510,000
Correctional Institutions: $376,704,000
Correctional Institutions: $351,914,000
Health - Other: $242,126,000
Natural Resources - Other: $241,187,000
Health - Other: $238,461,000
Natural Resources - Other: $199,790,000
Parks and Recreation: $127,333,000
Corrections - Other: $117,814,000
Police Protection: $104,773,000
Corrections - Other: $96,096,000
General - Other: $87,021,000
Parks and Recreation: $71,631,000
Financial Administration: $61,725,000
Financial Administration: $58,973,000
General Public Buildings: $55,048,000
Central Staff Services: $41,124,000
Public Welfare - Other: $16,215,000
Protective Inspection and Regulation - Other: $5,731,000
Protective Inspection and Regulation - Other: $5,444,000
- Federal Intergovernmental - Other: $60,564,000
Other: $14,085,000
General Local Government Support: $3,464,000
- General - Interest on Debt: $149,667,000
Interest on Debt: $6,770,000
- Local Intergovernmental - Other: $1,368,000
Highways: $1,276,000
- Long Term Debt - Beginning Outstanding - Unspecified Public Purpose: $3,397,806,000
Outstanding Unspecified Public Purpose: $3,379,916,000
Retired Unspecified Public Purpose: $230,740,000
Issue, Unspecified Public Purpose: $212,850,000
Beginning Outstanding - Unspecified Public Purpose: $142,360,000
Outstanding Unspecified Public Purpose: $141,050,000
Beginning Outstanding - Public Debt for Private Purpose: $99,503,000
Outstanding Nonguaranteed - Industrial Revenue: $98,200,000
Retired Unspecified Public Purpose: $9,370,000
Issue, Unspecified Public Purpose: $8,060,000
- Miscellaneous - Interest Earnings: $31,736,000
Fines and Forfeits: $18,948,000
General Revenue - Other: $2,182,000
Interest Earnings: $1,755,000
Fines and Forfeits: $76,000
General Revenue - Other: $37,000
- Other Capital Outlay - General - Other: $79,318,000
Parks and Recreation: $1,598,000
- Other Funds - Cash and Securities: $967,873,000
Cash and Securities: $103,120,000
- Sinking Funds - Cash and Securities: $89,503,000
- State Intergovernmental - Public Welfare: $1,162,944,000
Other: $55,777,000
General Local Government Support: $32,206,000
Health and Hospitals: $14,883,000
Health and Hospitals: $11,803,000
Other: $3,678,000
- Tax - Property: $943,044,000
General Sales and Gross Receipts: $925,024,000
General Sales and Gross Receipts: $892,708,000
Tobacco Products Sales: $127,727,000
Tobacco Products Sales: $104,523,000
Property: $103,576,000
Other Selective Sales: $101,844,000
Motor Fuels Sales: $96,327,000
Other Selective Sales: $96,011,000
Motor Fuels Sales: $90,939,000
Amusements Sales: $43,189,000
Alcoholic Beverage Sales: $37,968,000
Alcoholic Beverage Sales: $37,167,000
Other: $19,494,000
Other License: $6,713,000
Motor Vehicle License: $4,030,000
Motor Vehicle License: $3,731,000
Public Utilities Sales: $1,174,000
Alcoholic Beverage License: $318,000
- Total Salaries and Wages: $36,000,000
Cook County government finances - Debt in 2020:
- Bond Funds - Cash and Securities: $134,215,000
Cash and Securities: $6,782,000
- Charges - Hospital Public: $608,677,000
Hospital Public: $276,679,000
Other: $245,746,000
Other: $221,383,000
Parks and Recreation: $66,300,000
Parks and Recreation: $58,927,000
- Construction - General Public Buildings: $111,221,000
General Public Buildings: $96,945,000
Parks and Recreation: $14,202,000
- Current Operations - Hospitals: $2,812,785,000
Hospitals: $1,543,879,000
General - Other: $534,580,000
Judicial and Legal Services: $520,519,000
Judicial and Legal Services: $437,510,000
Correctional Institutions: $376,704,000
Correctional Institutions: $351,914,000
Health - Other: $242,126,000
Natural Resources - Other: $241,187,000
Health - Other: $238,461,000
Natural Resources - Other: $199,790,000
Parks and Recreation: $127,333,000
Corrections - Other: $117,814,000
Police Protection: $104,773,000
Corrections - Other: $96,096,000
General - Other: $87,021,000
Parks and Recreation: $71,631,000
Financial Administration: $61,725,000
Financial Administration: $58,973,000
General Public Buildings: $55,048,000
Central Staff Services: $41,124,000
Public Welfare - Other: $16,215,000
Protective Inspection and Regulation - Other: $5,731,000
Protective Inspection and Regulation - Other: $5,444,000
- Federal Intergovernmental - Other: $60,564,000
Other: $14,085,000
General Local Government Support: $3,464,000
- General - Interest on Debt: $149,667,000
Interest on Debt: $6,770,000
- Local Intergovernmental - Other: $1,368,000
Highways: $1,276,000
- Long Term Debt - Beginning Outstanding - Unspecified Public Purpose: $3,397,806,000
Outstanding Unspecified Public Purpose: $3,379,916,000
Retired Unspecified Public Purpose: $230,740,000
Issue, Unspecified Public Purpose: $212,850,000
Beginning Outstanding - Unspecified Public Purpose: $142,360,000
Outstanding Unspecified Public Purpose: $141,050,000
Beginning Outstanding - Public Debt for Private Purpose: $99,503,000
Outstanding Nonguaranteed - Industrial Revenue: $98,200,000
Retired Unspecified Public Purpose: $9,370,000
Issue, Unspecified Public Purpose: $8,060,000
- Miscellaneous - Interest Earnings: $31,736,000
Fines and Forfeits: $18,948,000
General Revenue - Other: $2,182,000
Interest Earnings: $1,755,000
Fines and Forfeits: $76,000
General Revenue - Other: $37,000
- Other Capital Outlay - General - Other: $79,318,000
Parks and Recreation: $1,598,000
- Other Funds - Cash and Securities: $967,873,000
Cash and Securities: $103,120,000
- Sinking Funds - Cash and Securities: $89,503,000
- State Intergovernmental - Public Welfare: $1,162,944,000
Other: $55,777,000
General Local Government Support: $32,206,000
Health and Hospitals: $14,883,000
Health and Hospitals: $11,803,000
Other: $3,678,000
- Tax - Property: $943,044,000
General Sales and Gross Receipts: $925,024,000
General Sales and Gross Receipts: $892,708,000
Tobacco Products Sales: $127,727,000
Tobacco Products Sales: $104,523,000
Property: $103,576,000
Other Selective Sales: $101,844,000
Motor Fuels Sales: $96,327,000
Other Selective Sales: $96,011,000
Motor Fuels Sales: $90,939,000
Amusements Sales: $43,189,000
Alcoholic Beverage Sales: $37,968,000
Alcoholic Beverage Sales: $37,167,000
Other: $19,494,000
Other License: $6,713,000
Motor Vehicle License: $4,030,000
Motor Vehicle License: $3,731,000
Public Utilities Sales: $1,174,000
Alcoholic Beverage License: $318,000
- Total Salaries and Wages: $36,000,000
Cook County government finances - Cash and Securities in 2020:
- Bond Funds - Cash and Securities: $134,215,000
Cash and Securities: $6,782,000
- Charges - Hospital Public: $608,677,000
Hospital Public: $276,679,000
Other: $245,746,000
Other: $221,383,000
Parks and Recreation: $66,300,000
Parks and Recreation: $58,927,000
- Construction - General Public Buildings: $111,221,000
General Public Buildings: $96,945,000
Parks and Recreation: $14,202,000
- Current Operations - Hospitals: $2,812,785,000
Hospitals: $1,543,879,000
General - Other: $534,580,000
Judicial and Legal Services: $520,519,000
Judicial and Legal Services: $437,510,000
Correctional Institutions: $376,704,000
Correctional Institutions: $351,914,000
Health - Other: $242,126,000
Natural Resources - Other: $241,187,000
Health - Other: $238,461,000
Natural Resources - Other: $199,790,000
Parks and Recreation: $127,333,000
Corrections - Other: $117,814,000
Police Protection: $104,773,000
Corrections - Other: $96,096,000
General - Other: $87,021,000
Parks and Recreation: $71,631,000
Financial Administration: $61,725,000
Financial Administration: $58,973,000
General Public Buildings: $55,048,000
Central Staff Services: $41,124,000
Public Welfare - Other: $16,215,000
Protective Inspection and Regulation - Other: $5,731,000
Protective Inspection and Regulation - Other: $5,444,000
- Federal Intergovernmental - Other: $60,564,000
Other: $14,085,000
General Local Government Support: $3,464,000
- General - Interest on Debt: $149,667,000
Interest on Debt: $6,770,000
- Local Intergovernmental - Other: $1,368,000
Highways: $1,276,000
- Long Term Debt - Beginning Outstanding - Unspecified Public Purpose: $3,397,806,000
Outstanding Unspecified Public Purpose: $3,379,916,000
Retired Unspecified Public Purpose: $230,740,000
Issue, Unspecified Public Purpose: $212,850,000
Beginning Outstanding - Unspecified Public Purpose: $142,360,000
Outstanding Unspecified Public Purpose: $141,050,000
Beginning Outstanding - Public Debt for Private Purpose: $99,503,000
Outstanding Nonguaranteed - Industrial Revenue: $98,200,000
Retired Unspecified Public Purpose: $9,370,000
Issue, Unspecified Public Purpose: $8,060,000
- Miscellaneous - Interest Earnings: $31,736,000
Fines and Forfeits: $18,948,000
General Revenue - Other: $2,182,000
Interest Earnings: $1,755,000
Fines and Forfeits: $76,000
General Revenue - Other: $37,000
- Other Capital Outlay - General - Other: $79,318,000
Parks and Recreation: $1,598,000
- Other Funds - Cash and Securities: $967,873,000
Cash and Securities: $103,120,000
- Sinking Funds - Cash and Securities: $89,503,000
- State Intergovernmental - Public Welfare: $1,162,944,000
Other: $55,777,000
General Local Government Support: $32,206,000
Health and Hospitals: $14,883,000
Health and Hospitals: $11,803,000
Other: $3,678,000
- Tax - Property: $943,044,000
General Sales and Gross Receipts: $925,024,000
General Sales and Gross Receipts: $892,708,000
Tobacco Products Sales: $127,727,000
Tobacco Products Sales: $104,523,000
Property: $103,576,000
Other Selective Sales: $101,844,000
Motor Fuels Sales: $96,327,000
Other Selective Sales: $96,011,000
Motor Fuels Sales: $90,939,000
Amusements Sales: $43,189,000
Alcoholic Beverage Sales: $37,968,000
Alcoholic Beverage Sales: $37,167,000
Other: $19,494,000
Other License: $6,713,000
Motor Vehicle License: $4,030,000
Motor Vehicle License: $3,731,000
Public Utilities Sales: $1,174,000
Alcoholic Beverage License: $318,000
- Total Salaries and Wages: $36,000,000
Supplemental Security Income (SSI) in 2006:
- Total number of recipients: 155,185
- Number of aged recipients: 21,311
- Number of blind and disabled recipients: 133,874
- Number of recipients under 18: 25,218
- Number of recipients between 18 and 64: 89,321
- Number of recipients older than 64: 40,646
- Number of recipients also receiving OASDI: 33,381
- Amount of payments (thousands of dollars): 76,036
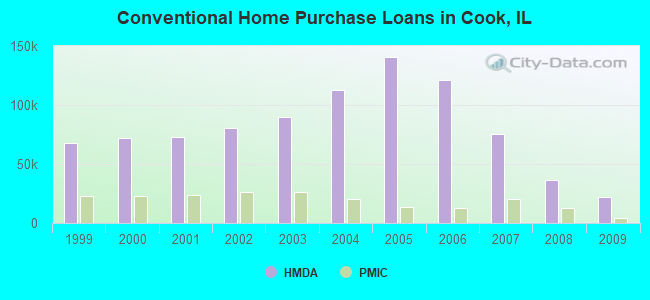
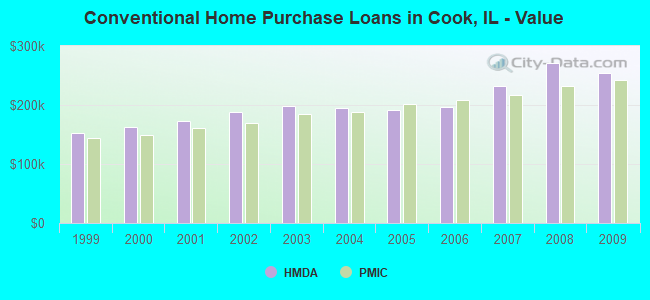
| Home Mortgage Disclosure Act Aggregated Statistics For Year 2009 (Based on 1323 full tracts) | ||||||||||||||
| A) FHA, FSA/RHS & VA Home Purchase Loans | B) Conventional Home Purchase Loans | C) Refinancings | D) Home Improvement Loans | E) Loans on Dwellings For 5+ Families | F) Non-occupant Loans on < 5 Family Dwellings (A B C & D) | G) Loans On Manufactured Home Dwelling (A B C & D) | ||||||||
|---|---|---|---|---|---|---|---|---|---|---|---|---|---|---|
| Number | Average Value | Number | Average Value | Number | Average Value | Number | Average Value | Number | Average Value | Number | Average Value | Number | Average Value | |
| LOANS ORIGINATED | 12,642 | $195,809 | 22,094 | $253,741 | 103,871 | $249,351 | 3,235 | $109,252 | 1,006 | $862,964 | 7,778 | $222,745 | 200 | $209,230 |
| APPLICATIONS APPROVED, NOT ACCEPTED | 1,051 | $184,794 | 2,377 | $281,386 | 10,847 | $250,225 | 650 | $59,346 | 57 | $602,316 | 852 | $219,359 | 33 | $86,606 |
| APPLICATIONS DENIED | 3,914 | $188,129 | 5,806 | $231,079 | 36,666 | $241,800 | 4,116 | $57,139 | 202 | $941,173 | 3,887 | $200,422 | 163 | $33,344 |
| APPLICATIONS WITHDRAWN | 1,744 | $182,241 | 2,329 | $257,229 | 16,248 | $232,951 | 704 | $111,041 | 59 | $2,802,102 | 1,424 | $205,461 | 8 | $118,625 |
| FILES CLOSED FOR INCOMPLETENESS | 887 | $187,932 | 964 | $247,672 | 7,418 | $232,857 | 394 | $90,216 | 18 | $994,889 | 495 | $197,089 | 5 | $77,800 |
| Private Mortgage Insurance Companies Aggregated Statistics For Year 2009 (Based on 1133 full tracts) | ||||||||
| A) Conventional Home Purchase Loans | B) Refinancings | C) Non-occupant Loans on < 5 Family Dwellings (A & B) | D) Loans On Manufactured Home Dwelling (A & B) | |||||
|---|---|---|---|---|---|---|---|---|
| Number | Average Value | Number | Average Value | Number | Average Value | Number | Average Value | |
| LOANS ORIGINATED | 3,852 | $241,991 | 2,003 | $261,364 | 57 | $269,298 | 0 | $0 |
| APPLICATIONS APPROVED, NOT ACCEPTED | 1,749 | $234,501 | 1,387 | $252,198 | 111 | $198,423 | 0 | $0 |
| APPLICATIONS DENIED | 848 | $226,302 | 858 | $251,294 | 19 | $284,368 | 1 | $230,000 |
| APPLICATIONS WITHDRAWN | 430 | $245,312 | 436 | $254,417 | 15 | $214,667 | 1 | $230,000 |
| FILES CLOSED FOR INCOMPLETENESS | 223 | $221,942 | 127 | $236,362 | 38 | $204,921 | 0 | $0 |
| Most common first names in Cook County, IL among deceased individuals | ||
| Name | Count | Lived (average) |
|---|---|---|
| John | 45,210 | 74.0 years |
| Mary | 37,930 | 79.3 years |
| Joseph | 28,064 | 74.9 years |
| William | 27,468 | 73.4 years |
| James | 24,085 | 70.3 years |
| Robert | 20,468 | 69.0 years |
| Frank | 20,156 | 75.5 years |
| Helen | 18,933 | 79.6 years |
| Edward | 18,924 | 73.1 years |
| Anna | 18,849 | 82.6 years |
| Most common last names in Cook County, IL among deceased individuals | ||
| Last name | Count | Lived (average) |
|---|---|---|
| Johnson | 12,683 | 73.5 years |
| Smith | 10,715 | 72.6 years |
| Williams | 9,168 | 70.6 years |
| Brown | 7,176 | 71.9 years |
| Jones | 7,107 | 71.0 years |
| Anderson | 5,733 | 76.0 years |
| Miller | 5,570 | 74.8 years |
| Davis | 5,233 | 71.2 years |
| Jackson | 4,569 | 70.5 years |
| Thomas | 4,072 | 71.2 years |
| Businesses in Cook County, IL | ||||
| Name | Count | Name | Count | |
|---|---|---|---|---|
| 7-Eleven | 185 | Jimmy John's | 68 | |
| ALDI | 56 | JoS. A. Bank | 12 | |
| ALDO | 16 | Johnny Rockets | 4 | |
| AMF Bowling | 4 | Jones New York | 56 | |
| AT&T | 51 | Journeys | 8 | |
| Abercrombie & Fitch | 6 | Just Tires | 11 | |
| Abercrombie Kids | 5 | Justice | 15 | |
| Ace Hardware | 59 | KFC | 61 | |
| Advance Auto Parts | 44 | Kincaid | 8 | |
| Aeropostale | 8 | Kmart | 15 | |
| Aerosoles | 2 | Knights Inn | 1 | |
| American Eagle Outfitters | 9 | Kohl's | 17 | |
| Ann Taylor | 19 | Kroger | 12 | |
| Apple Store | 6 | LA Fitness | 29 | |
| Applebee's | 13 | La Quinta | 6 | |
| Arby's | 21 | La-Z-Boy | 10 | |
| Ascend Collection | 1 | Lane Bryant | 15 | |
| Ashley Furniture | 4 | Lane Furniture | 29 | |
| Audi | 4 | LensCrafters | 22 | |
| AutoZone | 74 | Levi Strauss & Co. | 4 | |
| Avenue | 14 | Little Caesars Pizza | 46 | |
| BMW | 3 | Long John Silver's | 12 | |
| Bakers | 9 | Lowe's | 9 | |
| Bakers Square | 13 | Macy's | 9 | |
| Bally Total Fitness | 21 | Marriott | 32 | |
| Banana Republic | 9 | Marshalls | 28 | |
| Barnes & Noble | 10 | MasterBrand Cabinets | 160 | |
| Baskin-Robbins | 167 | Mazda | 7 | |
| Bath & Body Works | 21 | McDonald's | 230 | |
| Baymont Inn | 1 | Meijer | 3 | |
| Bebe | 7 | Men's Wearhouse | 27 | |
| Bed Bath & Beyond | 15 | Menards | 15 | |
| Ben & Jerry's | 6 | Motel 6 | 7 | |
| Best Western | 11 | Motherhood Maternity | 22 | |
| Blockbuster | 43 | New Balance | 41 | |
| Brooks Brothers | 4 | New York & Co | 10 | |
| Brookstone | 4 | Nike | 341 | |
| Brunswick Bowling & Billiards | 6 | Nissan | 13 | |
| Budget Car Rental | 12 | Nordstrom | 8 | |
| Buffalo Wild Wings | 10 | Office Depot | 20 | |
| Burger King | 93 | OfficeMax | 21 | |
| Buybuy BABY | 1 | Old Country Buffet | 13 | |
| CVS | 113 | Old Navy | 16 | |
| Cache | 6 | Olive Garden | 8 | |
| CarMax | 5 | On The Border | 1 | |
| Caribou Coffee | 28 | Outback | 6 | |
| Carson Pirie Scott | 17 | Outback Steakhouse | 6 | |
| Casual Male XL | 11 | Pac Sun | 7 | |
| Catherines | 9 | Panda Express | 44 | |
| Charlotte Russe | 9 | Panera Bread | 40 | |
| Chevrolet | 15 | Papa John's Pizza | 12 | |
| Chick-Fil-A | 1 | Payless | 81 | |
| Chico's | 8 | Penske | 32 | |
| Chipotle | 42 | PetSmart | 17 | |
| Chuck E. Cheese's | 9 | Pier 1 Imports | 14 | |
| Church's Chicken | 20 | Pizza Hut | 35 | |
| Cinnabon | 8 | Plato's Closet | 5 | |
| Circle K | 22 | Popeyes | 66 | |
| Clarion | 1 | Pottery Barn | 3 | |
| Clarks | 3 | Pottery Barn Kids | 2 | |
| Cold Stone Creamery | 10 | Qdoba Mexican Grill | 13 | |
| Coldwater Creek | 3 | Quality | 3 | |
| ColorTyme | 1 | Quiznos | 32 | |
| Comfort Inn | 9 | RadioShack | 73 | |
| Comfort Suites | 6 | Red Lobster | 6 | |
| Costco | 7 | Red Robin | 4 | |
| Cracker Barrel | 1 | Red Roof Inn | 4 | |
| Crate & Barrel | 6 | Rodeway Inn | 1 | |
| Cricket Wireless | 248 | Ruby Tuesday | 6 | |
| Curves | 33 | Ryder Rental & Truck Leasing | 5 | |
| DHL | 49 | SAS Shoes | 11 | |
| Dairy Queen | 28 | SONIC Drive-In | 4 | |
| Days Inn | 2 | Safeway | 45 | |
| Deb | 5 | Saks Fifth Avenue | 2 | |
| Decora Cabinetry | 18 | Sam's Club | 11 | |
| Dennys | 15 | Sears | 48 | |
| Discount Tire | 7 | Sephora | 9 | |
| Domino's Pizza | 36 | Sheraton | 4 | |
| DressBarn | 12 | Shoe Carnival | 9 | |
| Dressbarn | 13 | Skechers USA | 5 | |
| Dunkin Donuts | 318 | Sleep Inn | 3 | |
| Econo Lodge | 1 | Soma Intimates | 3 | |
| Eddie Bauer | 5 | Spencer Gifts | 7 | |
| El Pollo Loco | 1 | Sprint Nextel | 62 | |
| Ethan Allen | 4 | Staples | 26 | |
| Express | 14 | Starbucks | 236 | |
| Extended Stay America | 11 | Steak 'n Shake | 10 | |
| Extended Stay Deluxe | 1 | Subaru | 6 | |
| Famous Footwear | 19 | Subway | 201 | |
| Fashion Bug | 7 | Super 8 | 9 | |
| FedEx | 603 | T-Mobile | 88 | |
| Finish Line | 11 | T.G.I. Driday's | 11 | |
| Firestone Complete Auto Care | 32 | T.J.Maxx | 14 | |
| Foot Locker | 33 | Taco Bell | 57 | |
| Ford | 5 | Talbots | 5 | |
| Forever 21 | 13 | Target | 34 | |
| Fredericks Of Hollywood | 2 | The Athlete's Foot | 17 | |
| GNC | 61 | The Cheesecake Factory | 4 | |
| GameStop | 85 | The Limited | 7 | |
| Gap | 18 | The Room Place | 13 | |
| Goodwill | 3 | Torrid | 5 | |
| Gymboree | 7 | Toyota | 13 | |
| H&M | 5 | Toys"R"Us | 27 | |
| H&R Block | 185 | Trader Joe's | 12 | |
| Haagen-Dazs | 3 | True Value | 40 | |
| Haworth | 3 | U-Haul | 130 | |
| Hilton | 38 | U.S. Cellular | 31 | |
| Hobby Lobby | 6 | UPS | 735 | |
| Holiday Inn | 39 | Urban Outfitters | 7 | |
| Hollister Co. | 6 | Value City Furniture | 8 | |
| Home Depot | 31 | Vans | 21 | |
| Homestead Studio Suites | 2 | Verizon Wireless | 36 | |
| Honda | 11 | Victoria's Secret | 17 | |
| Hot Topic | 6 | Volkswagen | 10 | |
| Houlihan's | 4 | Vons | 45 | |
| Howard Johnson | 1 | Walgreens | 136 | |
| Hyatt | 6 | Walmart | 20 | |
| Hyundai | 12 | Wendy's | 66 | |
| IHOP | 22 | Westin | 4 | |
| IKEA | 1 | Wet Seal | 9 | |
| InTown Suites | 1 | White Castle | 43 | |
| J. Jill | 4 | Whole Foods Market | 12 | |
| J.Crew | 6 | Wingate | 2 | |
| JCPenney | 7 | World Gym | 6 | |
| Jamba Juice | 18 | YMCA | 27 | |
| Jewel-Osco | 90 | Z Gallerie | 2 | |
Cook County on our top lists:
- #1 on the list of "Top 101 counties with the most Black Protestant congregations"
- #1 on the list of "Top 101 counties with the most Black Protestant congregations (pop. 50,000+)"
- #1 on the list of "Top 101 counties with the most Catholic congregations (pop. 50,000+)"
- #1 on the list of "Top 101 counties with the most Catholic congregations"
- #1 on the list of "Top 101 counties with the highest surface withdrawal of fresh water for public supply"
- #1 on the list of "Top 101 counties with the highest surface withdrawal of fresh water for public supply (pop. 50,000+)"
- #2 on the list of "Top 101 counties with the most Black Protestant adherents"
- #2 on the list of "Top 101 counties with the most Black Protestant adherents (pop. 50,000+)"
- #2 on the list of "Top 101 counties with the most Orthodox congregations (pop. 50,000+)"
- #2 on the list of "Top 101 counties with the most Orthodox adherents (pop. 50,000+)"
- #2 on the list of "Top 101 counties with the most Orthodox adherents"
- #2 on the list of "Top 101 counties with the most Mainline Protestant congregations (pop. 50,000+)"
- #2 on the list of "Top 101 counties with the most Mainline Protestant congregations"
- #2 on the list of "Top 101 counties with the most Orthodox congregations"
- #2 on the list of "Top 101 counties with the most Catholic adherents (pop. 50,000+)"
- #2 on the list of "Top 101 counties with the most Catholic adherents"
- #2 on the list of "Top 101 counties with the highest total withdrawal of fresh water for public supply"
- #2 on the list of "Top 101 counties with the highest total withdrawal of fresh water for public supply (pop. 50,000+)"
- #3 on the list of "Top 101 counties with the most Mainline Protestant adherents"
- #3 on the list of "Top 101 counties with the most Mainline Protestant adherents (pop. 50,000+)"