Estimated zip code population in 2022: 2,886 Zip code population in 2010: 2,886 Zip code population in 2000: 2,770
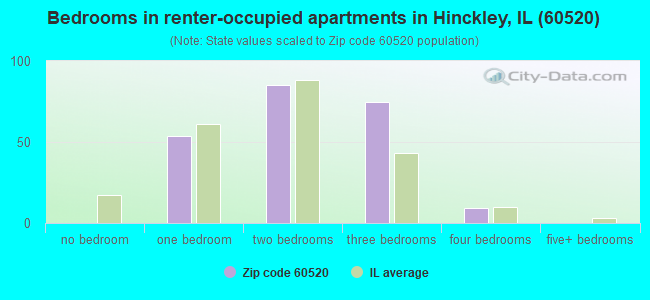
Houses and condos: 1,171 Renter-occupied apartments: 227
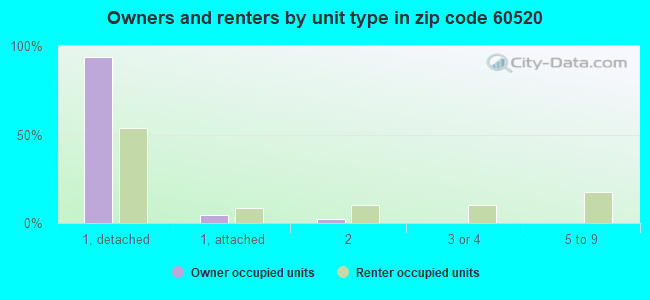
% of renters here:
20%
State:
33%
March 2022 cost of living index in zip code 60520: 96.1 (near average, U.S. average is 100)
Land area: 44.9 sq. mi. Water area: 0.2 sq. mi.
Population density: 64 people per square mile
(very low).
OSM Map
General Map
Google Map
MSN Map
OSM Map
General Map
Google Map
MSN Map
OSM Map
General Map
Google Map
MSN Map
OSM Map
General Map
Google Map
MSN Map
Please wait while loading the map...
Real estate property taxes paid for housing units in 2022:
This zip code:
2.1% ($6,398)
Illinois:
2.0% ($4,912)
Median real estate property taxes paid for housing units with mortgages in 2022: $6,422 (2.1%) Median real estate property taxes paid for housing units with no mortgage in 2022: $6,394 (2.2%)
Business Search- 14 Million verified businesses
Males: 1,501
(52.0%)
Females: 1,385
(48.0%)
For population 25 years and over in 60520:
High school or higher: 95.5%
Bachelor's degree or higher: 30.1%
Graduate or professional degree: 11.2%
Unemployed: 12.7%
Mean travel time to work (commute): 31.8 minutes
For population 15 years and over in 60520:
Never married: 29.2%
Now married: 49.5%
Separated: 1.9%
Widowed: 4.8%
Divorced: 14.5%
Zip code 60520 compared to state average:
Unemployed percentage above state average.
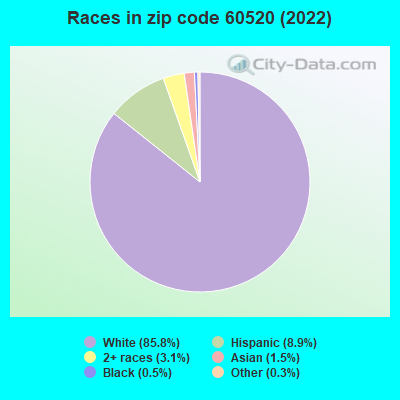
Black race population percentage significantly below state average.
Hispanic race population percentage below state average.
Foreign-born population percentage significantly below state average.
Renting percentage below state average.
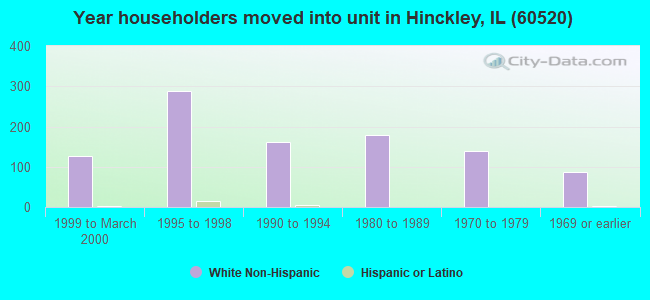
Length of stay since moving in significantly above state average.
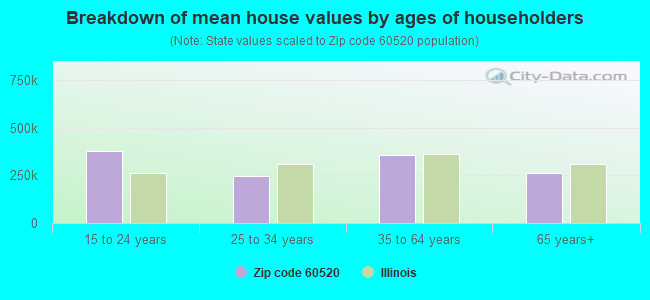
Estimated median house/condo value in 2022: $300,636
60520:
$300,636
Illinois:
$251,600
According to our research of Illinois and other state lists, there were 4 registered sex offenders living in 60520 zip code as of May 28, 2024. The ratio of all residents to sex offenders in zip code 60520 is 715 to 1. The ratio of registered sex offenders to all residents in this zip code is near the state average.
Median resident age:
This zip code:
39.1 years
Illinois median age:
39.1 years
Average household size:
This zip code:
2.5 people
Illinois:
2.4 people
Averages for the 2020 tax year for zip code 60520, filed in 2021:
Average Adjusted Gross Income (AGI) in 2020: $69,639 (Individual Income Tax Returns)
Here:
$69,639
State:
$82,626
Salary/wage: $60,044 (reported on 82.4% of returns)
Here:
$60,044
State:
$66,640
(% of AGI for various income ranges: 1146.2% for AGIs below $25k, 3467.3% for AGIs $25k-50k, 5588.4% for AGIs $50k-75k, 8708.0% for AGIs $75k-100k, 14999.0% for AGIs $100k-200k)
Taxable interest for individuals: $827 (reported on 35.9% of returns)
This zip code:
$827
Illinois:
$2,376
(% of AGI for various income ranges: 18.5% for AGIs below $25k, 24.6% for AGIs $25k-50k, 38.4% for AGIs $50k-75k, 49.0% for AGIs $75k-100k, 54.8% for AGIs $100k-200k)
Ordinary dividends: $3,126 (reported on 23.9% of returns)
Here:
$3,126
State:
$9,061
(% of AGI for various income ranges: 48.1% for AGIs below $25k, 31.2% for AGIs $25k-50k, 92.1% for AGIs $50k-75k, 140.0% for AGIs $75k-100k, 157.6% for AGIs $100k-200k)
Net capital gain/loss in AGI: +$4,080 (reported on 21.1% of returns)
Here:
+$4,080
State:
+$31,684
(% of AGI for various income ranges: 11.9% for AGIs below $25k, 37.7% for AGIs $25k-50k, 32.1% for AGIs $50k-75k, 159.0% for AGIs $75k-100k, 251.4% for AGIs $100k-200k)
Profit/loss from business: +$9,930 (reported on 14.1% of returns)
Here:
+$9,930
State:
+$12,175
(% of AGI for various income ranges: 85.0% for AGIs below $25k, 96.5% for AGIs $25k-50k, 154.7% for AGIs $50k-75k, 166.0% for AGIs $75k-100k, 501.9% for AGIs $100k-200k)
Taxable individual retirement arrangement distribution: $17,206 (reported on 11.3% of returns)
60520:
$17,206
Illinois:
$21,613
(% of AGI for various income ranges: 75.8% for AGIs below $25k, 85.8% for AGIs $25k-50k, 330.0% for AGIs $50k-75k, 290.0% for AGIs $75k-100k, 674.3% for AGIs $100k-200k)
Total itemized deductions: $24,290 (reported on 7.0% of returns)
Here:
$24,290
State:
$34,948
(% of AGI for various income ranges: 151.5% for AGIs below $25k, 420.0% for AGIs $50k-75k, 589.0% for AGIs $100k-200k)
Charity contributions: $4,214 (reported on 4.9% of returns)
Here:
$4,214
State:
$13,122
(% of AGI for various income ranges: 29.5% for AGIs $50k-75k, 113.8% for AGIs $100k-200k)
Taxes paid: $8,710 (reported on 7.0% of returns)
60520:
$8,710
State:
$8,563
(% of AGI for various income ranges: 53.1% for AGIs below $25k, 169.5% for AGIs $50k-75k, 195.7% for AGIs $100k-200k)
Earned income credit: $1,960 (reported on 10.6% of returns)
Here:
$1,960
State:
$2,311
(% of AGI for various income ranges: 63.8% for AGIs below $25k, 49.2% for AGIs $25k-50k)
Percentage of individuals using paid preparers for their 2020 taxes: 93.7%
Here:
94%
State:
93%
(% for various income ranges: 92.1% for AGIs below $25k, 93.5% for AGIs $25k-50k, 91.7% for AGIs $50k-75k, 100.0% for AGIs $75k-100k, 93.5% for AGIs $100k-200k, 100.0% for AGIs over 200k)
Averages for the 2012 tax year for zip code 60520, filed in 2013:
Average Adjusted Gross Income (AGI) in 2012: $60,512 (Individual Income Tax Returns)
Here:
$60,512
State:
$68,058
Salary/wage: $49,996 (reported on 85.0% of returns)
Here:
$49,996
State:
$55,396
(% of AGI for various income ranges: 70.0% for AGIs below $25k, 74.9% for AGIs $25k-50k, 74.4% for AGIs $50k-75k, 80.7% for AGIs $75k-100k, 74.0% for AGIs $100k-200k, 38.7% for AGIs over 200k)
Taxable interest for individuals: $959 (reported on 38.6% of returns)
This zip code:
$959
Illinois:
$1,969
(% of AGI for various income ranges: 1.1% for AGIs below $25k, 0.7% for AGIs $25k-50k, 0.6% for AGIs $50k-75k, 0.5% for AGIs $75k-100k, 0.6% for AGIs $100k-200k, 0.5% for AGIs over 200k)
Ordinary dividends: $2,714 (reported on 26.4% of returns)
Here:
$2,714
State:
$7,786
(% of AGI for various income ranges: 1.9% for AGIs below $25k, 1.4% for AGIs $25k-50k, 0.7% for AGIs $50k-75k, 0.5% for AGIs $75k-100k, 2.1% for AGIs $100k-200k)
Net capital gain/loss in AGI: +$2,520 (reported on 17.9% of returns)
Here:
+$2,520
State:
+$22,183
(% of AGI for various income ranges: 0.3% for AGIs $25k-50k, 0.2% for AGIs $50k-75k, 1.0% for AGIs $75k-100k, 1.6% for AGIs $100k-200k)
Profit/loss from business: +$9,329 (reported on 15.0% of returns)
Here:
+$9,329
State:
+$12,903
(% of AGI for various income ranges: 6.2% for AGIs below $25k, 4.0% for AGIs $25k-50k, 3.1% for AGIs $50k-75k, 0.6% for AGIs $75k-100k, 2.4% for AGIs $100k-200k)
Taxable individual retirement arrangement distribution: $12,953 (reported on 12.1% of returns)
60520:
$12,953
Illinois:
$17,929
(% of AGI for various income ranges: 3.5% for AGIs below $25k, 4.2% for AGIs $25k-50k, 4.2% for AGIs $50k-75k, 3.5% for AGIs $100k-200k)
Total itemized deductions: $20,255 (22% of AGI, reported on 44.3% of returns)
Here:
$20,255
State:
$26,433
Here:
21.6% of AGI
State:
19.2% of AGI
(% of AGI for various income ranges: 15.2% for AGIs below $25k, 14.6% for AGIs $25k-50k, 16.3% for AGIs $50k-75k, 18.1% for AGIs $75k-100k, 15.2% for AGIs $100k-200k, 8.0% for AGIs over 200k)
Charity contributions: $2,410 (reported on 34.3% of returns)
Here:
$2,410
State:
$4,525
(% of AGI for various income ranges: 1.2% for AGIs below $25k, 1.2% for AGIs $25k-50k, 1.4% for AGIs $50k-75k, 1.7% for AGIs $75k-100k, 1.4% for AGIs $100k-200k, 1.1% for AGIs over 200k)
Taxes paid: $9,111 (reported on 44.3% of returns)
60520:
$9,111
State:
$11,968
(% of AGI for various income ranges: 5.0% for AGIs below $25k, 5.4% for AGIs $25k-50k, 6.8% for AGIs $50k-75k, 7.9% for AGIs $75k-100k, 7.7% for AGIs $100k-200k, 4.6% for AGIs over 200k)
Earned income credit: $1,938 (reported on 11.4% of returns)
Here:
$1,938
State:
$2,349
(% of AGI for various income ranges: 4.1% for AGIs below $25k, 0.8% for AGIs $25k-50k)
Percentage of individuals using paid preparers for their 2012 taxes: 55.0%
Here:
55%
State:
57%
(% for various income ranges: 48.9% for AGIs below $25k, 53.3% for AGIs $25k-50k, 61.9% for AGIs $50k-75k, 55.6% for AGIs $75k-100k, 61.9% for AGIs $100k-200k, 66.7% for AGIs over 200k)
Averages for the 2004 tax year for zip code 60520, filed in 2005:
Average Adjusted Gross Income (AGI) in 2004: $52,946 (Individual Income Tax Returns)
Here:
$52,946
State:
$54,625
Salary/wage: $47,250 (reported on 86.6% of returns)
Here:
$47,250
State:
$46,811
(% of AGI for various income ranges: 148.1% for AGIs below $10k, 69.0% for AGIs $10k-25k, 78.2% for AGIs $25k-50k, 82.9% for AGIs $50k-75k, 86.6% for AGIs $75k-100k, 65.4% for AGIs over 100k)
Taxable interest for individuals: $1,553 (reported on 55.1% of returns)
This zip code:
$1,553
Illinois:
$2,101
(% of AGI for various income ranges: 6.0% for AGIs below $10k, 3.5% for AGIs $10k-25k, 1.9% for AGIs $25k-50k, 1.2% for AGIs $50k-75k, 0.7% for AGIs $75k-100k, 1.9% for AGIs over 100k)
Taxable dividends: $1,958 (reported on 31.3% of returns)
Here:
$1,958
State:
$4,306
(% of AGI for various income ranges: 3.9% for AGIs below $10k, 2.8% for AGIs $10k-25k, 1.1% for AGIs $25k-50k, 0.6% for AGIs $50k-75k, 0.5% for AGIs $75k-100k, 1.7% for AGIs over 100k)
Net capital gain/loss: +$4,944 (reported on 21.0% of returns)
Here:
+$4,944
State:
+$17,321
(% of AGI for various income ranges: -1.5% for AGIs below $10k, 0.2% for AGIs $10k-25k, 1.4% for AGIs $25k-50k, 1.4% for AGIs $50k-75k, 0.4% for AGIs $75k-100k, 4.0% for AGIs over 100k)
Profit/loss from business: +$7,782 (reported on 15.0% of returns)
Here:
+$7,782
State:
+$11,771
(% of AGI for various income ranges: 5.1% for AGIs below $10k, 8.4% for AGIs $10k-25k, 3.5% for AGIs $25k-50k, 2.4% for AGIs $50k-75k, 3.0% for AGIs $75k-100k, -0.0% for AGIs over 100k)
IRA payment deduction: $2,580 (reported on 3.7% of returns)
60520:
$2,580
Illinois:
$3,087
Total itemized deductions: $17,316 (22% of AGI, reported on 47.4% of returns)
Here:
$17,316
State:
$20,239
Here:
21.9% of AGI
State:
19.5% of AGI
(% of AGI for various income ranges: 27.6% for AGIs below $10k, 18.1% for AGIs $10k-25k, 15.0% for AGIs $25k-50k, 16.8% for AGIs $50k-75k, 16.9% for AGIs $75k-100k, 13.0% for AGIs over 100k)
Charity contributions deductions: $2,290 (3% of AGI, reported on 41.3% of returns)
Here:
$2,290
State:
$3,719
Here:
2.8% of AGI
State:
3.4% of AGI
(% of AGI for various income ranges: 1.8% for AGIs below $10k, 1.3% for AGIs $10k-25k, 1.3% for AGIs $25k-50k, 1.8% for AGIs $50k-75k, 1.9% for AGIs $75k-100k, 2.0% for AGIs over 100k)
Total tax: $7,312 (reported on 81.1% of returns)
60520:
$7,312
State:
$9,882
(% of AGI for various income ranges: 2.7% for AGIs below $10k, 5.2% for AGIs $10k-25k, 7.6% for AGIs $25k-50k, 8.3% for AGIs $50k-75k, 9.9% for AGIs $75k-100k, 16.8% for AGIs over 100k)
Earned income credit: $1,382 (reported on 7.5% of returns)
Here:
$1,382
State:
$1,788
Percentage of individuals using paid preparers for their 2004 taxes: 57.6%
Here:
58%
State:
61%
(% for various income ranges: 49.2% for AGIs below $10k, 56.6% for AGIs $10k-25k, 57.1% for AGIs $25k-50k, 59.8% for AGIs $50k-75k, 64.9% for AGIs $75k-100k, 61.1% for AGIs over 100k)
Household received Food Stamps/SNAP in the past 12 months: 96 Household did not receive Food Stamps/SNAP in the past 12 months: 1,035
Women who had a birth in the past 12 months: 30 (17 now married, 13 unmarried) Women who did not have a birth in the past 12 months: 502 (244 now married, 255 unmarried)
Housing units in zip code 60520 with a mortgage: 628 (55 second mortgage, 44 both second mortgage and home equity loan) Houses without a mortgage: 11
Median monthly owner costs for units with a mortgage: $1,937 Median monthly owner costs for units without a mortgage: $880
Residents with income below the poverty level in 2022:
This zip code:
9.4%
Whole state:
11.9%
Residents with income below 50% of the poverty level in 2022:
This zip code:
5.3%
Whole state:
5.7%
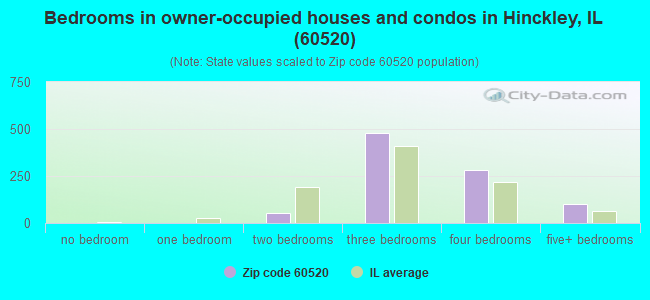
Median number of rooms in houses and condos:
Here:
7.5
State:
6.4
Median number of rooms in apartments:
Here:
4.6
State:
4.1
Notable locations in this zip code not listed on our city pages
473 married couples with children.
252 single-parent households (36 men, 216 women).
94.8% of residents of 60520 zip code speak English at home.
2.6% of residents speak Spanish at home (80% very well, 20% well).
1.7% of residents speak Asian or Pacific Island language at home (68% very well, 26% well, 6% not well).
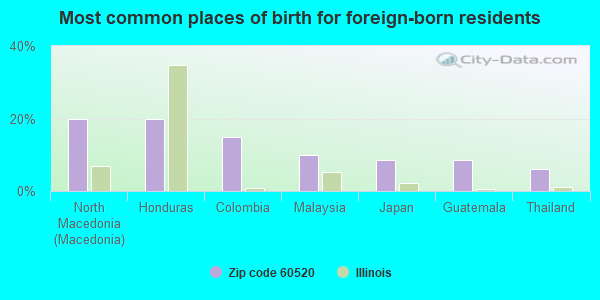
Foreign born population: 81 (2.8%) (59.5% of them are naturalized citizens)
This zip code:
2.8%
Whole state:
14.4%
20%North Macedonia (Macedonia)
20%Honduras
15%Colombia
10%Malaysia
9%Japan
9%Guatemala
6%Thailand
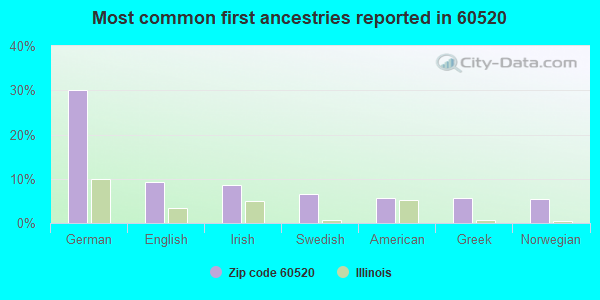
30%German
9%English
9%Irish
6%Swedish
6%American
6%Greek
5%Norwegian
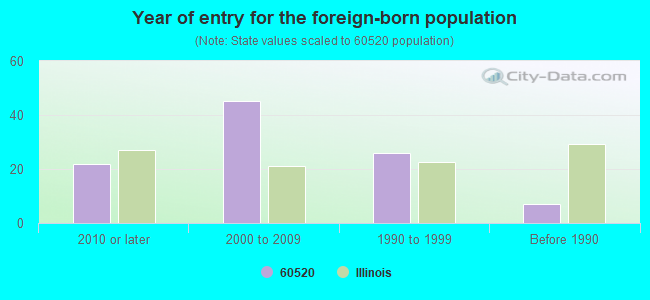
Year of entry for the foreign-born population
222010 or later
452000 to 2009
261990 to 1999
7Before 1990
Major facilities with environmental interests located in this zip code:
HINCKLEY, VILLAGE OF (200 S E SANDWICH RD in HINCKLEY, IL)
STATE MASTER (Illinois EPA Project) - SOLID WASTE PROGRAM, HAZARDOUS WASTE PROGRAM National Pollutant Discharge Elimination System NON-MAJOR (Tracking pollutant discharge elimination systems) - permit National Pollutant Discharge Elimination System NON-MAJOR (Tracking pollutant discharge elimination systems) - permit Small Quantity Generators, between 100 kg and 1000 kg of hazardous waste/month (Resource Conservation and Recovery Act (tracking hazardous waste)) - notification Business SIC classification: SEWERAGE SYSTEMS Organizations: HINCKLEY VILLAGE OF (CONTACT/OWNER)
Alternative names: HINCKLEY STP, HINCKLEY STP, VILLAGE OF
HINTZECHE GRAIN (137 MAY STREET in HINCKLEY, IL)
STATE MASTER (Illinois EPA Project) - AIR PROGRAM AIR MINOR (AIRS/AFS) Business SIC classification: PREPARED FEEDS AND FEED INGREDIENTS FOR ANIMALS AND FOWLS, EXCEPT DOGS AND CATS; GRAIN AND FIELD BEANS Alternative names: HINTZSCHE FEED AND GRAIN INCorporated
MIDWEST SIDING SUPPLY INC (121 S SYCAMORE ST in HINCKLEY, IL)
STATE MASTER (Illinois EPA Project) - HAZARDOUS WASTE PROGRAM (Resource Conservation and Recovery Act (tracking hazardous waste)) Organizations: MIDWEST ALUMINUM SUPPLY (CONTACT/OPERATOR)
, GERALD & MONTE ENOCH (CONTACT/OWNER)
Alternative names: CEDAR SIDING AND LUMBER
CIRCLE CHEMICAL CO INC (479 W LINCOLN in HINCKLEY, IL)
STATE MASTER (Illinois EPA Project) - SOLID WASTE PROGRAM, HAZARDOUS WASTE PROGRAM (Resource Conservation and Recovery Act (tracking hazardous waste)) Organizations: CIRCLE SYSTEMS (CONTACT/OPERATOR)
, CIRCLE CHEM CO INC (CONTACT/OWNER)
L&R TRIKES (203 W LINCOLN AVE in HINCKLEY, IL)
STATE MASTER (Illinois EPA Project) - HAZARDOUS WASTE PROGRAM Conditionally Exempt Small Quantity Generators, less than 100 kg/month of hazardous waste (Resource Conservation and Recovery Act (tracking hazardous waste)) - notification TRANSPORTER (Resource Conservation and Recovery Act (tracking hazardous waste)) - notification Business NAICS classification: MOTORCYCLE DEALERS. Organizations: KEVIN LYNCH (CONTACT/OPERATOR)
Alternative names: JACKS STANDARD
NORTHERN FS INC (HIGHWAY 30 EAST in HINCKLEY, IL)
STATE MASTER (Illinois EPA Project) - AIR PROGRAM AIR MINOR (AIRS/AFS) Business SIC classification: FARM SUPPLIES
HINCKLEY-BIG ROCK HIGH SCHOOL (P O BOX 1210 in HINCKLEY, IL)
(Geographic Names Information System) (National Center for Education Statistics) - STATE ID-1601942900003 Organizations: HINCKLEY BIG ROCK C U S D 429 (SCHOOL DISTRICT)
QRS INC (212 W WOODLAWN AVE in HINCKLEY, IL)
STATE MASTER (Illinois EPA Project) - SOLID WASTE PROGRAM Conditionally Exempt Small Quantity Generators, less than 100 kg/month of hazardous waste (Resource Conservation and Recovery Act (tracking hazardous waste)) - notification
RICHS TIRE SERVICE INC (211 W LINCOLN HWY in HINCKLEY, IL)
STATE MASTER (Illinois EPA Project) - HAZARDOUS WASTE PROGRAM, SCRAP TIRE MANAGEMENT Conditionally Exempt Small Quantity Generators, less than 100 kg/month of hazardous waste (Resource Conservation and Recovery Act (tracking hazardous waste)) - notification
HINCKLEY ELEM SCHOOL (P O BOX 1270 in HINCKLEY, IL)
(National Center for Education Statistics) - STATE ID-1601942902002 Organizations: HINCKLEY BIG ROCK C U S D 429 (SCHOOL DISTRICT)
NORTHERN FS INC (RTE 30 EAST in HINCKLEY, IL)
(Resource Conservation and Recovery Act (tracking hazardous waste))
84 LUMBER COMPANY HINCKLEY (801 E LINCOLN in HINCKLEY, IL)
National Pollutant Discharge Elimination System NON-MAJOR (Tracking pollutant discharge elimination systems) - permit
HINCKLEY BIG ROCK DIST 429 (800 E LINCOLN HIGHWAY in HINCKLEY, IL)
COMPLIANCE ACTIVITY (Tracking inspections of insecticide, fungicide, and rodenticide, and toxic substances)
76.0%Utility gas
9.3%Bottled, tank, or LP gas
7.2%Wood
6.1%Electricity
1.5%Other fuel
Population in 1990: 2,387. Population change in the 1990s: +383 (+16.0%).
Place of birth for U.S.-born residents:
This state: 2,356
Northeast: 28
Midwest: 249
South: 58
West: 81
60% of the 60520 zip code residents lived in the same house 5 years ago. Out of people who lived in different houses, 30% lived in this county. Out of people who lived in different counties, 50% lived in Illinois.
93% of the 60520 zip code residents lived in the same house 1 year ago. Out of people who lived in different houses, 29% moved from this county. Out of people who lived in different houses, 70% moved from different county within same state. Out of people who lived in different houses, 4% moved from different state.
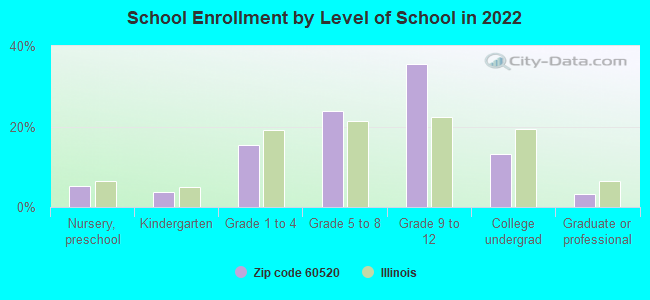
Private vs. public school enrollment:
Students in private schools in grades 1 to 8 (elementary and middle school): 46
Here:
15.5%
Illinois:
13.3%
Students in private schools in grades 9 to 12 (high school): 16
Here:
6.2%
Illinois:
9.9%
Students in private undergraduate colleges: 14
Here:
14.9%
Illinois:
27.4%
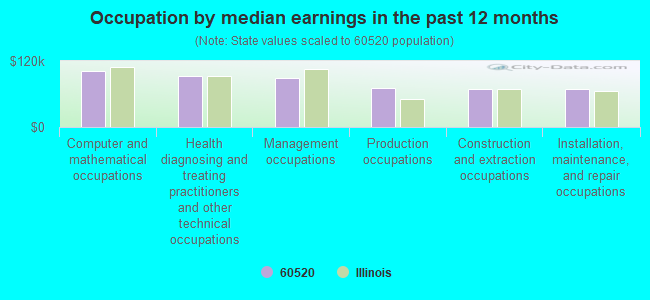
Occupation by median earnings in the past 12 months ($)
102,300Computer and mathematical occupations
93,186Health diagnosing and treating practitioners and other technical occupations
88,560Management occupations
70,501Production occupations
69,508Construction and extraction occupations
68,715Installation, maintenance, and repair occupations
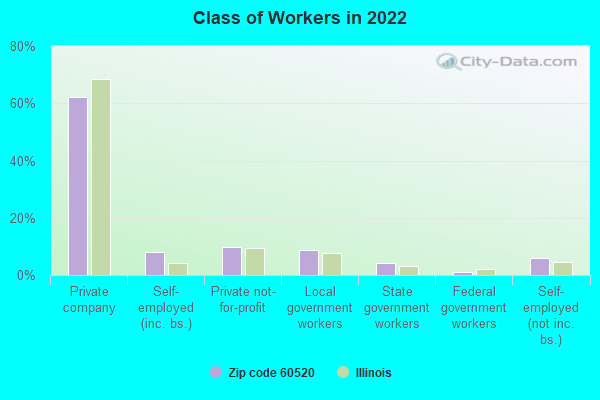
Top industries in this zip code by the number of employees in 2005:
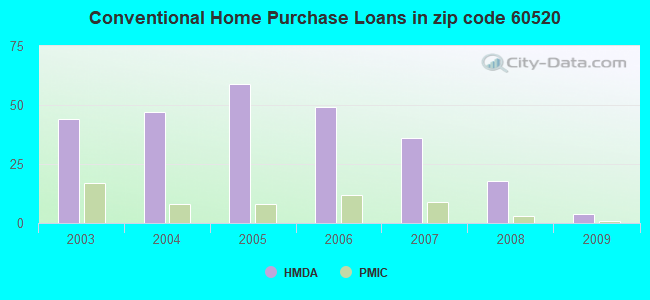
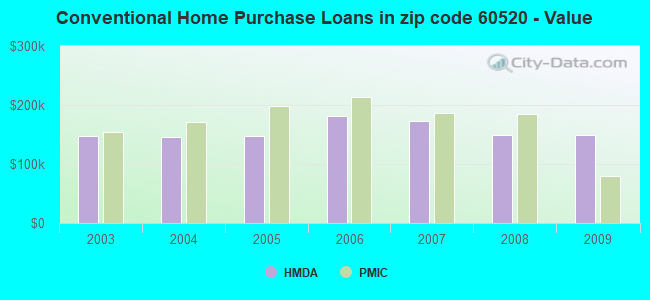
Detailed PMIC statistics for the following Tracts:0017.00
2002 - 2018 National Fire Incident Reporting System (NFIRS) incidents
According to the data from the years 2002 - 2018 the average number of fire incidents per year is 15. The highest number of reported fires - 27 took place in 2004, and the least - 4 in 2018. The data has a decreasing trend.
When looking into fire subcategories, the most incidents belonged to: Outside Fires (43.5%), and Structure Fires (41.2%).
Fire incident types reported to NFIRS in Zip Code 60520

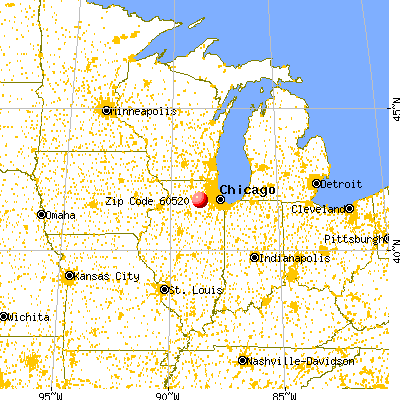


 Nearest zip codes: 60556, 60511, 60552, 60112, 60548, 60115.


 According to the data from the years 2002 - 2018 the average number of fire incidents per year is 15. The highest number of reported fires - 27 took place in 2004, and the least - 4 in 2018. The data has a decreasing trend.
 When looking into fire subcategories, the most incidents belonged to: Outside Fires (43.5%), and Structure Fires (41.2%).