Estimated zip code population in 2022: 4,717 Zip code population in 2010: 4,560 Zip code population in 2000: 1,294
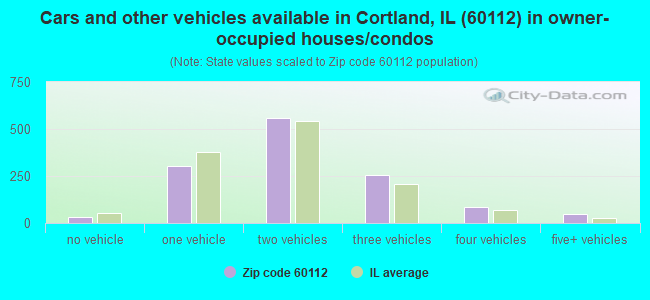
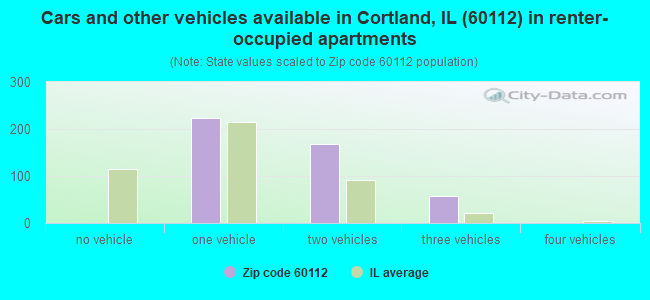
Houses and condos: 1,794 Renter-occupied apartments: 456
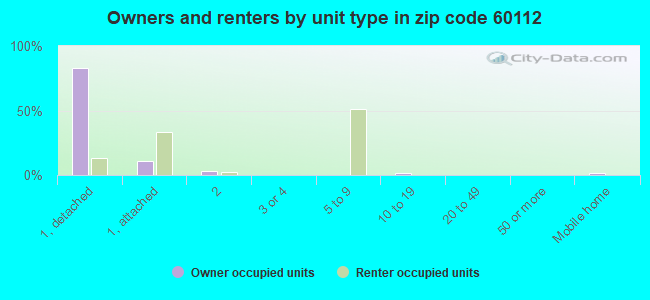
% of renters here:
26%
State:
33%
March 2022 cost of living index in zip code 60112: 100.3 (near average, U.S. average is 100)
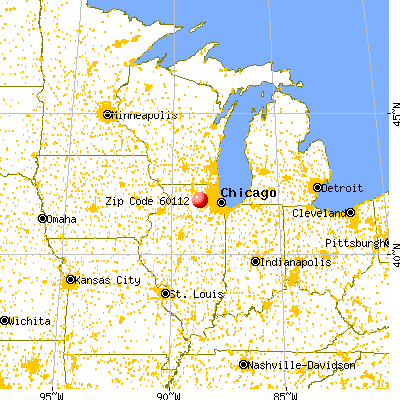
Land area: 3.7 sq. mi. Water area: 0.0 sq. mi.
Population density: 1,275 people per square mile
(low).
OSM Map
General Map
Google Map
MSN Map
OSM Map
General Map
Google Map
MSN Map
OSM Map
General Map
Google Map
MSN Map
OSM Map
General Map
Google Map
MSN Map
Please wait while loading the map...
Real estate property taxes paid for housing units in 2022:
This zip code:
3.0% ($6,118)
Illinois:
2.0% ($4,912)
Median real estate property taxes paid for housing units with mortgages in 2022: $6,195 (3.0%) Median real estate property taxes paid for housing units with no mortgage in 2022: $5,711 (2.8%)
Business Search- 14 Million verified businesses
Males: 2,664
(56.5%)
Females: 2,053
(43.5%)
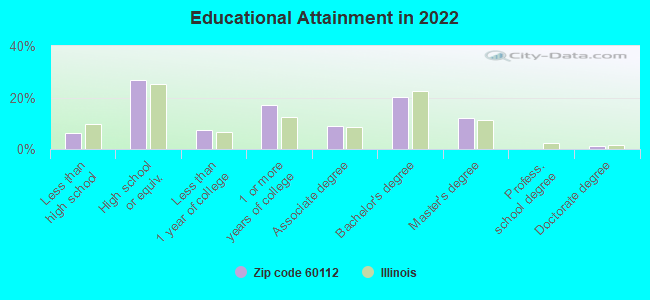
For population 25 years and over in 60112:
High school or higher: 93.3%
Bachelor's degree or higher: 33.1%
Graduate or professional degree: 13.0%
Unemployed: 4.6%
Mean travel time to work (commute): 28.7 minutes
For population 15 years and over in 60112:
Never married: 43.8%
Now married: 42.6%
Separated: 0.0%
Widowed: 2.9%
Divorced: 10.7%
Zip code 60112 compared to state average:
Median age below state average.
Foreign-born population percentage significantly below state average.
Length of stay since moving in above state average.
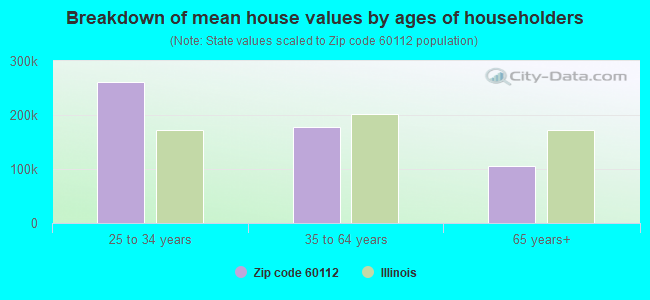
Estimated median house/condo value in 2022: $205,721
60112:
$205,721
Illinois:
$251,600
According to our research of Illinois and other state lists, there were 4 registered sex offenders living in 60112 zip code as of May 28, 2024. The ratio of all residents to sex offenders in zip code 60112 is 1,150 to 1. The ratio of registered sex offenders to all residents in this zip code is lower than the state average.
Median resident age:
This zip code:
31.9 years
Illinois median age:
39.1 years
Average household size:
This zip code:
2.7 people
Illinois:
2.4 people
Averages for the 2020 tax year for zip code 60112, filed in 2021:
Average Adjusted Gross Income (AGI) in 2020: $58,512 (Individual Income Tax Returns)
Here:
$58,512
State:
$82,626
Salary/wage: $54,486 (reported on 91.0% of returns)
Here:
$54,486
State:
$66,640
(% of AGI for various income ranges: 1183.3% for AGIs below $25k, 3618.0% for AGIs $25k-50k, 6289.0% for AGIs $50k-75k, 9739.0% for AGIs $75k-100k, 18408.8% for AGIs $100k-200k)
Taxable interest for individuals: $411 (reported on 20.6% of returns)
This zip code:
$411
Illinois:
$2,376
(% of AGI for various income ranges: 6.7% for AGIs below $25k, 11.0% for AGIs $25k-50k, 9.0% for AGIs $50k-75k, 12.5% for AGIs $75k-100k, 18.8% for AGIs $100k-200k)
Ordinary dividends: $1,411 (reported on 12.1% of returns)
Here:
$1,411
State:
$9,061
(% of AGI for various income ranges: 6.7% for AGIs below $25k, 11.4% for AGIs $25k-50k, 15.8% for AGIs $50k-75k, 29.5% for AGIs $75k-100k, 70.8% for AGIs $100k-200k)
Net capital gain/loss in AGI: +$3,146 (reported on 10.8% of returns)
Here:
+$3,146
State:
+$31,684
(% of AGI for various income ranges: 4.2% for AGIs $25k-50k, 18.7% for AGIs $50k-75k, 7.5% for AGIs $75k-100k, 255.4% for AGIs $100k-200k)
Profit/loss from business: +$5,136 (reported on 12.6% of returns)
Here:
+$5,136
State:
+$12,175
(% of AGI for various income ranges: 54.8% for AGIs below $25k, 91.6% for AGIs $25k-50k, 149.0% for AGIs $50k-75k, 88.5% for AGIs $75k-100k, 30.0% for AGIs $100k-200k)
Taxable individual retirement arrangement distribution: $16,936 (reported on 4.9% of returns)
60112:
$16,936
Illinois:
$21,613
(% of AGI for various income ranges: 80.6% for AGIs below $25k, 232.6% for AGIs $50k-75k, 290.4% for AGIs $100k-200k)
Total itemized deductions: $18,488 (reported on 7.2% of returns)
Here:
$18,488
State:
$34,948
(% of AGI for various income ranges: 129.8% for AGIs $25k-50k, 279.0% for AGIs $50k-75k, 355.0% for AGIs $75k-100k, 282.3% for AGIs $100k-200k)
Charity contributions: $4,425 (reported on 3.6% of returns)
Here:
$4,425
State:
$13,122
(% of AGI for various income ranges: 56.5% for AGIs $50k-75k, 68.8% for AGIs $100k-200k)
Taxes paid: $8,162 (reported on 7.2% of returns)
60112:
$8,162
State:
$8,563
(% of AGI for various income ranges: 59.6% for AGIs $25k-50k, 124.8% for AGIs $50k-75k, 168.5% for AGIs $75k-100k, 109.2% for AGIs $100k-200k)
Earned income credit: $2,135 (reported on 13.9% of returns)
Here:
$2,135
State:
$2,311
(% of AGI for various income ranges: 71.0% for AGIs below $25k, 64.2% for AGIs $25k-50k)
Percentage of individuals using paid preparers for their 2020 taxes: 94.6%
Here:
95%
State:
93%
(% for various income ranges: 90.2% for AGIs below $25k, 96.6% for AGIs $25k-50k, 97.4% for AGIs $50k-75k, 96.2% for AGIs $75k-100k, 94.7% for AGIs $100k-200k, 100.0% for AGIs over 200k)
Averages for the 2012 tax year for zip code 60112, filed in 2013:
Average Adjusted Gross Income (AGI) in 2012: $48,422 (Individual Income Tax Returns)
Here:
$48,422
State:
$68,058
Salary/wage: $44,824 (reported on 92.8% of returns)
Here:
$44,824
State:
$55,396
(% of AGI for various income ranges: 81.2% for AGIs below $25k, 88.0% for AGIs $25k-50k, 87.2% for AGIs $50k-75k, 91.4% for AGIs $75k-100k, 80.1% for AGIs $100k-200k)
Taxable interest for individuals: $330 (reported on 26.0% of returns)
This zip code:
$330
Illinois:
$1,969
(% of AGI for various income ranges: 0.8% for AGIs below $25k, 0.1% for AGIs $25k-50k, 0.1% for AGIs $50k-75k, 0.1% for AGIs $100k-200k)
Ordinary dividends: $967 (reported on 11.5% of returns)
Here:
$967
State:
$7,786
(% of AGI for various income ranges: 0.2% for AGIs below $25k, 0.1% for AGIs $25k-50k, 0.2% for AGIs $50k-75k, 0.1% for AGIs $75k-100k, 0.4% for AGIs $100k-200k)
Net capital gain/loss in AGI: +$206 (reported on 7.7% of returns)
Here:
+$206
State:
+$22,183
(% of AGI for various income ranges: 0.3% for AGIs $100k-200k)
Profit/loss from business: +$7,874 (reported on 13.0% of returns)
Here:
+$7,874
State:
+$12,903
(% of AGI for various income ranges: 5.3% for AGIs below $25k, 1.2% for AGIs $25k-50k, 1.3% for AGIs $50k-75k, 1.6% for AGIs $75k-100k, 2.7% for AGIs $100k-200k)
Taxable individual retirement arrangement distribution: $13,850 (reported on 5.8% of returns)
60112:
$13,850
Illinois:
$17,929
(% of AGI for various income ranges: 1.7% for AGIs below $25k, 1.4% for AGIs $25k-50k, 2.2% for AGIs $50k-75k, 2.8% for AGIs $100k-200k)
Total itemized deductions: $18,290 (24% of AGI, reported on 43.3% of returns)
Here:
$18,290
State:
$26,433
Here:
24.1% of AGI
State:
19.2% of AGI
(% of AGI for various income ranges: 8.3% for AGIs below $25k, 13.3% for AGIs $25k-50k, 19.4% for AGIs $50k-75k, 19.4% for AGIs $75k-100k, 16.0% for AGIs $100k-200k)
Charity contributions: $1,702 (reported on 30.8% of returns)
Here:
$1,702
State:
$4,525
(% of AGI for various income ranges: 0.4% for AGIs below $25k, 0.8% for AGIs $25k-50k, 1.3% for AGIs $50k-75k, 1.0% for AGIs $75k-100k, 1.4% for AGIs $100k-200k)
Taxes paid: $8,349 (reported on 43.3% of returns)
60112:
$8,349
State:
$11,968
(% of AGI for various income ranges: 3.1% for AGIs below $25k, 5.9% for AGIs $25k-50k, 8.4% for AGIs $50k-75k, 9.1% for AGIs $75k-100k, 7.8% for AGIs $100k-200k)
Earned income credit: $2,329 (reported on 18.3% of returns)
Here:
$2,329
State:
$2,349
(% of AGI for various income ranges: 7.5% for AGIs below $25k, 1.1% for AGIs $25k-50k)
Percentage of individuals using paid preparers for their 2012 taxes: 47.1%
Here:
47%
State:
57%
(% for various income ranges: 43.2% for AGIs below $25k, 45.1% for AGIs $25k-50k, 50.0% for AGIs $50k-75k, 53.6% for AGIs $75k-100k, 52.4% for AGIs $100k-200k)
Averages for the 2004 tax year for zip code 60112, filed in 2005:
Average Adjusted Gross Income (AGI) in 2004: $46,083 (Individual Income Tax Returns)
Here:
$46,083
State:
$54,625
Salary/wage: $44,781 (reported on 92.5% of returns)
Here:
$44,781
State:
$46,811
(% of AGI for various income ranges: 124.9% for AGIs below $10k, 82.2% for AGIs $10k-25k, 88.7% for AGIs $25k-50k, 93.0% for AGIs $50k-75k, 92.4% for AGIs $75k-100k, 80.3% for AGIs over 100k)
Taxable interest for individuals: $493 (reported on 39.0% of returns)
This zip code:
$493
Illinois:
$2,101
(% of AGI for various income ranges: 6.9% for AGIs below $10k, 1.1% for AGIs $10k-25k, 0.4% for AGIs $25k-50k, 0.2% for AGIs $50k-75k, 0.4% for AGIs $75k-100k, 0.2% for AGIs over 100k)
Taxable dividends: $680 (reported on 16.4% of returns)
Here:
$680
State:
$4,306
(% of AGI for various income ranges: 2.4% for AGIs below $10k, 0.0% for AGIs $10k-25k, 0.4% for AGIs $25k-50k, 0.1% for AGIs $50k-75k, 0.1% for AGIs $75k-100k, 0.5% for AGIs over 100k)
Net capital gain/loss: +$758 (reported on 11.2% of returns)
Here:
+$758
State:
+$17,321
(% of AGI for various income ranges: -1.1% for AGIs below $10k, 0.1% for AGIs $25k-50k, 0.2% for AGIs $50k-75k, 0.1% for AGIs $75k-100k, 0.7% for AGIs over 100k)
Profit/loss from business: +$6,360 (reported on 12.8% of returns)
Here:
+$6,360
State:
+$11,771
(% of AGI for various income ranges: 2.9% for AGIs below $10k, 6.3% for AGIs $10k-25k, 2.1% for AGIs $25k-50k, 0.7% for AGIs $50k-75k, 1.1% for AGIs $75k-100k, 3.0% for AGIs over 100k)
IRA payment deduction: $1,857 (reported on 1.0% of returns)
60112:
$1,857
Illinois:
$3,087
Total itemized deductions: $15,717 (24% of AGI, reported on 48.1% of returns)
Here:
$15,717
State:
$20,239
Here:
24.3% of AGI
State:
19.5% of AGI
(% of AGI for various income ranges: 14.3% for AGIs below $10k, 9.2% for AGIs $10k-25k, 17.3% for AGIs $25k-50k, 17.7% for AGIs $50k-75k, 16.4% for AGIs $75k-100k, 15.3% for AGIs over 100k)
Charity contributions deductions: $1,472 (2% of AGI, reported on 38.6% of returns)
Here:
$1,472
State:
$3,719
Here:
2.2% of AGI
State:
3.4% of AGI
(% of AGI for various income ranges: 0.6% for AGIs $10k-25k, 1.4% for AGIs $25k-50k, 1.1% for AGIs $50k-75k, 1.0% for AGIs $75k-100k, 2.0% for AGIs over 100k)
Total tax: $4,828 (reported on 80.3% of returns)
60112:
$4,828
State:
$9,882
(% of AGI for various income ranges: 2.4% for AGIs below $10k, 4.7% for AGIs $10k-25k, 6.5% for AGIs $25k-50k, 7.6% for AGIs $50k-75k, 9.4% for AGIs $75k-100k, 14.2% for AGIs over 100k)
Earned income credit: $1,955 (reported on 11.4% of returns)
Here:
$1,955
State:
$1,788
Percentage of individuals using paid preparers for their 2004 taxes: 51.0%
Here:
51%
State:
61%
(% for various income ranges: 44.1% for AGIs below $10k, 48.9% for AGIs $10k-25k, 53.4% for AGIs $25k-50k, 49.3% for AGIs $50k-75k, 58.3% for AGIs $75k-100k, 53.0% for AGIs over 100k)
Likely homosexual households (counted as self-reported same-sex unmarried-partner households)
Lesbian couples: 0.0% of all households
Gay men: 0.6% of all households
Household received Food Stamps/SNAP in the past 12 months: 299 Household did not receive Food Stamps/SNAP in the past 12 months: 1,445
Women who had a birth in the past 12 months: 52 (27 now married, 24 unmarried) Women who did not have a birth in the past 12 months: 1,102 (401 now married, 702 unmarried)
Housing units in zip code 60112 with a mortgage: 1,021 (210 second mortgage, 198 both second mortgage and home equity loan) Houses without a mortgage: 14
Median monthly owner costs for units with a mortgage: $1,718 Median monthly owner costs for units without a mortgage: $817
Residents with income below the poverty level in 2022:
This zip code:
4.4%
Whole state:
11.9%
Residents with income below 50% of the poverty level in 2022:
This zip code:
2.2%
Whole state:
5.7%
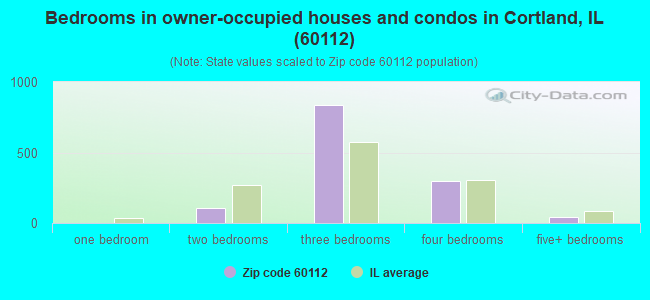
Median number of rooms in houses and condos:
Here:
6.1
State:
6.4
Median number of rooms in apartments:
Here:
4.9
State:
4.1
Notable locations in this zip code not listed on our city pages
Size of family households: 316 2-persons, 314 3-persons, 168 4-persons, 120 5-persons, 103 6-persons, 53 7-or-more-persons
Size of nonfamily households: 339 1-person, 326 2-persons
582 married couples with children.
220 single-parent households (121 men, 99 women).
88.4% of residents of 60112 zip code speak English at home.
9.5% of residents speak Spanish at home (73% very well, 19% well, 8% not well).
1.0% of residents speak other Indo-European language at home (46% very well, 54% not well).
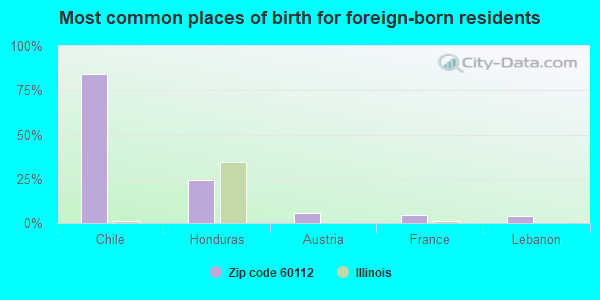
Foreign born population: 231 (4.9%) (30.9% of them are naturalized citizens)
This zip code:
4.9%
Whole state:
14.4%
84%Chile
24%Honduras
6%Austria
5%France
4%Lebanon
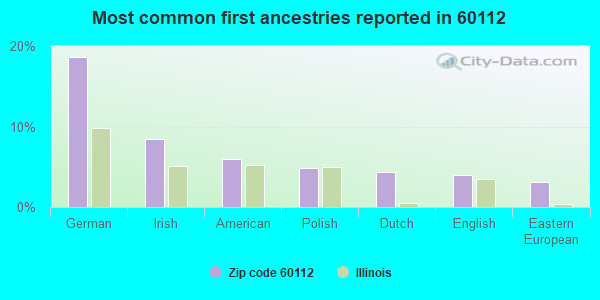
19%German
9%Irish
6%American
5%Polish
4%Dutch
4%English
3%Eastern European
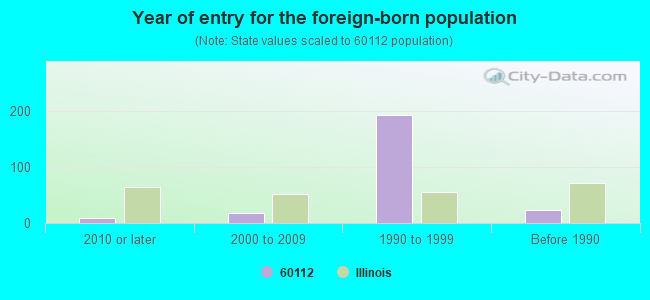
Year of entry for the foreign-born population
92010 or later
182000 to 2009
1931990 to 1999
23Before 1990
Facilities with environmental interests located in this zip code:
KISHWAUKEE FORGE INC (14438 E N ST RD in CORTLAND, IL)
STATE MASTER (Illinois EPA Project) - SOLID WASTE PROGRAM, AIR PROGRAM AIR MINOR (AIRS/AFS) CRITERIA AND HAZARDOUS AIR POLLUTANT INVENTORY (Inventory of air pollution sources) Business SIC classification: IRON AND STEEL FORGINGS
DEKALB COUNTY PACKING COMPANY (WEBSTER ROAD, NORTH OF RT. 38 in CORTLAND, IL)
STATE MASTER (Illinois EPA Project) - National Pollutant Discharge Elimination System Permit National Pollutant Discharge Elimination System NON-MAJOR (Tracking pollutant discharge elimination systems) - permit Business SIC classification: MEAT PACKING PLANTS
CORTLAND ELEMENTARY SCHOOL (4418 MAPLE in CORTLAND, IL)
(Geographic Names Information System) (National Center for Education Statistics) - STATE ID-1601942802009 Organizations: DEKALB COMM UNIT SCH DIST 428 (SCHOOL DISTRICT)
DEKALB COUNTY LANDFILL (504 N. SOMONANK in CORTLAND, IL)
National Pollutant Discharge Elimination System NON-MAJOR (Tracking pollutant discharge elimination systems) - permit Organizations: WASTE MANAGEMENT/NORTH AMERICA (CONTACT/OWNER)
CORTLAND TOWN OF GARAGE (1909 PAMPAS ST in CORTLAND, IL)
Small Quantity Generators, between 100 kg and 1000 kg of hazardous waste/month (Resource Conservation and Recovery Act (tracking hazardous waste)) - notification
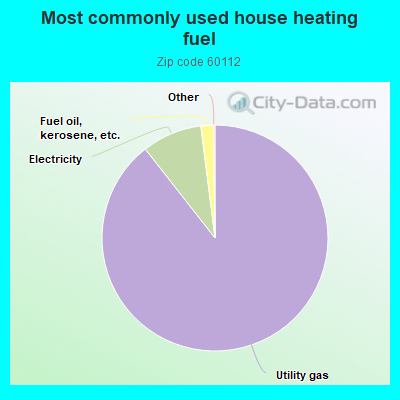
89.6%Utility gas
8.6%Electricity
1.8%Fuel oil, kerosene, etc.
Place of birth for U.S.-born residents:
This state: 3,782
Northeast: 78
Midwest: 467
South: 107
West: 14
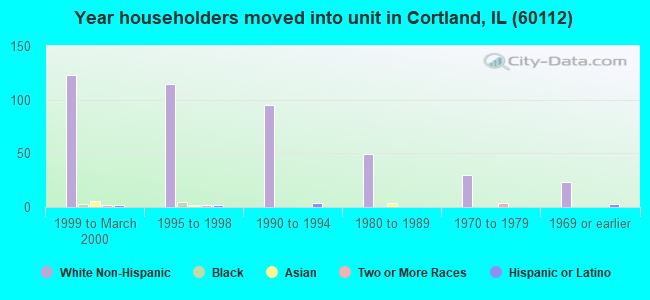
48% of the 60112 zip code residents lived in the same house 5 years ago. Out of people who lived in different houses, 35% lived in this county. Out of people who lived in different counties, 50% lived in Illinois.
80% of the 60112 zip code residents lived in the same house 1 year ago. Out of people who lived in different houses, 49% moved from this county. Out of people who lived in different houses, 51% moved from different county within same state.
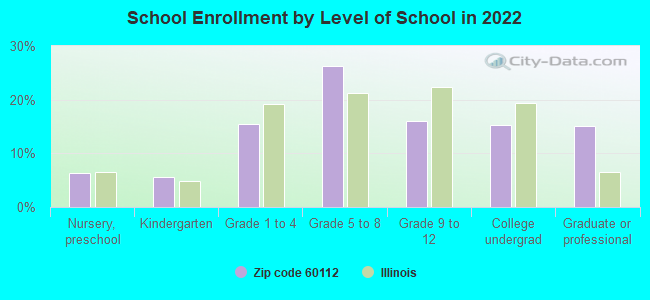
Private vs. public school enrollment:
Students in private schools in grades 1 to 8 (elementary and middle school): 33
Here:
6.6%
Illinois:
13.3%
Students in private schools in grades 9 to 12 (high school): 43
Here:
22.5%
Illinois:
9.9%
Students in private undergraduate colleges: 28
Here:
15.3%
Illinois:
27.4%
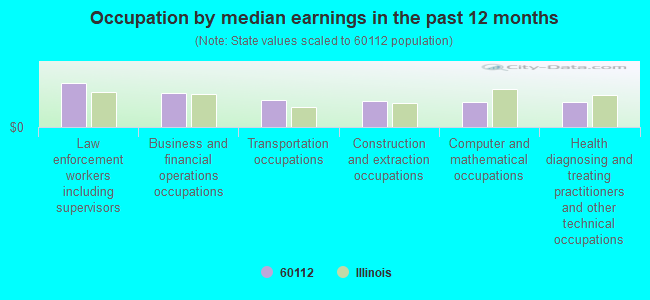
Occupation by median earnings in the past 12 months ($)
123,488Law enforcement workers including supervisors
95,134Business and financial operations occupations
77,063Transportation occupations
72,938Construction and extraction occupations
70,846Computer and mathematical occupations
70,784Health diagnosing and treating practitioners and other technical occupations
Top industries in this zip code by the number of employees in 2005:
Detailed PMIC statistics for the following Tracts:0016.00
2002 - 2018 National Fire Incident Reporting System (NFIRS) incidents
According to the data from the years 2002 - 2018 the average number of fire incidents per year is 21. The highest number of reported fires - 36 took place in 2009, and the least - 6 in 2018. The data has a declining trend.
When looking into fire subcategories, the most reports belonged to: Structure Fires (51.1%), and Outside Fires (26.9%).
Fire incident types reported to NFIRS in Zip Code 60112


 Nearest zip codes: 60115, 60178, 60151, 60520, 60111, 60145.


 According to the data from the years 2002 - 2018 the average number of fire incidents per year is 21. The highest number of reported fires - 36 took place in 2009, and the least - 6 in 2018. The data has a declining trend.
 When looking into fire subcategories, the most reports belonged to: Structure Fires (51.1%), and Outside Fires (26.9%).