Estimated zip code population in 2022: 29,043 Zip code population in 2010: 26,447 Zip code population in 2000: 7,891
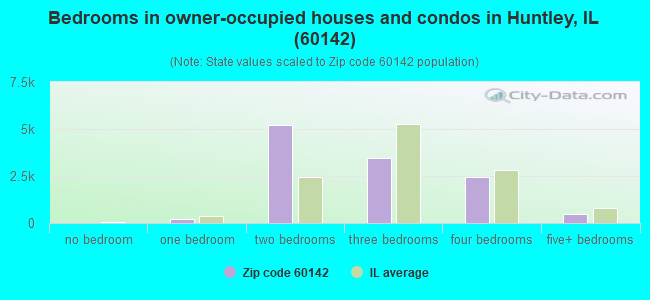
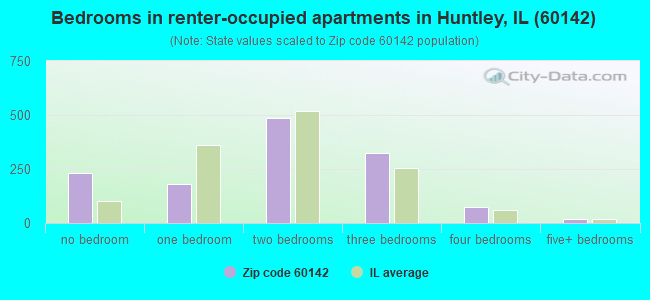
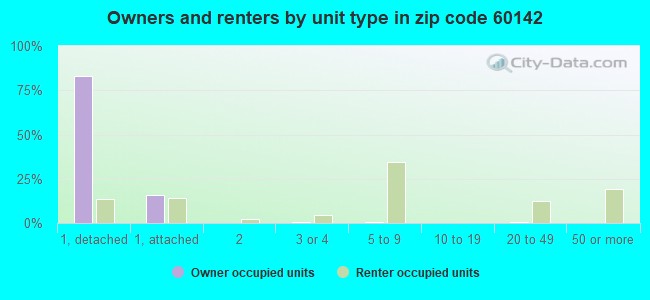
Houses and condos: 13,244 Renter-occupied apartments: 1,306
% of renters here:
10%
State:
33%
March 2022 cost of living index in zip code 60142: 101.2 (near average, U.S. average is 100)
Land area: 40.1 sq. mi. Water area: 0.0 sq. mi.
Population density: 723 people per square mile
(low).
OSM Map
General Map
Google Map
MSN Map
OSM Map
General Map
Google Map
MSN Map
OSM Map
General Map
Google Map
MSN Map
OSM Map
General Map
Google Map
MSN Map
Please wait while loading the map...
Real estate property taxes paid for housing units in 2022:
This zip code:
2.2% ($6,964)
Illinois:
2.0% ($4,912)
Median real estate property taxes paid for housing units with mortgages in 2022: $7,450 (2.4%) Median real estate property taxes paid for housing units with no mortgage in 2022: $6,550 (2.0%)
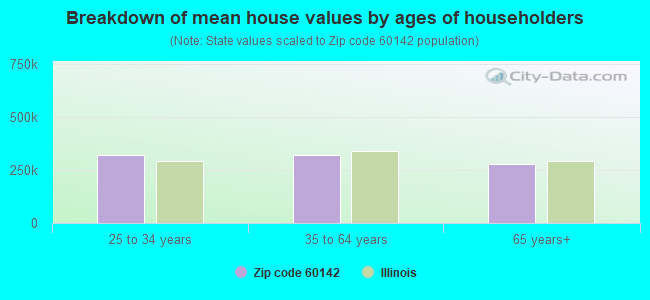
Estimated median house/condo value in 2022: $320,314
60142:
$320,314
Illinois:
$251,600
According to our research of Illinois and other state lists, there were 9 registered sex offenders living in 60142 zip code as of May 19, 2024. The ratio of all residents to sex offenders in zip code 60142 is 3,081 to 1. The ratio of registered sex offenders to all residents in this zip code is much lower than the state average.
Median resident age:
This zip code:
49.8 years
Illinois median age:
39.1 years
Average household size:
This zip code:
2.2 people
Illinois:
2.4 people
Averages for the 2020 tax year for zip code 60142, filed in 2021:
Average Adjusted Gross Income (AGI) in 2020: $83,951 (Individual Income Tax Returns)
Here:
$83,951
State:
$82,626
Salary/wage: $76,927 (reported on 66.8% of returns)
Here:
$76,927
State:
$66,640
(% of AGI for various income ranges: 847.7% for AGIs below $25k, 2556.4% for AGIs $25k-50k, 4606.7% for AGIs $50k-75k, 7090.9% for AGIs $75k-100k, 15193.9% for AGIs $100k-200k, 55887.2% for AGIs over 200k)
Taxable interest for individuals: $1,688 (reported on 43.4% of returns)
This zip code:
$1,688
Illinois:
$2,376
(% of AGI for various income ranges: 42.3% for AGIs below $25k, 72.6% for AGIs $25k-50k, 105.7% for AGIs $50k-75k, 109.5% for AGIs $75k-100k, 145.3% for AGIs $100k-200k, 688.9% for AGIs over 200k)
Ordinary dividends: $5,725 (reported on 34.7% of returns)
Here:
$5,725
State:
$9,061
(% of AGI for various income ranges: 77.7% for AGIs below $25k, 141.9% for AGIs $25k-50k, 262.6% for AGIs $50k-75k, 306.5% for AGIs $75k-100k, 423.5% for AGIs $100k-200k, 2290.0% for AGIs over 200k)
Net capital gain/loss in AGI: +$8,577 (reported on 30.4% of returns)
Here:
+$8,577
State:
+$31,684
(% of AGI for various income ranges: 11.6% for AGIs below $25k, 58.4% for AGIs $25k-50k, 172.1% for AGIs $50k-75k, 238.9% for AGIs $75k-100k, 523.4% for AGIs $100k-200k, 5764.2% for AGIs over 200k)
Profit/loss from business: +$11,978 (reported on 11.9% of returns)
Here:
+$11,978
State:
+$12,175
(% of AGI for various income ranges: 69.2% for AGIs below $25k, 121.4% for AGIs $25k-50k, 186.5% for AGIs $50k-75k, 160.4% for AGIs $75k-100k, 263.5% for AGIs $100k-200k, 1909.7% for AGIs over 200k)
Taxable individual retirement arrangement distribution: $20,379 (reported on 23.3% of returns)
60142:
$20,379
Illinois:
$21,613
(% of AGI for various income ranges: 206.1% for AGIs below $25k, 479.7% for AGIs $25k-50k, 710.4% for AGIs $50k-75k, 964.9% for AGIs $75k-100k, 1147.0% for AGIs $100k-200k, 2641.9% for AGIs over 200k)
Self-employed (Keogh) retirement plans: $14,767 (reported on 0.4% of returns)
60142:
$14,767
Illinois:
$30,962
(% of AGI for various income ranges: 18.7% for AGIs $100k-200k, 118.6% for AGIs over 200k)
Total itemized deductions: $28,200 (reported on 13.5% of returns)
Here:
$28,200
State:
$34,948
(% of AGI for various income ranges: 159.3% for AGIs below $25k, 309.7% for AGIs $25k-50k, 567.7% for AGIs $50k-75k, 701.7% for AGIs $75k-100k, 879.6% for AGIs $100k-200k, 2976.4% for AGIs over 200k)
Charity contributions: $6,183 (reported on 11.3% of returns)
Here:
$6,183
State:
$13,122
(% of AGI for various income ranges: 10.2% for AGIs below $25k, 32.0% for AGIs $25k-50k, 79.5% for AGIs $50k-75k, 89.6% for AGIs $75k-100k, 175.8% for AGIs $100k-200k, 954.4% for AGIs over 200k)
Taxes paid: $8,520 (reported on 13.3% of returns)
60142:
$8,520
State:
$8,563
(% of AGI for various income ranges: 41.0% for AGIs below $25k, 84.5% for AGIs $25k-50k, 192.3% for AGIs $50k-75k, 251.5% for AGIs $75k-100k, 272.9% for AGIs $100k-200k, 695.6% for AGIs over 200k)
Earned income credit: $1,765 (reported on 4.6% of returns)
Here:
$1,765
State:
$2,311
(% of AGI for various income ranges: 27.0% for AGIs below $25k, 27.6% for AGIs $25k-50k, 0.9% for AGIs $50k-75k)
Percentage of individuals using paid preparers for their 2020 taxes: 93.6%
Here:
94%
State:
93%
(% for various income ranges: 91.2% for AGIs below $25k, 94.0% for AGIs $25k-50k, 94.2% for AGIs $50k-75k, 94.9% for AGIs $75k-100k, 94.7% for AGIs $100k-200k, 94.9% for AGIs over 200k)
Averages for the 2012 tax year for zip code 60142, filed in 2013:
Average Adjusted Gross Income (AGI) in 2012: $70,030 (Individual Income Tax Returns)
Here:
$70,030
State:
$68,058
Salary/wage: $63,971 (reported on 68.7% of returns)
Here:
$63,971
State:
$55,396
(% of AGI for various income ranges: 51.0% for AGIs below $25k, 52.0% for AGIs $25k-50k, 52.9% for AGIs $50k-75k, 61.5% for AGIs $75k-100k, 71.0% for AGIs $100k-200k, 60.7% for AGIs over 200k)
Taxable interest for individuals: $1,521 (reported on 48.7% of returns)
This zip code:
$1,521
Illinois:
$1,969
(% of AGI for various income ranges: 3.1% for AGIs below $25k, 1.5% for AGIs $25k-50k, 1.3% for AGIs $50k-75k, 0.9% for AGIs $75k-100k, 0.7% for AGIs $100k-200k, 1.0% for AGIs over 200k)
Ordinary dividends: $4,788 (reported on 35.5% of returns)
Here:
$4,788
State:
$7,786
(% of AGI for various income ranges: 4.8% for AGIs below $25k, 3.0% for AGIs $25k-50k, 2.6% for AGIs $50k-75k, 2.4% for AGIs $75k-100k, 1.6% for AGIs $100k-200k, 3.5% for AGIs over 200k)
Net capital gain/loss in AGI: +$3,781 (reported on 28.3% of returns)
Here:
+$3,781
State:
+$22,183
(% of AGI for various income ranges: 0.6% for AGIs $50k-75k, 0.6% for AGIs $75k-100k, 1.0% for AGIs $100k-200k, 6.7% for AGIs over 200k)
Profit/loss from business: +$10,759 (reported on 11.6% of returns)
Here:
+$10,759
State:
+$12,903
(% of AGI for various income ranges: 4.3% for AGIs below $25k, 3.0% for AGIs $25k-50k, 2.0% for AGIs $50k-75k, 1.2% for AGIs $75k-100k, 1.4% for AGIs $100k-200k, 1.6% for AGIs over 200k)
Taxable individual retirement arrangement distribution: $17,531 (reported on 27.6% of returns)
60142:
$17,531
Illinois:
$17,929
(% of AGI for various income ranges: 14.0% for AGIs below $25k, 11.1% for AGIs $25k-50k, 8.6% for AGIs $50k-75k, 6.8% for AGIs $75k-100k, 5.6% for AGIs $100k-200k, 4.2% for AGIs over 200k)
Self-employment retirement plans: $8,720 (reported on 0.4% of returns)
60142:
$8,720
Illinois:
$24,666
Total itemized deductions: $23,645 (25% of AGI, reported on 59.4% of returns)
Here:
$23,645
State:
$26,433
Here:
25.0% of AGI
State:
19.2% of AGI
(% of AGI for various income ranges: 34.9% for AGIs below $25k, 24.3% for AGIs $25k-50k, 22.1% for AGIs $50k-75k, 20.7% for AGIs $75k-100k, 18.7% for AGIs $100k-200k, 13.8% for AGIs over 200k)
Charity contributions: $2,586 (reported on 52.7% of returns)
Here:
$2,586
State:
$4,525
(% of AGI for various income ranges: 2.1% for AGIs below $25k, 2.1% for AGIs $25k-50k, 2.0% for AGIs $50k-75k, 2.0% for AGIs $75k-100k, 1.9% for AGIs $100k-200k, 1.9% for AGIs over 200k)
Taxes paid: $10,274 (reported on 59.2% of returns)
60142:
$10,274
State:
$11,968
(% of AGI for various income ranges: 11.6% for AGIs below $25k, 9.0% for AGIs $25k-50k, 8.8% for AGIs $50k-75k, 9.0% for AGIs $75k-100k, 8.7% for AGIs $100k-200k, 7.0% for AGIs over 200k)
Earned income credit: $1,878 (reported on 5.8% of returns)
Here:
$1,878
State:
$2,349
(% of AGI for various income ranges: 2.3% for AGIs below $25k, 0.5% for AGIs $25k-50k)
Percentage of individuals using paid preparers for their 2012 taxes: 56.3%
Here:
56%
State:
57%
(% for various income ranges: 48.9% for AGIs below $25k, 57.2% for AGIs $25k-50k, 61.0% for AGIs $50k-75k, 59.5% for AGIs $75k-100k, 57.8% for AGIs $100k-200k, 70.7% for AGIs over 200k)
Averages for the 2004 tax year for zip code 60142, filed in 2005:
Average Adjusted Gross Income (AGI) in 2004: $67,105 (Individual Income Tax Returns)
Here:
$67,105
State:
$54,625
Salary/wage: $57,572 (reported on 75.9% of returns)
Here:
$57,572
State:
$46,811
(% of AGI for various income ranges: 104.3% for AGIs below $10k, 47.6% for AGIs $10k-25k, 60.9% for AGIs $25k-50k, 67.4% for AGIs $50k-75k, 75.7% for AGIs $75k-100k, 60.9% for AGIs over 100k)
Taxable interest for individuals: $2,085 (reported on 69.1% of returns)
This zip code:
$2,085
Illinois:
$2,101
(% of AGI for various income ranges: 16.8% for AGIs below $10k, 7.4% for AGIs $10k-25k, 3.3% for AGIs $25k-50k, 2.1% for AGIs $50k-75k, 1.4% for AGIs $75k-100k, 1.6% for AGIs over 100k)
Taxable dividends: $3,374 (reported on 42.2% of returns)
Here:
$3,374
State:
$4,306
(% of AGI for various income ranges: 9.6% for AGIs below $10k, 4.8% for AGIs $10k-25k, 2.5% for AGIs $25k-50k, 1.7% for AGIs $50k-75k, 1.2% for AGIs $75k-100k, 2.3% for AGIs over 100k)
Net capital gain/loss: +$11,244 (reported on 34.2% of returns)
Here:
+$11,244
State:
+$17,321
(% of AGI for various income ranges: -2.2% for AGIs below $10k, -0.1% for AGIs $10k-25k, 0.7% for AGIs $25k-50k, 1.0% for AGIs $50k-75k, 1.0% for AGIs $75k-100k, 11.8% for AGIs over 100k)
Profit/loss from business: +$10,696 (reported on 12.8% of returns)
Here:
+$10,696
State:
+$11,771
(% of AGI for various income ranges: -0.6% for AGIs below $10k, 4.7% for AGIs $10k-25k, 3.0% for AGIs $25k-50k, 1.4% for AGIs $50k-75k, 1.4% for AGIs $75k-100k, 2.2% for AGIs over 100k)
IRA payment deduction: $3,262 (reported on 3.3% of returns)
60142:
$3,262
Illinois:
$3,087
(% of AGI for various income ranges: 0.4% for AGIs $10k-25k, 0.4% for AGIs $25k-50k, 0.2% for AGIs $50k-75k, 0.1% for AGIs $75k-100k, 0.1% for AGIs over 100k)
Self-employed pension: $9,015 (reported on 0.7% of returns)
Here:
$9,015
Illinois:
$16,965
Total itemized deductions: $20,731 (24% of AGI, reported on 64.7% of returns)
Here:
$20,731
State:
$20,239
Here:
24.3% of AGI
State:
19.5% of AGI
(% of AGI for various income ranges: 59.8% for AGIs below $10k, 35.3% for AGIs $10k-25k, 24.2% for AGIs $25k-50k, 22.8% for AGIs $50k-75k, 21.0% for AGIs $75k-100k, 15.5% for AGIs over 100k)
Charity contributions deductions: $2,840 (3% of AGI, reported on 59.3% of returns)
Here:
$2,840
State:
$3,719
Here:
3.2% of AGI
State:
3.4% of AGI
(% of AGI for various income ranges: 2.6% for AGIs below $10k, 2.9% for AGIs $10k-25k, 2.4% for AGIs $25k-50k, 2.1% for AGIs $50k-75k, 2.2% for AGIs $75k-100k, 2.8% for AGIs over 100k)
Total tax: $9,192 (reported on 84.1% of returns)
60142:
$9,192
State:
$9,882
(% of AGI for various income ranges: 2.7% for AGIs below $10k, 3.7% for AGIs $10k-25k, 6.9% for AGIs $25k-50k, 8.2% for AGIs $50k-75k, 9.3% for AGIs $75k-100k, 15.9% for AGIs over 100k)
Earned income credit: $1,393 (reported on 3.6% of returns)
Here:
$1,393
State:
$1,788
Percentage of individuals using paid preparers for their 2004 taxes: 60.4%
Here:
60%
State:
61%
(% for various income ranges: 50.5% for AGIs below $10k, 61.2% for AGIs $10k-25k, 60.7% for AGIs $25k-50k, 62.4% for AGIs $50k-75k, 59.3% for AGIs $75k-100k, 64.9% for AGIs over 100k)
Likely homosexual households (counted as self-reported same-sex unmarried-partner households)
Lesbian couples: 0.2% of all households
Gay men: 0.0% of all households
Household received Food Stamps/SNAP in the past 12 months: 1,052 Household did not receive Food Stamps/SNAP in the past 12 months: 11,952
Women who had a birth in the past 12 months: 211 (211 now married, 0 unmarried) Women who did not have a birth in the past 12 months: 4,860 (2,485 now married, 2,354 unmarried)
Housing units in zip code 60142 with a mortgage: 6,280 (421 second mortgage, 22 home equity loan, 350 both second mortgage and home equity loan) Houses without a mortgage: 133
Median monthly owner costs for units with a mortgage: $1,971 Median monthly owner costs for units without a mortgage: $882
Residents with income below the poverty level in 2022:
This zip code:
6.9%
Whole state:
11.9%
Residents with income below 50% of the poverty level in 2022:
This zip code:
4.2%
Whole state:
5.7%
Median number of rooms in houses and condos:
Here:
6.2
State:
6.4
Median number of rooms in apartments:
Here:
4.1
State:
4.1
Notable locations in this zip code not listed on our city pages
Notable locations in zip code 60142: Pinecrest Country Club (A), Grafton Township Hall (B), Huntley Fire Protection District Station 2 (C), Huntley Fire Protection District Station 3 (D), Huntley Fire Protection District Station 1 (E). Display/hide their locations on the map
Parks in zip code 60142 include: Ol Timers Park (1), Freeman Kame Nature Preserve (2), Deicke Park (3), Freemans Kane County Forest Preserve (4). Display/hide their locations on the map
In group quarters: 7 (-1 institutionalized population)
Size of family households: 3,739 2-persons, 1,555 3-persons, 1,578 4-persons, 721 5-persons, 107 6-persons, 217 7-or-more-persons
Size of nonfamily households: 4,841 1-person, 320 2-persons, 28 3-persons
4,601 married couples with children.
1,247 single-parent households (205 men, 1,042 women).
89.7% of residents of 60142 zip code speak English at home.
4.6% of residents speak Spanish at home (58% very well, 34% well, 7% not well).
3.4% of residents speak other Indo-European language at home (67% very well, 13% well, 14% not well, 7% not at all).
2.3% of residents speak Asian or Pacific Island language at home (95% very well, 5% well).
1.2% of residents speak other language at home (93% very well, 6% well, 1% not well).
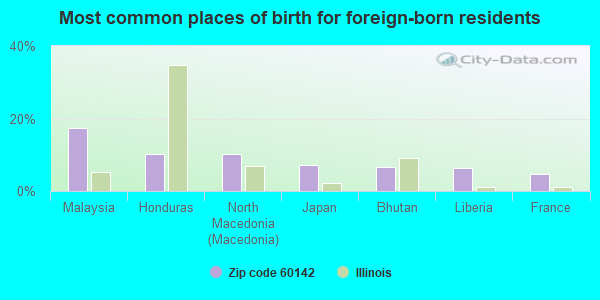
Foreign born population: 2,784 (9.6%) (67.3% of them are naturalized citizens)
This zip code:
9.6%
Whole state:
14.4%
17%Malaysia
10%Honduras
10%North Macedonia (Macedonia)
7%Japan
7%Bhutan
6%Liberia
5%France
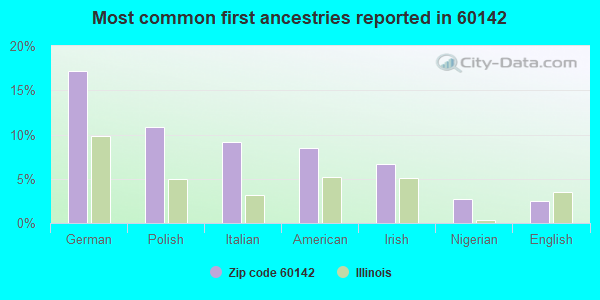
17%German
11%Polish
9%Italian
8%American
7%Irish
3%Nigerian
3%English
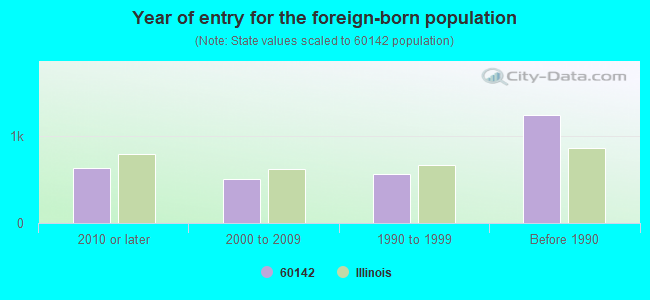
Year of entry for the foreign-born population
6342010 or later
5052000 to 2009
5601990 to 1999
1,247Before 1990
Major facilities with environmental interests located in this zip code:
HS CROCKER CO INC (12100 SMITH DR in HUNTLEY, IL)
STATE MASTER (Illinois EPA Project) - SOLID WASTE PROGRAM, HAZARDOUS WASTE PROGRAM, AIR PROGRAM AIR MINOR (AIRS/AFS) CRITERIA AND HAZARDOUS AIR POLLUTANT INVENTORY (Inventory of air pollution sources) HAZARDOUS WASTE BIENNIAL REPORTER (Resource Conservation and Recovery Act (tracking hazardous waste)) - ICIS-, ENFORCEMENT/COMPLIANCE ACTIVITY Small Quantity Generators, between 100 kg and 1000 kg of hazardous waste/month (Resource Conservation and Recovery Act (tracking hazardous waste)) - ICIS-, ENFORCEMENT/COMPLIANCE ACTIVITY Business SIC classification: PACKAGING PAPER AND PLASTICS FILM, COATED AND LAMINATED Business NAICS classification: COMMERCIAL GRAVURE PRINTING.; COMMERCIAL FLEXOGRAPHIC PRINTING.; PREPRESS SERVICES. Organizations: H S CROCKER CO INC (CONTACT/OPERATOR)
Alternative names: CROCKER HS CO INC
COLONY INC (11419 SMITH DRIVE in HUNTLEY, IL)
STATE MASTER (Illinois EPA Project) - SOLID WASTE PROGRAM, HAZARDOUS WASTE PROGRAM, AIR PROGRAM STATE MASTER (Illinois EPA Project) - National Pollutant Discharge Elimination System Permit AIR MINOR (AIRS/AFS) National Pollutant Discharge Elimination System NON-MAJOR (Tracking pollutant discharge elimination systems) - permit Small Quantity Generators, between 100 kg and 1000 kg of hazardous waste/month (Resource Conservation and Recovery Act (tracking hazardous waste)) - notification Business SIC classification: PREPARED FEEDS AND FEED INGREDIENTS FOR ANIMALS AND FOWLS, EXCEPT DOGS AND CATS Organizations: MILK SPECIALTIES CO. (CONTACT/OWNER)
Alternative names: MILK SPECIALTIES
NORTHERN FS INC (RAILROAD ST in HUNTLEY, IL)
STATE MASTER (Illinois EPA Project) - AIR PROGRAM STATE MASTER (Illinois EPA Project) - SOLID WASTE PROGRAM AIR MINOR (AIRS/AFS) (Resource Conservation and Recovery Act (tracking hazardous waste)) Business SIC classification: FARM SUPPLIES Organizations: MCHENRY FS INC (CONTACT/OWNER)
Alternative names: MCHENRY FS INC
HAMPSHIRE SAND & GRAVEL INC (10960 FOSTER RD. in HUNTLEY, IL)
STATE MASTER (Illinois EPA Project) - AIR PROGRAM STATE MASTER (Illinois EPA Project) - National Pollutant Discharge Elimination System Permit AIR MINOR (AIRS/AFS) AIR SYNTHETIC MINOR (AIRS/AFS) CRITERIA AND HAZARDOUS AIR POLLUTANT INVENTORY (Inventory of air pollution sources) Business SIC classification: CONSTRUCTION SAND AND GRAVEL; READY-MIXED CONCRETE
DEAN FOODS (11713 MILL ST. in HUNTLEY, IL)
STATE MASTER (Illinois EPA Project) - AIR PROGRAM, National Pollutant Discharge Elimination System Permit, SOLID WASTE PROGRAM AIR MINOR (AIRS/AFS) National Pollutant Discharge Elimination System NON-MAJOR (Tracking pollutant discharge elimination systems) - permit Small Quantity Generators, between 100 kg and 1000 kg of hazardous waste/month (Resource Conservation and Recovery Act (tracking hazardous waste)) - notification TRI REPORTER (Tracking of toxic chemicals releasing facilities) Business SIC classification: FLUID MILK; NONCLASSIFIABLE ESTABLISHMENTS Organizations: DEAN BILL (CONTACT/OWNER)
Alternative names: DEAN FOODS CO-HUNTLEY, DEAN FOODS-HUNTLEY, DEAN ILLINOIS DAIRIES LLC, DEAN ILLINOIS DAIRY-HUNTLEY
HD CATTY CORP (11117 SOUTH CHURCH STREET in HUNTLEY, IL)
STATE MASTER (Illinois EPA Project) - SOLID WASTE PROGRAM, HAZARDOUS WASTE PROGRAM AIR SYNTHETIC MINOR (AIRS/AFS) CRITERIA AND HAZARDOUS AIR POLLUTANT INVENTORY (Inventory of air pollution sources) HAZARDOUS WASTE BIENNIAL REPORTER (Resource Conservation and Recovery Act (tracking hazardous waste)) Small Quantity Generators, between 100 kg and 1000 kg of hazardous waste/month (Resource Conservation and Recovery Act (tracking hazardous waste)) TRI REPORTER (Tracking of toxic chemicals releasing facilities) Business SIC classification: PACKAGING PAPER AND PLASTICS FILM, COATED AND LAMINATED Business NAICS classification: LAMINATED ALUMINUM FOIL MANUFACTURING FOR FLEXIBLE PACKAGING USES. Organizations: H D CATTY CORP (CONTACT/OPERATOR)
Alternative names: CATTY CORP., CATTY H D CORP
PENTAPLEX INC (11314 MAIN STREET in HUNTLEY, IL)
STATE MASTER (Illinois EPA Project) - SOLID WASTE PROGRAM, HAZARDOUS WASTE PROGRAM, AIR PROGRAM AIR MINOR (AIRS/AFS) TSD (Resource Conservation and Recovery Act (tracking hazardous waste)) TRI REPORTER (Tracking of toxic chemicals releasing facilities) Business SIC classification: PRINTED CIRCUIT BOARDS; ELECTRONIC COMPONENTS Organizations: LAWRENCE CHARLES (CONTACT/OWNER)
MEYER MATERIAL CO (19N543 SQUARE BARN RD in HUNTLEY, IL)
STATE MASTER (Illinois EPA Project) - AIR PROGRAM AIR MINOR (AIRS/AFS) CRITERIA AND HAZARDOUS AIR POLLUTANT INVENTORY (Inventory of air pollution sources) National Pollutant Discharge Elimination System NON-MAJOR (Tracking pollutant discharge elimination systems) - permit Business SIC classification: READY-MIXED CONCRETE Business NAICS classification: READY-MIX CONCRETE MANUFACTURING. Alternative names: MEYER MATERIAL CO-HUNTLEY YARD #45, MEYER MATERIAL-HUNTLEY YARD 45
OUTLOOK ENVELOPE CO (11220 E MAIN ST in HUNTLEY, IL)
STATE MASTER (Illinois EPA Project) - SOLID WASTE PROGRAM, HAZARDOUS WASTE PROGRAM Large Quantity Generators, more that 1000 kg of hazardous waste/month (Resource Conservation and Recovery Act (tracking hazardous waste)) - notification Organizations: MILLER EDWARD O (CONTACT/OWNER)
MANNING CONCRETE (11804 S RTE 47 in HUNTLEY, IL)
STATE MASTER (Illinois EPA Project) - SOLID WASTE PROGRAM, HAZARDOUS WASTE PROGRAM (Resource Conservation and Recovery Act (tracking hazardous waste)) Organizations: LYNN TIMOTHY K (CONTACT/OWNER)
Alternative names: KOUBENEC MOTOR SERVICE, NATIONAL INTL ROOFING CORP
ACTION COLOR INC (11111 KILEY DRIVE in HUNTLEY, IL)
STATE MASTER (Illinois EPA Project) - AIR PROGRAM AIR MINOR (AIRS/AFS) CRITERIA AND HAZARDOUS AIR POLLUTANT INVENTORY (Inventory of air pollution sources) Business SIC classification: NONCLASSIFIABLE ESTABLISHMENTS
KEARNEY-NATIONAL INC (221 E. MAIN ST. in HUNTLEY, IL)
STATE MASTER (Illinois EPA Project) - SOLID WASTE PROGRAM, HAZARDOUS WASTE PROGRAM, AIR PROGRAM AIR MINOR (AIRS/AFS) CRITERIA AND HAZARDOUS AIR POLLUTANT INVENTORY (Inventory of air pollution sources) Business SIC classification: MAGNETIC AND OPTICAL RECORDING MEDIA; NONCLASSIFIABLE ESTABLISHMENTS
HUNTLEY EAST WWTF (COUNTY HIGHWAY 11 in HUNTLEY, IL)
STATE MASTER (Illinois EPA Project) - National Pollutant Discharge Elimination System Permit National Pollutant Discharge Elimination System MAJOR (Tracking pollutant discharge elimination systems) - permit National Pollutant Discharge Elimination System NON-MAJOR (Tracking pollutant discharge elimination systems) - permit Business SIC classification: SEWERAGE SYSTEMS Alternative names: HUNTLEY EAST WWTF, VILLAGE OF, HUNTLEY, VILLAGE OF
Housing units lacking complete kitchen facilities: 1.7%
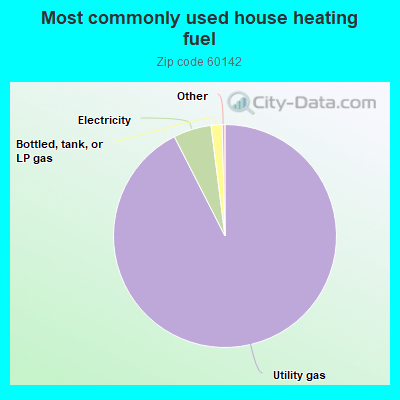
92.5%Utility gas
5.5%Electricity
1.6%Bottled, tank, or LP gas
Population in 1990: 4,351. Population change in the 1990s: +3,540 (+81.4%).
Place of birth for U.S.-born residents:
This state: 21,150
Northeast: 815
Midwest: 2,097
South: 1,204
West: 768
37% of the 60142 zip code residents lived in the same house 5 years ago. Out of people who lived in different houses, 20% lived in this county. Out of people who lived in different counties, 50% lived in Illinois.
90% of the 60142 zip code residents lived in the same house 1 year ago. Out of people who lived in different houses, 33% moved from this county. Out of people who lived in different houses, 68% moved from different county within same state. Out of people who lived in different houses, 2% moved from different state. Out of people who lived in different houses, 0% moved from abroad.
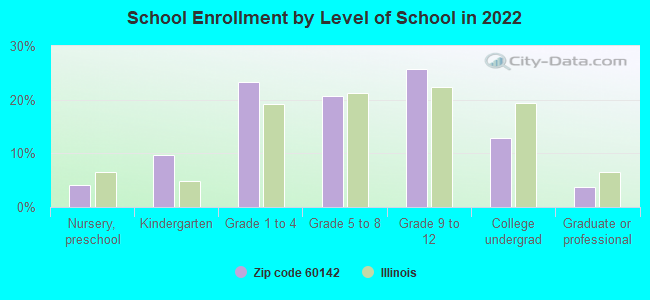
Private vs. public school enrollment:
Students in private schools in grades 1 to 8 (elementary and middle school): 170
Here:
6.8%
Illinois:
13.3%
Students in private schools in grades 9 to 12 (high school): 19
Here:
1.3%
Illinois:
9.9%
Students in private undergraduate colleges: 161
Here:
21.5%
Illinois:
27.4%
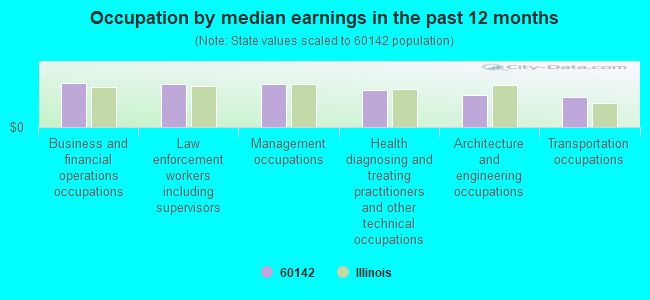
Occupation by median earnings in the past 12 months ($)
103,242Business and financial operations occupations
100,664Law enforcement workers including supervisors
100,067Management occupations
87,801Health diagnosing and treating practitioners and other technical occupations
75,045Architecture and engineering occupations
70,212Transportation occupations
Companies with federal contracts located in this zip code:
STEALTH AEROSPACE METALS, INC (11514 SMITH DRIVE in HUNTLEY, IL; small business) : $57,770 in 9 contractsfrom 2004 to 2005
Contracts for Pipe, Tube and Rigid Tubing, Plate, Sheet, Strip, and Foil; Nonferrous Base Metal, Bars and Rods by Defense Logistics Agency, Army Signed by year:2000: $0; 2001: $0; 2002: $0; 2003: $0; 2004: $59,430; 2005: -$1,660; 2006: $0.
Biggest contracts:
$18,552 with Defense Logistics Agency for Pipe, Tube and Rigid Tubing. Signed on 2004-11-10. Completion date: 2004-12-18.
$15,075, same as above.Signed on 2004-10-01. Completion date: 2005-09-30.
$10,924 with Army for Plate, Sheet, Strip, and Foil; Nonferrous Base Metal. Signed on 2004-06-24. Completion date: 2004-07-06.
$7,887 with Defense Logistics Agency for Pipe, Tube and Rigid Tubing. Signed on 2004-10-01. Completion date: 2005-09-30.
Top industries in this zip code by the number of employees in 2005:
Wholesale Trade: Automobile and Other Motor Vehicle Merchant Wholesalers (100-249 employees: 1 establishment, 20-49 employees: 1 establishment)
Construction: Poured Concrete Foundation and Structure Contractors (100-249: 1, 10-19: 1, 5-9: 1, 1-4: 3)
Construction: New Housing Operative Builders (100-249: 1, 1-4: 1)
Administrative and Support and Waste Management and Remediation Services: Landscaping Services (50-99: 1, 20-49: 1, 10-19: 1, 5-9: 2, 1-4: 10)
People in group quarters in 2000:
2 people in agriculture workers' dormitories on farms
Fatal accident statistics in 2014:
Fatal accident count: 2
Vehicles involved in fatal accidents: 3
Fatal accidents caused by drunken drivers: 1
Fatalities: 2
Persons involved in fatal accidents: 5
Pedestrians involved in fatal accidents: 0
Fatal accident statistics in 2013:
Fatal accident count: 1
Vehicles involved in fatal accidents: 2
Fatal accidents caused by drunken drivers: 0
Fatalities: 1
Persons involved in fatal accidents: 2
Pedestrians involved in fatal accidents: 0
Home Mortgage Disclosure Act Aggregated Statistics For Year 2009 (Based on 10 partial tracts)
A) FHA, FSA/RHS & VA Home Purchase Loans
B) Conventional Home Purchase Loans
C) Refinancings
D) Home Improvement Loans
E) Loans on Dwellings For 5+ Families
F) Non-occupant Loans on < 5 Family Dwellings (A B C & D)
G) Loans On Manufactured Home Dwelling (A B C & D)
Number
Average Value
Number
Average Value
Number
Average Value
Number
Average Value
Number
Average Value
Number
Average Value
Number
Average Value
LOANS ORIGINATED
201
$217,853
219
$200,996
1,443
$209,325
22
$85,491
4
$260,788
45
$187,304
7
$220,576
APPLICATIONS APPROVED, NOT ACCEPTED
8
$213,315
14
$229,199
132
$224,060
6
$32,388
0
$0
0
$0
1
$285,380
APPLICATIONS DENIED
25
$202,174
20
$234,450
387
$229,981
17
$76,236
0
$0
18
$141,982
0
$0
APPLICATIONS WITHDRAWN
23
$247,688
34
$230,049
222
$221,099
6
$112,657
0
$0
6
$173,467
0
$0
FILES CLOSED FOR INCOMPLETENESS
7
$192,531
1
$129,330
83
$227,132
1
$158,760
0
$0
1
$110,800
0
$0
Aggregated Statistics For Year 2008 (Based on 10 partial tracts)
A) FHA, FSA/RHS & VA Home Purchase Loans
B) Conventional Home Purchase Loans
C) Refinancings
D) Home Improvement Loans
E) Loans on Dwellings For 5+ Families
F) Non-occupant Loans on < 5 Family Dwellings (A B C & D)
Number
Average Value
Number
Average Value
Number
Average Value
Number
Average Value
Number
Average Value
Number
Average Value
LOANS ORIGINATED
146
$229,959
301
$228,201
747
$228,699
28
$87,186
0
$0
53
$180,257
APPLICATIONS APPROVED, NOT ACCEPTED
7
$185,053
55
$239,524
138
$218,850
9
$74,844
0
$0
10
$174,752
APPLICATIONS DENIED
33
$227,407
52
$254,410
397
$259,315
32
$64,380
2
$139,720
19
$229,007
APPLICATIONS WITHDRAWN
12
$279,153
55
$240,230
145
$249,995
8
$125,620
0
$0
3
$169,230
FILES CLOSED FOR INCOMPLETENESS
3
$361,487
8
$188,746
59
$240,873
4
$46,562
0
$0
1
$196,800
Aggregated Statistics For Year 2007 (Based on 10 partial tracts)
A) FHA, FSA/RHS & VA Home Purchase Loans
B) Conventional Home Purchase Loans
C) Refinancings
D) Home Improvement Loans
E) Loans on Dwellings For 5+ Families
F) Non-occupant Loans on < 5 Family Dwellings (A B C & D)
Number
Average Value
Number
Average Value
Number
Average Value
Number
Average Value
Number
Average Value
Number
Average Value
LOANS ORIGINATED
42
$213,560
693
$226,954
1,008
$201,216
104
$69,643
2
$170,450
57
$195,619
APPLICATIONS APPROVED, NOT ACCEPTED
3
$193,437
101
$232,455
151
$196,871
25
$58,485
0
$0
5
$151,506
APPLICATIONS DENIED
15
$200,591
75
$240,018
570
$230,902
55
$85,715
0
$0
21
$194,636
APPLICATIONS WITHDRAWN
9
$172,329
96
$231,242
168
$234,074
14
$148,991
0
$0
9
$261,933
FILES CLOSED FOR INCOMPLETENESS
0
$0
13
$255,197
86
$253,438
3
$171,393
0
$0
1
$266,110
Aggregated Statistics For Year 2006 (Based on 10 partial tracts)
A) FHA, FSA/RHS & VA Home Purchase Loans
B) Conventional Home Purchase Loans
C) Refinancings
D) Home Improvement Loans
E) Loans on Dwellings For 5+ Families
F) Non-occupant Loans on < 5 Family Dwellings (A B C & D)
G) Loans On Manufactured Home Dwelling (A B C & D)
Number
Average Value
Number
Average Value
Number
Average Value
Number
Average Value
Number
Average Value
Number
Average Value
Number
Average Value
LOANS ORIGINATED
21
$225,564
1,433
$193,227
1,171
$191,675
116
$74,605
2
$499,660
90
$178,213
1
$45,980
APPLICATIONS APPROVED, NOT ACCEPTED
2
$236,970
220
$195,642
207
$199,254
28
$82,253
0
$0
18
$200,604
0
$0
APPLICATIONS DENIED
4
$235,208
126
$203,071
525
$211,305
48
$98,991
0
$0
16
$180,805
1
$174,350
APPLICATIONS WITHDRAWN
2
$151,600
122
$199,752
265
$208,486
17
$150,891
0
$0
13
$224,820
0
$0
FILES CLOSED FOR INCOMPLETENESS
1
$107,930
23
$228,781
98
$220,358
2
$53,045
0
$0
0
$0
0
$0
Aggregated Statistics For Year 2005 (Based on 10 partial tracts)
A) FHA, FSA/RHS & VA Home Purchase Loans
B) Conventional Home Purchase Loans
C) Refinancings
D) Home Improvement Loans
E) Loans on Dwellings For 5+ Families
F) Non-occupant Loans on < 5 Family Dwellings (A B C & D)
G) Loans On Manufactured Home Dwelling (A B C & D)
Number
Average Value
Number
Average Value
Number
Average Value
Number
Average Value
Number
Average Value
Number
Average Value
Number
Average Value
LOANS ORIGINATED
39
$198,824
1,492
$194,398
1,352
$194,648
95
$78,278
1
$647,400
92
$177,192
3
$77,810
APPLICATIONS APPROVED, NOT ACCEPTED
0
$0
161
$205,386
156
$199,152
20
$99,142
0
$0
12
$192,382
1
$124,650
APPLICATIONS DENIED
2
$233,220
137
$199,442
510
$214,253
53
$85,572
0
$0
6
$177,893
1
$19,510
APPLICATIONS WITHDRAWN
4
$234,435
138
$211,977
346
$221,860
32
$177,312
0
$0
19
$187,568
0
$0
FILES CLOSED FOR INCOMPLETENESS
1
$172,400
28
$249,388
69
$219,206
5
$48,028
0
$0
1
$144,590
0
$0
Aggregated Statistics For Year 2004 (Based on 10 partial tracts)
A) FHA, FSA/RHS & VA Home Purchase Loans
B) Conventional Home Purchase Loans
C) Refinancings
D) Home Improvement Loans
E) Loans on Dwellings For 5+ Families
F) Non-occupant Loans on < 5 Family Dwellings (A B C & D)
G) Loans On Manufactured Home Dwelling (A B C & D)
Number
Average Value
Number
Average Value
Number
Average Value
Number
Average Value
Number
Average Value
Number
Average Value
Number
Average Value
LOANS ORIGINATED
45
$187,291
1,350
$191,552
1,190
$191,169
76
$72,014
0
$0
73
$165,244
1
$27,270
APPLICATIONS APPROVED, NOT ACCEPTED
2
$156,705
107
$211,983
160
$181,066
19
$52,563
0
$0
3
$163,710
0
$0
APPLICATIONS DENIED
9
$194,402
94
$177,121
461
$194,538
76
$62,877
0
$0
16
$157,519
1
$10,710
APPLICATIONS WITHDRAWN
3
$154,873
139
$193,063
375
$209,960
20
$74,488
1
$471,840
17
$135,261
2
$30,950
FILES CLOSED FOR INCOMPLETENESS
1
$101,940
15
$191,458
60
$205,528
10
$72,619
0
$0
2
$120,495
0
$0
Aggregated Statistics For Year 2003 (Based on 10 partial tracts)
A) FHA, FSA/RHS & VA Home Purchase Loans
B) Conventional Home Purchase Loans
C) Refinancings
D) Home Improvement Loans
E) Loans on Dwellings For 5+ Families
F) Non-occupant Loans on < 5 Family Dwellings (A B C & D)
Number
Average Value
Number
Average Value
Number
Average Value
Number
Average Value
Number
Average Value
Number
Average Value
LOANS ORIGINATED
77
$189,704
1,261
$191,005
2,946
$172,744
59
$55,557
1
$426,610
75
$148,850
APPLICATIONS APPROVED, NOT ACCEPTED
4
$226,380
105
$174,080
274
$175,087
12
$57,232
0
$0
10
$109,602
APPLICATIONS DENIED
10
$205,389
74
$185,950
451
$164,248
45
$41,937
0
$0
6
$111,562
APPLICATIONS WITHDRAWN
8
$201,441
140
$195,037
398
$174,387
6
$37,013
0
$0
12
$198,297
FILES CLOSED FOR INCOMPLETENESS
3
$195,670
20
$239,309
77
$174,412
5
$36,726
0
$0
2
$88,635
Aggregated Statistics For Year 2002 (Based on 4 partial tracts)
A) FHA, FSA/RHS & VA Home Purchase Loans
B) Conventional Home Purchase Loans
C) Refinancings
D) Home Improvement Loans
F) Non-occupant Loans on < 5 Family Dwellings (A B C & D)
Number
Average Value
Number
Average Value
Number
Average Value
Number
Average Value
Number
Average Value
LOANS ORIGINATED
3
$222,047
31
$190,544
85
$175,002
3
$35,093
2
$132,090
APPLICATIONS APPROVED, NOT ACCEPTED
0
$0
3
$177,843
9
$188,266
0
$0
0
$0
APPLICATIONS DENIED
0
$0
4
$186,582
12
$171,592
2
$34,895
0
$0
APPLICATIONS WITHDRAWN
0
$0
2
$199,535
11
$149,218
0
$0
0
$0
FILES CLOSED FOR INCOMPLETENESS
0
$0
1
$162,660
4
$129,492
0
$0
0
$0
Aggregated Statistics For Year 2001 (Based on 4 partial tracts)
A) FHA, FSA/RHS & VA Home Purchase Loans
B) Conventional Home Purchase Loans
C) Refinancings
D) Home Improvement Loans
F) Non-occupant Loans on < 5 Family Dwellings (A B C & D)
Number
Average Value
Number
Average Value
Number
Average Value
Number
Average Value
Number
Average Value
LOANS ORIGINATED
2
$144,015
22
$180,752
67
$172,665
4
$30,452
1
$129,090
APPLICATIONS APPROVED, NOT ACCEPTED
0
$0
1
$193,680
5
$101,102
1
$16,500
0
$0
APPLICATIONS DENIED
0
$0
2
$111,270
11
$164,305
2
$40,300
0
$0
APPLICATIONS WITHDRAWN
0
$0
2
$214,185
6
$152,045
1
$26,600
0
$0
FILES CLOSED FOR INCOMPLETENESS
0
$0
0
$0
3
$145,697
0
$0
0
$0
Aggregated Statistics For Year 2000 (Based on 4 partial tracts)
A) FHA, FSA/RHS & VA Home Purchase Loans
B) Conventional Home Purchase Loans
C) Refinancings
D) Home Improvement Loans
F) Non-occupant Loans on < 5 Family Dwellings (A B C & D)
Number
Average Value
Number
Average Value
Number
Average Value
Number
Average Value
Number
Average Value
LOANS ORIGINATED
2
$125,485
19
$173,206
15
$145,288
5
$30,240
1
$51,810
APPLICATIONS APPROVED, NOT ACCEPTED
0
$0
2
$216,445
2
$170,370
1
$32,920
0
$0
APPLICATIONS DENIED
0
$0
3
$191,867
5
$121,964
2
$22,065
0
$0
APPLICATIONS WITHDRAWN
0
$0
2
$167,520
2
$145,450
1
$63,620
0
$0
FILES CLOSED FOR INCOMPLETENESS
0
$0
0
$0
1
$151,460
0
$0
0
$0
Aggregated Statistics For Year 1999 (Based on 3 partial tracts)
A) FHA, FSA/RHS & VA Home Purchase Loans
B) Conventional Home Purchase Loans
C) Refinancings
D) Home Improvement Loans
E) Loans on Dwellings For 5+ Families
F) Non-occupant Loans on < 5 Family Dwellings (A B C & D)
2002 - 2018 National Fire Incident Reporting System (NFIRS) incidents
Based on the data from the years 2002 - 2018 the average number of fires per year is 61. The highest number of fire incidents - 105 took place in 2010, and the least - 40 in 2002. The data has a growing trend.
When looking into fire subcategories, the most reports belonged to: Structure Fires (48.5%), and Outside Fires (35.8%).
Fire incident types reported to NFIRS in Zip Code 60142


 Nearest zip codes: 60136, 60180, 60140, 60156, 60014, 60102.


 Based on the data from the years 2002 - 2018 the average number of fires per year is 61. The highest number of fire incidents - 105 took place in 2010, and the least - 40 in 2002. The data has a growing trend.
 When looking into fire subcategories, the most reports belonged to: Structure Fires (48.5%), and Outside Fires (35.8%).