Grand Reserve neighborhood in Algonquin, Illinois (IL), 60102, 60142 detailed profile
Settings
X


Business Search - 14 Million verified businesses
Area: 0.638 square miles
Population: 761
Population density:
| Grand Reserve: | 1,192 people per square mile |
| Algonquin: | 3,040 people per square mile |

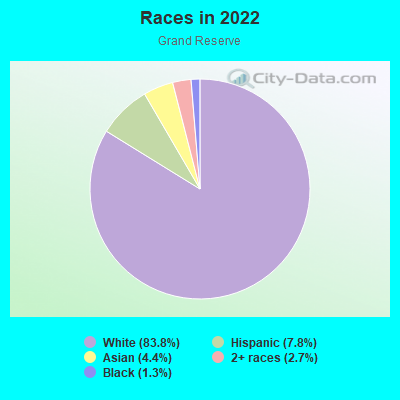
- 64583.8%White
- 607.8%Hispanic or Latino
- 344.4%Asian
- 212.7%Two or more races
- 101.3%Black
Median household income in 2022:
| Grand Reserve: | $165,006 |
| Algonquin: | $129,658 |
Distribution of median household income
![Distribution of median household income]()
- 5Less than $10,000
- 21$10,000 to $19,999
- 8$20,000 to $29,999
- 22$30,000 to $39,999
- 5$40,000 to $49,999
- 9$50,000 to $59,999
- 31$60,000 to $74,999
- 8$75,000 to $99,999
- 14$100,000 to $124,999
- 21$125,000 to $149,999
- 86$150,000 to $199,999
- 56$200,000 or more

Distribution of owner-occupied house/condo value
![Distribution of owner-occupied house/condo value]()
- 7Less than $50,000
- 8$50,000 to $99,999
- 3$100,000 to $149,999
- 13$150,000 to $199,999
- 34$200,000 to $249,999
- 27$250,000 to $299,999
- 152$300,000 to $399,999
- 25$400,000 to $499,999
- 8$500,000 to $749,999
- 3$1,000,000 or more

Distribution of rent paid by renters
![Distribution of rent paid by renters]()
- 19$900 to $999
- 5$1,000 to $1,249
- 19$1,500 to $1,999
- 24$2,000 or more

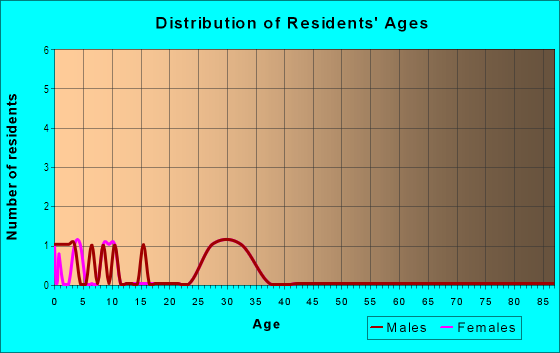
| Males: | 337 |
| Females: | 424 |
Males:
| This neighborhood: | 50.7 years |
| Whole city: | 40.2 years |
| This neighborhood: | 54.2 years |
| Whole city: | 42.1 years |
Average household size:
| Grand Reserve: | 2.9 people |
| Algonquin: | 2.7 people |
Percentage of family households:
| Grand Reserve: | 58.3% |
| Algonquin: | 58.1% |
| Here: | 45.6% |
| Algonquin: | 61.7% |
Percentage of married-couple families with children (among all households):
| Grand Reserve: | 28.2% |
| Algonquin: | 30.3% |
Percentage of single-mother households (among all households):
| Grand Reserve: | 6.9% |
| Algonquin: | 3.3% |
Percentage of never married males 15 years old and over:
Percentage of never married females 15 years old and over:
| Grand Reserve: | 10.5% |
| Algonquin: | 16.8% |
Percentage of never married females 15 years old and over:
| Grand Reserve: | 21.9% |
| village: | 12.3% |
Percentage of people that speak English not well or not at all:
| Grand Reserve: | 2.0% |
| Algonquin: | 2.1% |
Percentage of people born in this state:
Percentage of people born in another U.S. state:
Percentage of native residents but born outside the U.S.:
Percentage of foreign born residents:
| Here: | 69.6% |
| Algonquin: | 70.8% |
Percentage of people born in another U.S. state:
| Grand Reserve: | 19.2% |
| Algonquin: | 16.1% |
Percentage of native residents but born outside the U.S.:
| Here: | 1.3% |
| village: | 1.5% |
Percentage of foreign born residents:
| Here: | 10.0% |
| Algonquin: | 11.6% |
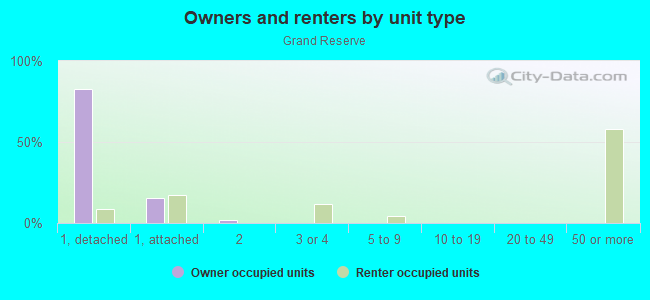
Owner-occupied
Renter-occupied

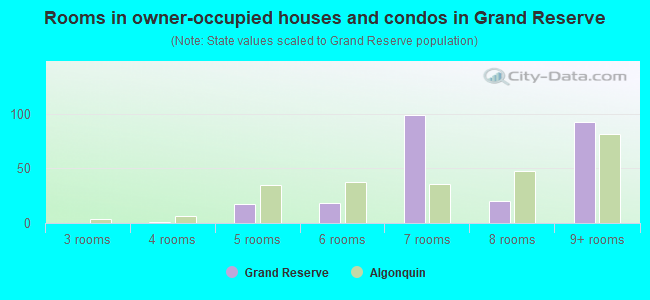
- Rooms in owner-occupied houses and condos in Grand Reserve
- 01 room
- 02 rooms
- 03 rooms
- 14 rooms
- 175 rooms
- 186 rooms
- 997 rooms
- 208 rooms
- 939+ rooms
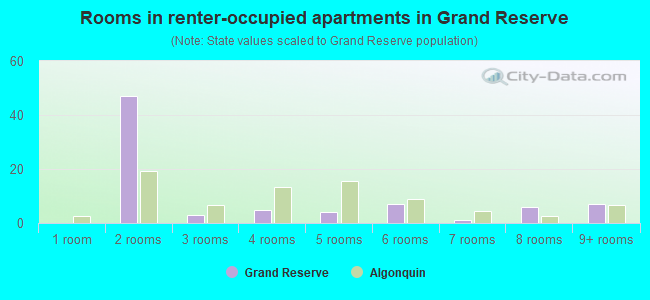
- Rooms in renter-occupied apartments in Grand Reserve
- 01 room
- 472 rooms
- 33 rooms
- 54 rooms
- 45 rooms
- 76 rooms
- 17 rooms
- 68 rooms
- 79+ rooms
Owner-occupied
Renter-occupied
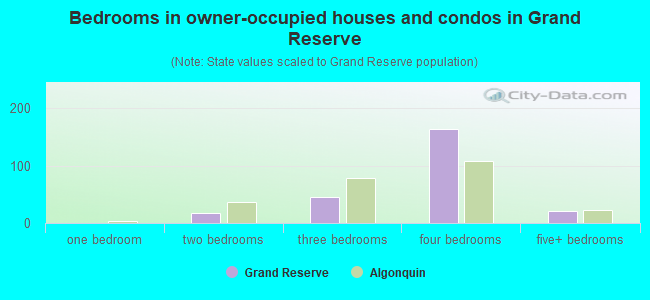
- Bedrooms in owner-occupied houses and condos in Grand Reserve
- 0no bedroom
- 01 bedroom
- 172 bedrooms
- 453 bedrooms
- 1644 bedrooms
- 215+ bedrooms
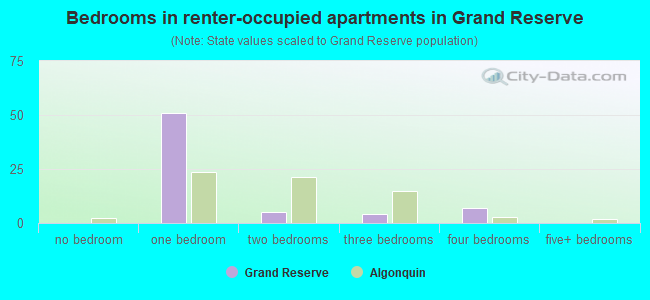
- Bedrooms in renter-occupied apartments in Grand Reserve
- 0no bedroom
- 511 bedroom
- 52 bedrooms
- 43 bedrooms
- 74 bedrooms
- 05+ bedrooms
Average number of cars or other vehicles available in houses/condos:
Average number of cars or other vehicles available in apartments:
| This neighborhood: | 2.5 |
| Algonquin: | 2.2 |
Average number of cars or other vehicles available in apartments:
| Here: | 1.3 |
| village: | 1.4 |
Percentage of units with a mortgage:
| Grand Reserve: | 72.4% |
| Algonquin: | 74.1% |
Housing prices:
- Average estimated value of detached houses in 2022 (81.3% of all units):
Grand Reserve: $322,528 Illinois: $310,164
- Average estimated value of townhouses or other attached units in 2022 (14.6% of all units):
This neighborhood: $232,968 Illinois: $286,230
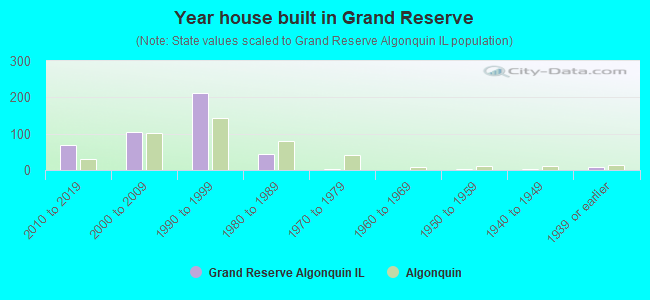
- Year house built in Grand Reserve
- 02020 or later
- 692010 to 2019
- 1042000 to 2009
- 2111990 to 1999
- 431980 to 1989
- 41970 to 1979
- 01960 to 1969
- 41950 to 1959
- 21940 to 1949
- 71939 or earlier
City-data.com crime index for village in 2020 (higher means more crime):
| City: | 92.4 |
| U.S. average: | 219.5 |
Travel time to work (commute)
![Travel time to work (commute)]()
- 49Less than 5 minutes
- 415 to 9 minutes
- 3110 to 14 minutes
- 8215 to 19 minutes
- 3220 to 24 minutes
- 1925 to 29 minutes
- 10830 to 34 minutes
- 835 to 39 minutes
- 3340 to 44 minutes
- 8445 to 59 minutes
- 4860 to 89 minutes
- 290 or more minutes

Means of transportation to work
![Means of transportation to work]()
- 73.0%349Drove a car alone
- 3.8%18Carpooled
- 0.6%3Long-distance train or commuter rail
- 0.6%3Motorcycle
- 4.0%19Other means
- 18.0%86Worked at home

Time leaving home to go to work
![Time leaving home to go to work]()
- 2912:00 a.m. to 4:59 a.m.
- 215:00 a.m. to 5:29 a.m.
- 245:30 a.m. to 5:59 a.m.
- 496:00 a.m. to 6:29 a.m.
- 596:30 a.m. to 6:59 a.m.
- 1257:00 a.m. to 7:29 a.m.
- 507:30 a.m. to 7:59 a.m.
- 608:00 a.m. to 8:29 a.m.
- 258:30 a.m. to 8:59 a.m.
- 229:00 a.m. to 9:59 a.m.
- 1010:00 a.m. to 10:59 a.m.
- 4712:00 p.m. to 3:59 p.m.
- 444:00 p.m. to 11:59 p.m.

Occupations of males:
- Percentage of males in management occupations (except farmers):
Here: 11.5% village: 14.2%
- Percentage of males in business and financial operations occupations:
Here: 6.7% village: 5.8%
- Percentage of males in computer and mathematical occupations:
Here: 1.0% village: 4.8%
- Percentage of males in architecture and engineering occupations:
Here: 2.2% village: 4.9%
- Percentage of males in legal occupations:
Here: 1.7% village: 0.4%
- Percentage of males in education, training, and library occupations:
Here: 4.4% village: 2.2%
- Percentage of males in arts, design, entertainment, sports, and media occupations:
Here: 1.1% village: 2.2%
- Percentage of males in healthcare practitioners and technical occupations:
Here: 1.9% village: 2.5%
- Percentage of males in service occupations:
Here: 11.1% village: 8.8%
- Percentage of males in sales and office occupations:
Here: 64.5% village: 22.5%
- Percentage of males in construction, extraction, and maintenance occupations:
Here: 6.8% village: 5.9%
- Percentage of males in transportation occupations:
Here: 6.8% village: 5.9%
Occupations of females:
- Percentage of females in management occupations (except farmers):
Here: 6.1% village: 10.5%
- Percentage of females in business and financial operations occupations:
Here: 9.1% village: 9.3%
- Percentage of females in computer and mathematical occupations:
Here: 2.2% village: 1.5%
- Percentage of females in architecture and engineering occupations:
Here: 2.1% village: 1.6%
- Percentage of females in life, physical, and social science occupations:
Here: 1.9% village: 0.6%
- Percentage of females in legal occupations:
Here: 1.1% village: 0.9%
- Percentage of females in education, training, and library occupations:
Here: 19.7% village: 15.6%
- Percentage of females in arts, design, entertainment, sports, and media occupations:
Here: 1.6% village: 1.6%
- Percentage of females in healthcare practitioners and technical occupations:
Here: 17.5% village: 14.5%
- Percentage of females in service occupations:
Here: 1.8% village: 11.0%
- Percentage of females in sales and office occupations:
Here: 42.4% village: 26.2%
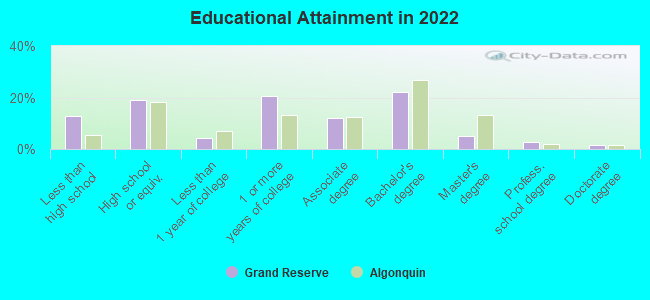
Education in this neighborhood (subdivision or community):
- Percentage of people 3 years and older in K-12 schools:
Grand Reserve: 13.5% Algonquin: 16.3%
- Percentage of people 3 years and older in undergraduate colleges:
Grand Reserve: 11.7% Algonquin: 5.4%
- Percentage of people 3 years and older in grad. or professional schools:
Grand Reserve: 1.8% Algonquin: 1.5%
- Percentage of students K-12 enrolled in private schools:
Grand Reserve: 15.5% Algonquin: 6.2%
Percentage of population below poverty level:
| Grand Reserve: | 4.5% |
| Algonquin: | 4.4% |
Median year owner moved in (as recorded in 2022):
Median year renter moved in (as recorded in 2022):
| Grand Reserve: | 1996 |
| Algonquin: | 2007 |
Median year renter moved in (as recorded in 2022):
| Grand Reserve: | 2012 |
| Algonquin: | 2017 |
Percentage of married-couple families with both working:
| Grand Reserve: | 488.0% |
| Algonquin: | 77.3% |
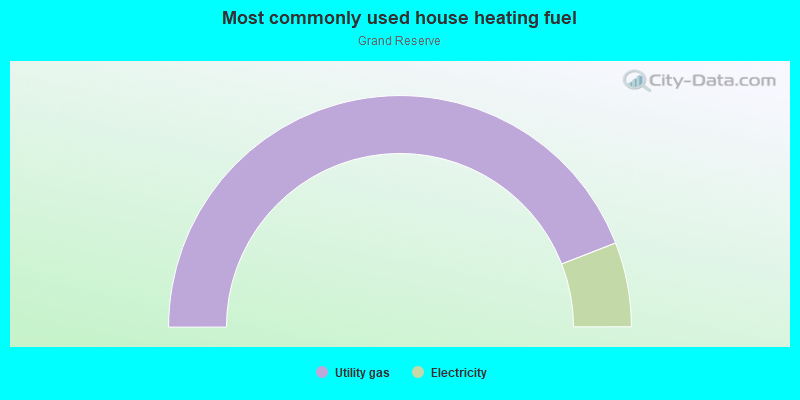
- 88.2%Utility gas
- 11.8%Electricity
Roads and streets:
N County Line Rd
Length: 0.65 miles
Direction: E-W
Direction: E-W
Roads and streets:
Harnish Dr
Length: 1.27 miles
Directions: E-W, N-S, SE-NW, SW-NE
Directions: E-W, N-S, SE-NW, SW-NE
N County Line Rd
Length: 0.65 miles
Direction: E-W
Direction: E-W
Eineke Blvd
Length: 0.47 miles
Directions: N-S, SE-NW
Directions: N-S, SE-NW
Williamsburg Dr
Length: 0.26 miles
Directions: E-W, SW-NE
Directions: E-W, SW-NE
Pond View Dr
Length: 0.24 miles
Direction: E-W
Direction: E-W
Spella Dr
Length: 0.16 miles
Direction: E-W
Direction: E-W
Savannah Ln
Length: 0.12 miles
Direction: N-S
Direction: N-S
Randall Rd
Length: 0.11 miles
Direction: N-S
Address range: 11994 to 12083
Direction: N-S
Address range: 11994 to 12083
Lenore Ln
Length: 0.09 miles
Direction: E-W
Direction: E-W
Savannah Ct
Length: 0.08 miles
Direction: N-S
Direction: N-S
Eineke Ct
Length: 0.06 miles
Direction: E-W
Direction: E-W
Boyer Rd
Length: 0.04 miles
Direction: N-S
Direction: N-S
Eshbach Ct
Length: 0.03 miles
Direction: N-S
Direction: N-S
Other features:
Woods Crk
Length: 0.14 miles
Directions: N-S, SW-NE
Directions: N-S, SW-NE