Estimated zip code population in 2022: 2,502 Zip code population in 2010: 2,513 Zip code population in 2000: 2,617
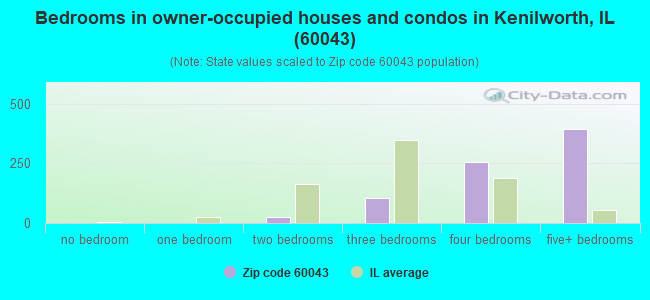
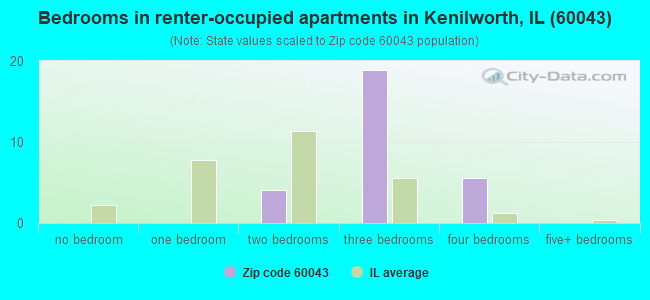
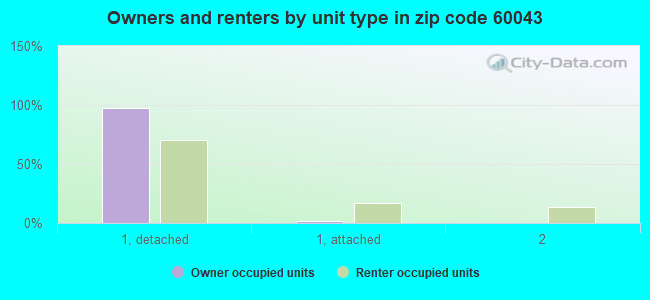
Houses and condos: 832 Renter-occupied apartments: 30
% of renters here:
4%
State:
33%
March 2022 cost of living index in zip code 60043: 111.0 (more than average, U.S. average is 100)
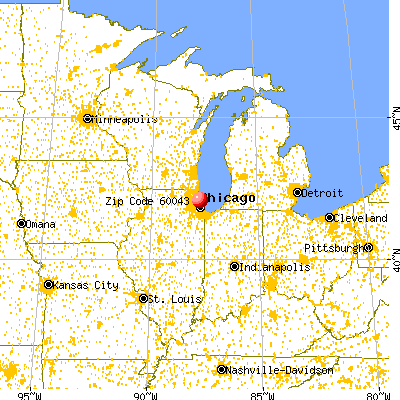
Land area: 0.6 sq. mi. Water area: 0.0 sq. mi.
Population density: 4,073 people per square mile
(average).
OSM Map
General Map
Google Map
MSN Map
OSM Map
General Map
Google Map
MSN Map
OSM Map
General Map
Google Map
MSN Map
OSM Map
General Map
Google Map
MSN Map
Please wait while loading the map...
Real estate property taxes paid for housing units in 2022:
This zip code:
0.7% ($9,718)
Illinois:
2.0% ($4,912)
Median real estate property taxes paid for housing units with mortgages in 2022: $9,569 (0.7%) Median real estate property taxes paid for housing units with no mortgage in 2022: $9,944 (0.7%)
Business Search- 14 Million verified businesses
Males: 1,202
(48.1%)
Females: 1,299
(51.9%)
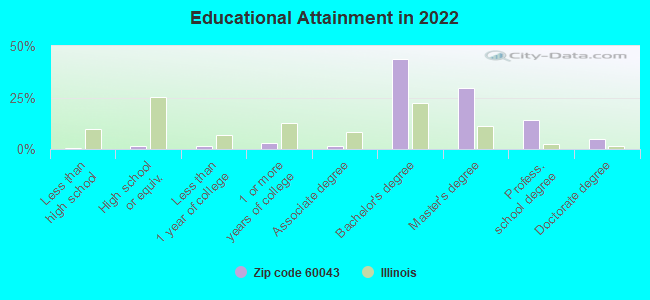
For population 25 years and over in 60043:
High school or higher: 101.9%
Bachelor's degree or higher: 94.3%
Graduate or professional degree: 49.6%
Unemployed: 2.7%
Mean travel time to work (commute): 36.4 minutes
For population 15 years and over in 60043:
Never married: 19.7%
Now married: 72.1%
Separated: 0.0%
Widowed: 2.9%
Divorced: 5.3%
Zip code 60043 compared to state average:
Median household income significantly above state average.
Median house value significantly above state average.
Unemployed percentage below state average.
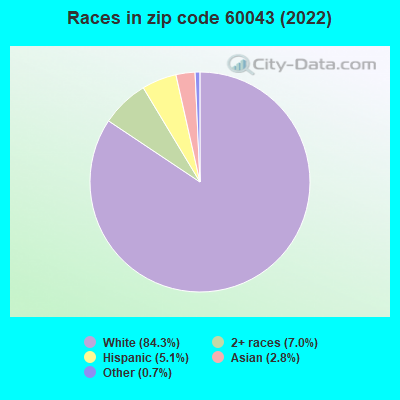
Black race population percentage significantly below state average.
Hispanic race population percentage significantly below state average.
Foreign-born population percentage below state average.
Renting percentage significantly below state average.
Length of stay since moving in above state average.
Number of rooms per house significantly above state average.
House age above state average.
Percentage of population with a bachelor's degree or higher above state average.
Estimated median house/condo value in 2022: $1,428,995
60043:
$1,428,995
Illinois:
$251,600
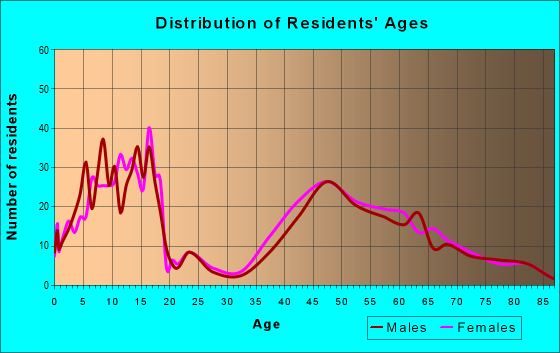
Median resident age:
This zip code:
40.9 years
Illinois median age:
39.1 years
Average household size:
This zip code:
3.1 people
Illinois:
2.4 people
Averages for the 2020 tax year for zip code 60043, filed in 2021:
Average Adjusted Gross Income (AGI) in 2020: $948,950 (Individual Income Tax Returns)
Here:
$948,950
State:
$82,626
Salary/wage: $504,167 (reported on 74.3% of returns)
Here:
$504,167
State:
$66,640
(% of AGI for various income ranges: 1372.5% for AGIs below $25k, 3540.0% for AGIs $25k-50k, 8796.7% for AGIs $50k-75k, 8480.0% for AGIs $75k-100k, 20220.0% for AGIs $100k-200k, 344242.7% for AGIs over 200k)
Taxable interest for individuals: $17,393 (reported on 70.5% of returns)
This zip code:
$17,393
Illinois:
$2,376
(% of AGI for various income ranges: 10.0% for AGIs below $25k, 190.0% for AGIs $25k-50k, 106.7% for AGIs $50k-75k, 115.0% for AGIs $75k-100k, 892.5% for AGIs $100k-200k, 11267.3% for AGIs over 200k)
Ordinary dividends: $91,059 (reported on 75.2% of returns)
Here:
$91,059
State:
$9,061
(% of AGI for various income ranges: 623.8% for AGIs below $25k, 1036.7% for AGIs $25k-50k, 1430.0% for AGIs $50k-75k, 2700.0% for AGIs $75k-100k, 4602.5% for AGIs $100k-200k, 62106.4% for AGIs over 200k)
Net capital gain/loss in AGI: +$358,054 (reported on 72.4% of returns)
Here:
+$358,054
State:
+$31,684
(% of AGI for various income ranges: 381.2% for AGIs below $25k, 1633.3% for AGIs $25k-50k, 983.3% for AGIs $50k-75k, 3305.0% for AGIs $75k-100k, 4022.5% for AGIs $100k-200k, 244328.2% for AGIs over 200k)
Profit/loss from business: +$21,000 (reported on 20.0% of returns)
Here:
+$21,000
State:
+$12,175
(% of AGI for various income ranges: 92.5% for AGIs below $25k, 990.0% for AGIs $25k-50k, 760.0% for AGIs $100k-200k, 3395.5% for AGIs over 200k)
Taxable individual retirement arrangement distribution: $56,207 (reported on 13.3% of returns)
60043:
$56,207
Illinois:
$21,613
(% of AGI for various income ranges: 1936.7% for AGIs $25k-50k, 2250.0% for AGIs $100k-200k, 5807.3% for AGIs over 200k)
Self-employed (Keogh) retirement plans: $40,825 (reported on 7.6% of returns)
60043:
$40,825
Illinois:
$30,962
(% of AGI for various income ranges: 2969.1% for AGIs over 200k)
Total itemized deductions: $113,338 (reported on 50.5% of returns)
Here:
$113,338
State:
$34,948
(% of AGI for various income ranges: 2866.7% for AGIs $25k-50k, 4330.0% for AGIs $75k-100k, 5685.0% for AGIs $100k-200k, 50971.8% for AGIs over 200k)
Charity contributions: $82,638 (reported on 44.8% of returns)
Here:
$82,638
State:
$13,122
(% of AGI for various income ranges: 216.7% for AGIs $25k-50k, 830.0% for AGIs $100k-200k, 34948.2% for AGIs over 200k)
Taxes paid: $9,621 (reported on 50.5% of returns)
60043:
$9,621
State:
$8,563
(% of AGI for various income ranges: 866.7% for AGIs $25k-50k, 785.0% for AGIs $75k-100k, 1377.5% for AGIs $100k-200k, 3755.5% for AGIs over 200k)
Percentage of individuals using paid preparers for their 2020 taxes: 92.4%
Here:
92%
State:
93%
(% for various income ranges: 86.4% for AGIs below $25k, 83.3% for AGIs $25k-50k, 100.0% for AGIs $50k-75k, 100.0% for AGIs $75k-100k, 91.7% for AGIs $100k-200k, 94.4% for AGIs over 200k)
Averages for the 2012 tax year for zip code 60043, filed in 2013:
Average Adjusted Gross Income (AGI) in 2012: $715,711 (Individual Income Tax Returns)
Here:
$715,711
State:
$68,058
Salary/wage: $345,002 (reported on 66.9% of returns)
Here:
$345,002
State:
$55,396
(% of AGI for various income ranges: 45.0% for AGIs below $25k, 57.2% for AGIs $25k-50k, 40.6% for AGIs $50k-75k, 57.7% for AGIs $75k-100k, 43.1% for AGIs $100k-200k, 31.7% for AGIs over 200k)
Taxable interest for individuals: $15,112 (reported on 69.4% of returns)
This zip code:
$15,112
Illinois:
$1,969
(% of AGI for various income ranges: 2.6% for AGIs below $25k, 2.7% for AGIs $25k-50k, 2.0% for AGIs $50k-75k, 2.9% for AGIs $75k-100k, 3.3% for AGIs $100k-200k, 1.4% for AGIs over 200k)
Ordinary dividends: $81,201 (reported on 73.6% of returns)
Here:
$81,201
State:
$7,786
(% of AGI for various income ranges: 22.9% for AGIs below $25k, 15.0% for AGIs $25k-50k, 9.4% for AGIs $50k-75k, 9.8% for AGIs $75k-100k, 10.5% for AGIs $100k-200k, 8.2% for AGIs over 200k)
Net capital gain/loss in AGI: +$237,236 (reported on 68.6% of returns)
Here:
+$237,236
State:
+$22,183
(% of AGI for various income ranges: 13.7% for AGIs below $25k, 8.0% for AGIs $25k-50k, 7.2% for AGIs $50k-75k, 3.5% for AGIs $75k-100k, 6.7% for AGIs $100k-200k, 23.4% for AGIs over 200k)
Profit/loss from business: +$40,154 (reported on 19.8% of returns)
Here:
+$40,154
State:
+$12,903
(% of AGI for various income ranges: 10.0% for AGIs below $25k, 17.1% for AGIs $50k-75k, 7.0% for AGIs $100k-200k, 0.9% for AGIs over 200k)
Taxable individual retirement arrangement distribution: $123,030 (reported on 19.0% of returns)
60043:
$123,030
Illinois:
$17,929
(% of AGI for various income ranges: 10.7% for AGIs below $25k, 14.3% for AGIs $50k-75k, 8.9% for AGIs $100k-200k, 3.1% for AGIs over 200k)
Self-employment retirement plans: $40,022 (reported on 7.4% of returns)
60043:
$40,022
Illinois:
$24,666
Total itemized deductions: $126,585 (12% of AGI, reported on 67.8% of returns)
Here:
$126,585
State:
$26,433
Here:
12.1% of AGI
State:
19.2% of AGI
(% of AGI for various income ranges: 61.6% for AGIs below $25k, 31.4% for AGIs $25k-50k, 34.9% for AGIs $50k-75k, 27.0% for AGIs $75k-100k, 30.9% for AGIs $100k-200k, 11.1% for AGIs over 200k)
Charity contributions: $24,111 (reported on 60.3% of returns)
Here:
$24,111
State:
$4,525
(% of AGI for various income ranges: 1.4% for AGIs below $25k, 1.6% for AGIs $25k-50k, 3.6% for AGIs $50k-75k, 2.1% for AGIs $75k-100k, 2.9% for AGIs $100k-200k, 2.0% for AGIs over 200k)
Taxes paid: $77,256 (reported on 66.9% of returns)
60043:
$77,256
State:
$11,968
(% of AGI for various income ranges: 22.5% for AGIs below $25k, 15.0% for AGIs $25k-50k, 16.8% for AGIs $50k-75k, 9.9% for AGIs $75k-100k, 14.8% for AGIs $100k-200k, 6.9% for AGIs over 200k)
Earned income credit: $1,500 (reported on 1.7% of returns)
Here:
$1,500
State:
$2,349
(% of AGI for various income ranges: 1.2% for AGIs below $25k)
Percentage of individuals using paid preparers for their 2012 taxes: 71.9%
Here:
72%
State:
57%
(% for various income ranges: 64.7% for AGIs below $25k, 60.0% for AGIs $25k-50k, 60.0% for AGIs $50k-75k, 60.0% for AGIs $75k-100k, 75.0% for AGIs $100k-200k, 80.4% for AGIs over 200k)
Averages for the 2004 tax year for zip code 60043, filed in 2005:
Average Adjusted Gross Income (AGI) in 2004: $460,990 (Individual Income Tax Returns)
Here:
$460,990
State:
$54,625
Salary/wage: $272,867 (reported on 62.9% of returns)
Here:
$272,867
State:
$46,811
(% of AGI for various income ranges: 50.0% for AGIs $10k-25k, 49.0% for AGIs $25k-50k, 41.1% for AGIs $50k-75k, 43.7% for AGIs $75k-100k, 36.9% for AGIs over 100k)
Taxable interest for individuals: $22,892 (reported on 80.9% of returns)
This zip code:
$22,892
Illinois:
$2,101
(% of AGI for various income ranges: 5.5% for AGIs $10k-25k, 7.9% for AGIs $25k-50k, 9.1% for AGIs $50k-75k, 4.0% for AGIs $75k-100k, 3.9% for AGIs over 100k)
Taxable dividends: $58,161 (reported on 80.7% of returns)
Here:
$58,161
State:
$4,306
(% of AGI for various income ranges: 12.3% for AGIs $10k-25k, 13.7% for AGIs $25k-50k, 10.5% for AGIs $50k-75k, 16.1% for AGIs $75k-100k, 10.0% for AGIs over 100k)
Net capital gain/loss: +$199,803 (reported on 71.3% of returns)
Here:
+$199,803
State:
+$17,321
(% of AGI for various income ranges: 17.5% for AGIs $10k-25k, 17.5% for AGIs $25k-50k, 5.5% for AGIs $50k-75k, 11.0% for AGIs $75k-100k, 31.2% for AGIs over 100k)
Profit/loss from business: +$78,100 (reported on 18.1% of returns)
Here:
+$78,100
State:
+$11,771
(% of AGI for various income ranges: 3.8% for AGIs $10k-25k, 1.8% for AGIs $25k-50k, 4.5% for AGIs $50k-75k, 8.2% for AGIs $75k-100k, 3.0% for AGIs over 100k)
IRA payment deduction: $4,321 (reported on 2.2% of returns)
60043:
$4,321
Illinois:
$3,087
Self-employed pension: $39,531 (reported on 7.6% of returns)
Here:
$39,531
Illinois:
$16,965
Total itemized deductions: $80,846 (11% of AGI, reported on 60.3% of returns)
Here:
$80,846
State:
$20,239
Here:
10.7% of AGI
State:
19.5% of AGI
(% of AGI for various income ranges: 26.2% for AGIs $10k-25k, 43.2% for AGIs $25k-50k, 47.1% for AGIs $50k-75k, 35.2% for AGIs $75k-100k, 9.9% for AGIs over 100k)
Charity contributions deductions: $28,018 (4% of AGI, reported on 57.6% of returns)
Here:
$28,018
State:
$3,719
Here:
3.6% of AGI
State:
3.4% of AGI
(% of AGI for various income ranges: 2.8% for AGIs $10k-25k, 3.5% for AGIs $25k-50k, 3.9% for AGIs $50k-75k, 4.0% for AGIs $75k-100k, 3.5% for AGIs over 100k)
Total tax: $131,204 (reported on 80.0% of returns)
60043:
$131,204
State:
$9,882
(% of AGI for various income ranges: 5.7% for AGIs $10k-25k, 7.8% for AGIs $25k-50k, 8.4% for AGIs $50k-75k, 9.2% for AGIs $75k-100k, 23.0% for AGIs over 100k)
Earned income credit: $700 (reported on 0.8% of returns)
Here:
$700
State:
$1,788
Percentage of individuals using paid preparers for their 2004 taxes: 74.1%
Here:
74%
State:
61%
(% for various income ranges: 71.0% for AGIs below $10k, 60.9% for AGIs $10k-25k, 64.6% for AGIs $25k-50k, 76.9% for AGIs $50k-75k, 71.1% for AGIs $75k-100k, 79.2% for AGIs over 100k)
Household received Food Stamps/SNAP in the past 12 months: 12 Household did not receive Food Stamps/SNAP in the past 12 months: 777
Women who had a birth in the past 12 months: 18 (18 now married, 0 unmarried) Women who did not have a birth in the past 12 months: 450 (268 now married, 178 unmarried)
Housing units in zip code 60043 with a mortgage: 490 (68 second mortgage, 2 home equity loan, 63 both second mortgage and home equity loan) Houses without a mortgage: 8
Median monthly owner costs for units with a mortgage: $3,792 Median monthly owner costs for units without a mortgage: $1,519
Residents with income below the poverty level in 2022:
This zip code:
3.3%
Whole state:
11.9%
Residents with income below 50% of the poverty level in 2022:
This zip code:
1.0%
Whole state:
5.7%
Median number of rooms in houses and condos:
Here:
10.0
State:
6.4
Median number of rooms in apartments:
Here:
6.1
State:
4.1
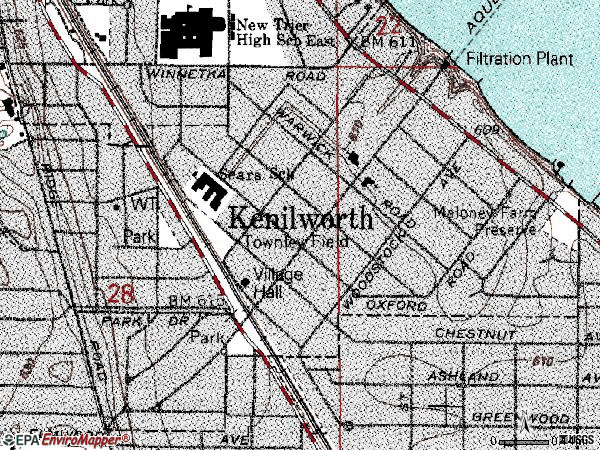
Notable locations in this zip code not listed on our city pages
Size of family households: 226 2-persons, 97 3-persons, 146 4-persons, 127 5-persons, 42 6-persons, 13 7-or-more-persons
Size of nonfamily households: 133 1-person
830 married couples with children.
35 single-parent households (35 women).
89.1% of residents of 60043 zip code speak English at home.
1.9% of residents speak Spanish at home (32% very well, 9% well, 59% not well).
6.6% of residents speak other Indo-European language at home (78% very well, 20% well, 3% not well).
1.5% of residents speak Asian or Pacific Island language at home (76% very well, 24% well).
0.3% of residents speak other language at home (100% very well).
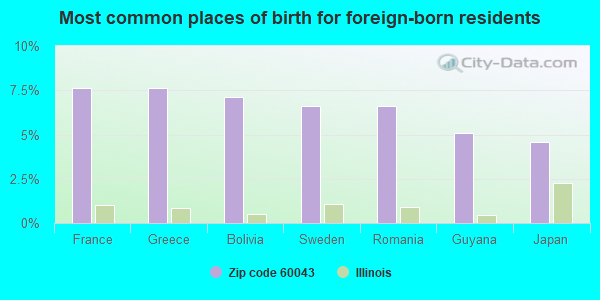
Foreign born population: 196 (7.8%) (30.3% of them are naturalized citizens)
This zip code:
7.8%
Whole state:
14.4%
8%France
8%Greece
7%Bolivia
7%Sweden
7%Romania
5%Guyana
5%Japan
20%German
14%English
13%Irish
6%American
6%Italian
4%Polish
4%European
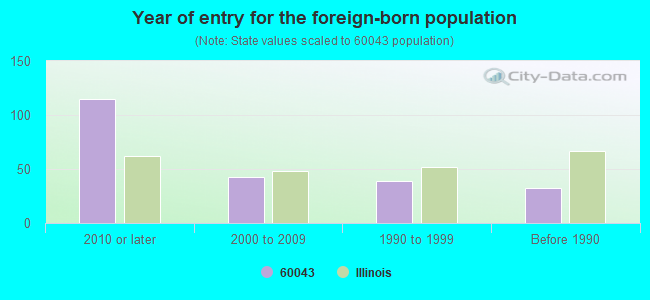
Year of entry for the foreign-born population
1152010 or later
432000 to 2009
391990 to 1999
32Before 1990
Facilities with environmental interests located in this zip code:
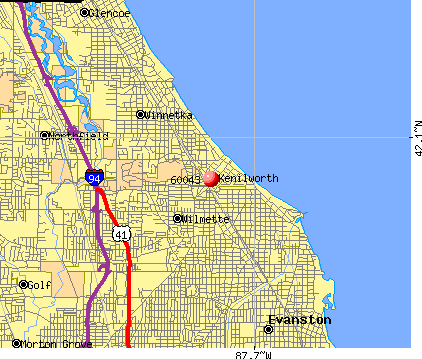
AETNA DEVELOPMENT CORP (614 GREENBAY RD in KENILWORTH, IL)
STATE MASTER (Illinois EPA Project) - HAZARDOUS WASTE PROGRAM Large Quantity Generators, more that 1000 kg of hazardous waste/month (Resource Conservation and Recovery Act (tracking hazardous waste)) Alternative names: GORAK STUDIO CENTER
GREEN BAY AUTOBODY (636 GREEN BAY RD in KENILWORTH, IL)
STATE MASTER (Illinois EPA Project) - HAZARDOUS WASTE PROGRAM Small Quantity Generators, between 100 kg and 1000 kg of hazardous waste/month (Resource Conservation and Recovery Act (tracking hazardous waste)) - notification Organizations: OROURKE THOMAS (CONTACT/OWNER)
Alternative names: GREEN BAY AUTO BODY REPAIRING
KENILWORTH CLEANERS (554 A GREENBAY RD in KENILWORTH, IL)
Small Quantity Generators, between 100 kg and 1000 kg of hazardous waste/month (Resource Conservation and Recovery Act (tracking hazardous waste)) - notification Organizations: KIM MR (CONTACT/OWNER)
KENILWORTH MEDICAL ASSOCIATES (534 GREENBAY RD in KENILWORTH, IL)
Small Quantity Generators, between 100 kg and 1000 kg of hazardous waste/month (Resource Conservation and Recovery Act (tracking hazardous waste)) - notification
KENILWORTH WATER TRMT FAC VILLAGE OF (1 KENILWORTH AVE in KENILWORTH, IL)
Small Quantity Generators, between 100 kg and 1000 kg of hazardous waste/month (Resource Conservation and Recovery Act (tracking hazardous waste)) - notification Organizations: KENILWORTH VILLAGE OF (CONTACT/OWNER)
Housing units lacking complete kitchen facilities: 1.8%
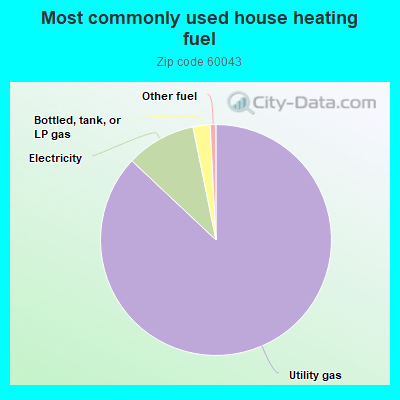
87.2%Utility gas
9.8%Electricity
2.4%Bottled, tank, or LP gas
0.8%Other fuel
Population in 1990: 2,509. Population change in the 1990s: +108 (+4.3%).
Place of birth for U.S.-born residents:
This state: 1,435
Northeast: 296
Midwest: 314
South: 108
West: 133
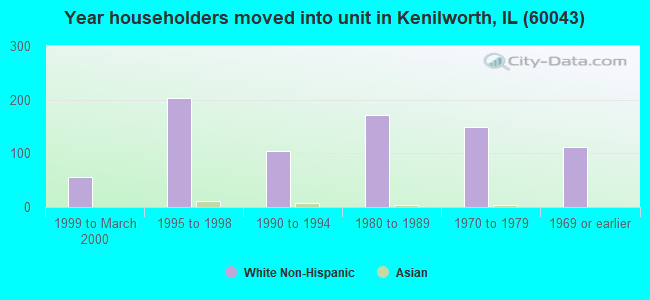
69% of the 60043 zip code residents lived in the same house 5 years ago. Out of people who lived in different houses, 82% lived in this county. Out of people who lived in different counties, 50% lived in Illinois.
92% of the 60043 zip code residents lived in the same house 1 year ago. Out of people who lived in different houses, 75% moved from this county. Out of people who lived in different houses, 8% moved from different county within same state. Out of people who lived in different houses, 9% moved from different state. Out of people who lived in different houses, 4% moved from abroad.
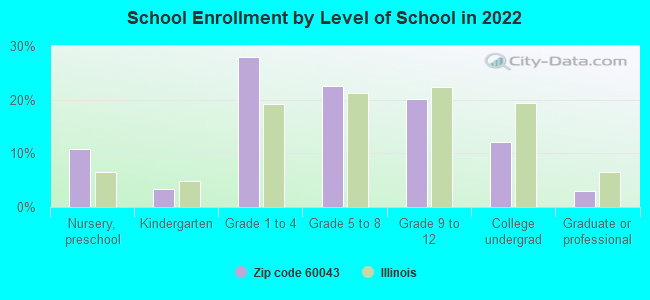
Private vs. public school enrollment:
Students in private schools in grades 1 to 8 (elementary and middle school): 15
Here:
3.3%
Illinois:
13.3%
Students in private schools in grades 9 to 12 (high school): 40
Here:
21.2%
Illinois:
9.9%
Students in private undergraduate colleges: 66
Here:
58.9%
Illinois:
27.4%
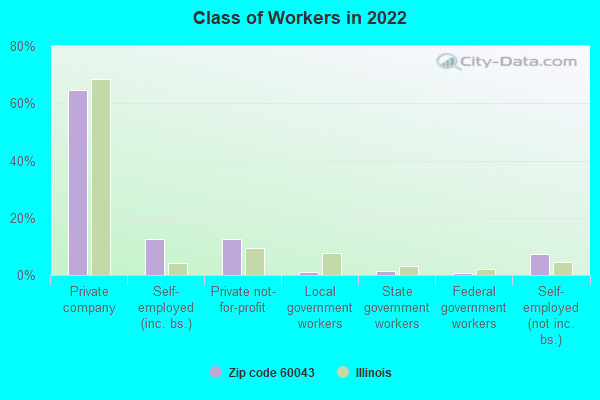
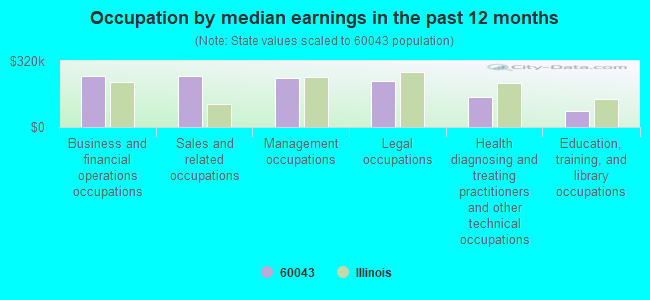
Occupation by median earnings in the past 12 months ($)
248,471Business and financial operations occupations
248,056Sales and related occupations
239,352Management occupations
225,393Legal occupations
146,919Health diagnosing and treating practitioners and other technical occupations
79,053Education, training, and library occupations
Top industries in this zip code by the number of employees in 2005:
Administrative and Support and Waste Management and Remediation Services: Travel Agencies (50-99 employees: 1 establishment)
Other Services (except Public Administration): Religious Organizations (20-49: 2)
Health Care and Social Assistance: Offices of Dentists (10-19: 2, 5-9: 3)
Health Care and Social Assistance: Offices of Physicians (except Mental Health Specialists) (20-49: 1, 5-9: 1, 1-4: 1)
Other Services (except Public Administration): Beauty Salons (10-19: 1, 1-4: 1)
Wholesale Trade: Electrical and Electronic Appliance, Television, and Radio Set Merchant Wholesalers (10-19: 1)
Professional, Scientific, and Technical Services: Architectural Services (5-9: 1)
Other Services (except Public Administration): Automotive Body, Paint, and Interior Repair and Maintenance (5-9: 1)
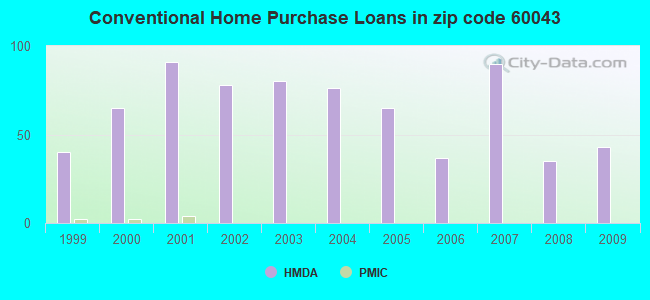
Home Mortgage Disclosure Act Aggregated Statistics For Year 2009 (Based on 2 partial tracts)
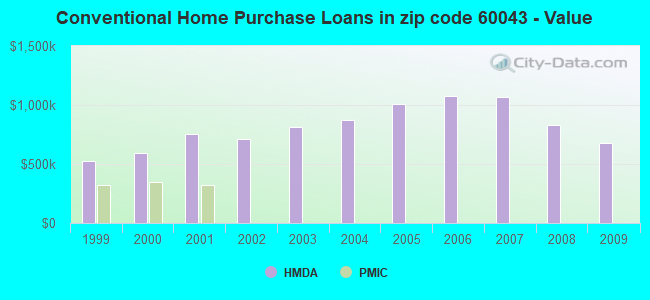
B) Conventional Home Purchase Loans
C) Refinancings
D) Home Improvement Loans
F) Non-occupant Loans on < 5 Family Dwellings (A B C & D)
Number
Average Value
Number
Average Value
Number
Average Value
Number
Average Value
LOANS ORIGINATED
43
$681,823
188
$665,119
2
$388,810
0
$0
APPLICATIONS APPROVED, NOT ACCEPTED
6
$1,201,242
11
$1,056,664
0
$0
0
$0
APPLICATIONS DENIED
4
$1,491,840
58
$997,539
0
$0
2
$372,960
APPLICATIONS WITHDRAWN
2
$388,810
9
$845,583
0
$0
0
$0
FILES CLOSED FOR INCOMPLETENESS
0
$0
2
$745,920
0
$0
0
$0
Aggregated Statistics For Year 2008 (Based on 2 partial tracts)
B) Conventional Home Purchase Loans
C) Refinancings
D) Home Improvement Loans
F) Non-occupant Loans on < 5 Family Dwellings (A B C & D)
G) Loans On Manufactured Home Dwelling (A B C & D)
Number
Average Value
Number
Average Value
Number
Average Value
Number
Average Value
Number
Average Value
LOANS ORIGINATED
35
$827,065
112
$727,988
6
$197,047
4
$413,985
0
$0
APPLICATIONS APPROVED, NOT ACCEPTED
9
$1,045,324
6
$537,995
0
$0
0
$0
0
$0
APPLICATIONS DENIED
4
$134,265
19
$1,043,503
4
$186,480
0
$0
2
$26,105
APPLICATIONS WITHDRAWN
9
$924,112
4
$1,062,470
0
$0
0
$0
0
$0
FILES CLOSED FOR INCOMPLETENESS
0
$0
7
$556,243
0
$0
4
$316,550
0
$0
Aggregated Statistics For Year 2007 (Based on 2 partial tracts)
B) Conventional Home Purchase Loans
C) Refinancings
D) Home Improvement Loans
F) Non-occupant Loans on < 5 Family Dwellings (A B C & D)
Number
Average Value
Number
Average Value
Number
Average Value
Number
Average Value
LOANS ORIGINATED
90
$1,067,867
78
$1,023,464
7
$729,137
9
$754,001
APPLICATIONS APPROVED, NOT ACCEPTED
7
$737,929
13
$1,259,744
4
$152,448
0
$0
APPLICATIONS DENIED
15
$1,228,033
22
$1,339,096
2
$177,155
2
$289,045
APPLICATIONS WITHDRAWN
6
$614,762
7
$898,834
0
$0
2
$282,515
FILES CLOSED FOR INCOMPLETENESS
0
$0
15
$852,711
0
$0
2
$745,920
Aggregated Statistics For Year 2006 (Based on 2 partial tracts)
B) Conventional Home Purchase Loans
C) Refinancings
D) Home Improvement Loans
F) Non-occupant Loans on < 5 Family Dwellings (A B C & D)
G) Loans On Manufactured Home Dwelling (A B C & D)
Number
Average Value
Number
Average Value
Number
Average Value
Number
Average Value
Number
Average Value
LOANS ORIGINATED
37
$1,072,260
93
$1,148,917
6
$134,577
11
$836,617
0
$0
APPLICATIONS APPROVED, NOT ACCEPTED
9
$710,281
9
$1,230,353
0
$0
4
$740,325
2
$61,540
APPLICATIONS DENIED
4
$996,735
7
$1,362,636
4
$643,822
0
$0
0
$0
APPLICATIONS WITHDRAWN
4
$1,141,258
9
$1,229,110
2
$2,376,690
0
$0
0
$0
FILES CLOSED FOR INCOMPLETENESS
2
$335,665
2
$186,480
0
$0
0
$0
0
$0
Aggregated Statistics For Year 2005 (Based on 2 partial tracts)
B) Conventional Home Purchase Loans
C) Refinancings
D) Home Improvement Loans
F) Non-occupant Loans on < 5 Family Dwellings (A B C & D)
Number
Average Value
Number
Average Value
Number
Average Value
Number
Average Value
LOANS ORIGINATED
65
$1,011,640
69
$861,240
9
$878,321
6
$569,697
APPLICATIONS APPROVED, NOT ACCEPTED
9
$497,280
2
$885,780
2
$1,715,615
0
$0
APPLICATIONS DENIED
13
$434,928
19
$1,159,513
6
$29,837
4
$30,770
APPLICATIONS WITHDRAWN
4
$312,820
11
$1,152,785
0
$0
4
$312,820
FILES CLOSED FOR INCOMPLETENESS
0
$0
9
$938,823
0
$0
2
$111,890
Aggregated Statistics For Year 2004 (Based on 2 partial tracts)
B) Conventional Home Purchase Loans
C) Refinancings
D) Home Improvement Loans
F) Non-occupant Loans on < 5 Family Dwellings (A B C & D)
Number
Average Value
Number
Average Value
Number
Average Value
Number
Average Value
LOANS ORIGINATED
76
$870,346
153
$718,570
13
$254,904
0
$0
APPLICATIONS APPROVED, NOT ACCEPTED
2
$540,790
13
$564,174
0
$0
0
$0
APPLICATIONS DENIED
17
$1,050,979
17
$1,246,125
0
$0
2
$685,315
APPLICATIONS WITHDRAWN
6
$569,075
13
$635,036
0
$0
0
$0
FILES CLOSED FOR INCOMPLETENESS
0
$0
0
$0
0
$0
0
$0
Aggregated Statistics For Year 2003 (Based on 2 partial tracts)
B) Conventional Home Purchase Loans
C) Refinancings
D) Home Improvement Loans
F) Non-occupant Loans on < 5 Family Dwellings (A B C & D)
Number
Average Value
Number
Average Value
Number
Average Value
Number
Average Value
LOANS ORIGINATED
80
$812,540
431
$582,596
7
$109,224
13
$496,180
APPLICATIONS APPROVED, NOT ACCEPTED
6
$694,327
17
$649,170
0
$0
0
$0
APPLICATIONS DENIED
0
$0
43
$740,499
0
$0
2
$279,720
APPLICATIONS WITHDRAWN
15
$642,486
43
$536,065
0
$0
0
$0
FILES CLOSED FOR INCOMPLETENESS
0
$0
9
$479,668
0
$0
0
$0
Aggregated Statistics For Year 2002 (Based on 2 partial tracts)
B) Conventional Home Purchase Loans
C) Refinancings
D) Home Improvement Loans
F) Non-occupant Loans on < 5 Family Dwellings (A B C & D)
Number
Average Value
Number
Average Value
Number
Average Value
Number
Average Value
LOANS ORIGINATED
78
$712,497
351
$642,485
13
$155,639
6
$302,408
APPLICATIONS APPROVED, NOT ACCEPTED
4
$810,722
22
$421,275
0
$0
2
$279,720
APPLICATIONS DENIED
2
$299,300
11
$632,845
2
$42,890
0
$0
APPLICATIONS WITHDRAWN
6
$311,732
22
$502,987
0
$0
6
$243,667
FILES CLOSED FOR INCOMPLETENESS
0
$0
17
$707,636
0
$0
0
$0
Aggregated Statistics For Year 2001 (Based on 2 partial tracts)
B) Conventional Home Purchase Loans
C) Refinancings
D) Home Improvement Loans
F) Non-occupant Loans on < 5 Family Dwellings (A B C & D)
Number
Average Value
Number
Average Value
Number
Average Value
Number
Average Value
LOANS ORIGINATED
91
$758,297
231
$559,844
17
$163,335
13
$447,265
APPLICATIONS APPROVED, NOT ACCEPTED
4
$520,280
19
$607,238
0
$0
0
$0
APPLICATIONS DENIED
2
$1,305,360
28
$884,914
4
$74,592
0
$0
APPLICATIONS WITHDRAWN
0
$0
19
$515,176
2
$233,100
0
$0
FILES CLOSED FOR INCOMPLETENESS
2
$932,400
7
$422,510
0
$0
0
$0
Aggregated Statistics For Year 2000 (Based on 2 partial tracts)
B) Conventional Home Purchase Loans
C) Refinancings
D) Home Improvement Loans
F) Non-occupant Loans on < 5 Family Dwellings (A B C & D)
Number
Average Value
Number
Average Value
Number
Average Value
Number
Average Value
LOANS ORIGINATED
65
$590,080
56
$547,119
19
$140,449
6
$167,832
APPLICATIONS APPROVED, NOT ACCEPTED
13
$758,830
7
$380,951
2
$5,595
0
$0
APPLICATIONS DENIED
2
$372,960
7
$447,551
2
$1,865
2
$372,960
APPLICATIONS WITHDRAWN
6
$560,372
2
$354,310
0
$0
0
$0
FILES CLOSED FOR INCOMPLETENESS
0
$0
0
$0
0
$0
0
$0
Aggregated Statistics For Year 1999 (Based on 1 partial tract)
B) Conventional Home Purchase Loans
C) Refinancings
D) Home Improvement Loans
F) Non-occupant Loans on < 5 Family Dwellings (A B C & D)


 Nearest zip codes: 60091, 60201, 60203, 60093, 60076, 60202.