Estimated zip code population in 2022: 8,745 Zip code population in 2010: 8,329 Zip code population in 2000: 7,064
Houses and condos: 3,439 Renter-occupied apartments: 153
% of renters here:
5%
State:
28%
March 2022 cost of living index in zip code 55079: 97.2 (near average, U.S. average is 100)
Land area: 61.4 sq. mi. Water area: 3.8 sq. mi.
Population density: 143 people per square mile
(very low).
OSM Map
General Map
Google Map
MSN Map
OSM Map
General Map
Google Map
MSN Map
OSM Map
General Map
Google Map
MSN Map
OSM Map
General Map
Google Map
MSN Map
Please wait while loading the map...
Real estate property taxes paid for housing units in 2022:
This zip code:
0.9% ($3,120)
Minnesota:
1.0% ($3,087)
Median real estate property taxes paid for housing units with mortgages in 2022: $3,223 (0.9%) Median real estate property taxes paid for housing units with no mortgage in 2022: $2,795 (0.9%)
Estimated median house/condo value in 2022: $343,669
55079:
$343,669
Minnesota:
$314,600
Median resident age:
This zip code:
42.4 years
Minnesota median age:
39.0 years
Average household size:
This zip code:
2.6 people
Minnesota:
2.4 people
Averages for the 2020 tax year for zip code 55079, filed in 2021:
Average Adjusted Gross Income (AGI) in 2020: $75,689 (Individual Income Tax Returns)
Here:
$75,689
State:
$82,178
Salary/wage: $68,084 (reported on 85.6% of returns)
Here:
$68,084
State:
$67,438
(% of AGI for various income ranges: 1230.6% for AGIs below $25k, 3654.6% for AGIs $25k-50k, 6613.1% for AGIs $50k-75k, 9645.2% for AGIs $75k-100k, 19795.7% for AGIs $100k-200k, 70618.3% for AGIs over 200k)
Taxable interest for individuals: $858 (reported on 32.1% of returns)
This zip code:
$858
Minnesota:
$1,814
(% of AGI for various income ranges: 14.3% for AGIs below $25k, 17.4% for AGIs $25k-50k, 30.4% for AGIs $50k-75k, 56.0% for AGIs $75k-100k, 61.7% for AGIs $100k-200k, 481.7% for AGIs over 200k)
Ordinary dividends: $2,867 (reported on 18.1% of returns)
Here:
$2,867
State:
$6,928
(% of AGI for various income ranges: 22.2% for AGIs below $25k, 24.3% for AGIs $25k-50k, 35.7% for AGIs $50k-75k, 74.0% for AGIs $75k-100k, 149.8% for AGIs $100k-200k, 1151.7% for AGIs over 200k)
Net capital gain/loss in AGI: +$9,514 (reported on 16.8% of returns)
Here:
+$9,514
State:
+$20,591
(% of AGI for various income ranges: 7.2% for AGIs below $25k, 28.1% for AGIs $25k-50k, 84.6% for AGIs $50k-75k, 193.0% for AGIs $75k-100k, 295.9% for AGIs $100k-200k, 6873.3% for AGIs over 200k)
Profit/loss from business: +$12,149 (reported on 12.4% of returns)
Here:
+$12,149
State:
+$14,342
(% of AGI for various income ranges: 97.9% for AGIs below $25k, 163.6% for AGIs $25k-50k, 163.1% for AGIs $50k-75k, 105.8% for AGIs $75k-100k, 443.6% for AGIs $100k-200k, 1951.7% for AGIs over 200k)
Taxable individual retirement arrangement distribution: $15,730 (reported on 9.4% of returns)
55079:
$15,730
Minnesota:
$20,675
(% of AGI for various income ranges: 88.7% for AGIs below $25k, 164.5% for AGIs $25k-50k, 204.6% for AGIs $50k-75k, 315.8% for AGIs $75k-100k, 444.1% for AGIs $100k-200k)
Total itemized deductions: $24,136 (reported on 10.9% of returns)
Here:
$24,136
State:
$33,311
(% of AGI for various income ranges: 194.2% for AGIs $25k-50k, 332.8% for AGIs $50k-75k, 542.2% for AGIs $75k-100k, 795.0% for AGIs $100k-200k, 3423.3% for AGIs over 200k)
Charity contributions: $4,954 (reported on 7.6% of returns)
Here:
$4,954
State:
$11,879
(% of AGI for various income ranges: 15.5% for AGIs $25k-50k, 23.7% for AGIs $50k-75k, 48.0% for AGIs $75k-100k, 146.2% for AGIs $100k-200k, 751.7% for AGIs over 200k)
Taxes paid: $7,931 (reported on 10.7% of returns)
55079:
$7,931
State:
$8,252
(% of AGI for various income ranges: 38.8% for AGIs $25k-50k, 111.1% for AGIs $50k-75k, 193.5% for AGIs $75k-100k, 271.7% for AGIs $100k-200k, 1081.7% for AGIs over 200k)
Earned income credit: $1,663 (reported on 7.6% of returns)
Here:
$1,663
State:
$2,055
(% of AGI for various income ranges: 45.3% for AGIs below $25k, 37.0% for AGIs $25k-50k)
Percentage of individuals using paid preparers for their 2020 taxes: 94.5%
Here:
95%
State:
94%
(% for various income ranges: 93.3% for AGIs below $25k, 94.9% for AGIs $25k-50k, 94.7% for AGIs $50k-75k, 93.1% for AGIs $75k-100k, 96.1% for AGIs $100k-200k, 95.0% for AGIs over 200k)
Averages for the 2012 tax year for zip code 55079, filed in 2013:
Average Adjusted Gross Income (AGI) in 2012: $58,152 (Individual Income Tax Returns)
Here:
$58,152
State:
$67,192
Salary/wage: $53,287 (reported on 87.9% of returns)
Here:
$53,287
State:
$55,182
(% of AGI for various income ranges: 75.6% for AGIs below $25k, 80.0% for AGIs $25k-50k, 81.4% for AGIs $50k-75k, 82.3% for AGIs $75k-100k, 86.3% for AGIs $100k-200k, 57.3% for AGIs over 200k)
Taxable interest for individuals: $693 (reported on 34.7% of returns)
This zip code:
$693
Minnesota:
$1,664
(% of AGI for various income ranges: 0.7% for AGIs below $25k, 0.5% for AGIs $25k-50k, 0.5% for AGIs $50k-75k, 0.4% for AGIs $75k-100k, 0.2% for AGIs $100k-200k, 0.7% for AGIs over 200k)
Ordinary dividends: $2,340 (reported on 17.2% of returns)
Here:
$2,340
State:
$5,665
(% of AGI for various income ranges: 0.9% for AGIs below $25k, 0.8% for AGIs $25k-50k, 0.3% for AGIs $50k-75k, 0.3% for AGIs $75k-100k, 0.6% for AGIs $100k-200k, 2.4% for AGIs over 200k)
Net capital gain/loss in AGI: +$7,990 (reported on 12.3% of returns)
Here:
+$7,990
State:
+$16,131
(% of AGI for various income ranges: 0.3% for AGIs $75k-100k, 0.9% for AGIs $100k-200k, 15.8% for AGIs over 200k)
Profit/loss from business: +$6,444 (reported on 15.3% of returns)
Here:
+$6,444
State:
+$12,430
(% of AGI for various income ranges: 7.1% for AGIs below $25k, 2.4% for AGIs $25k-50k, 1.2% for AGIs $50k-75k, 1.4% for AGIs $75k-100k, 1.3% for AGIs $100k-200k)
Taxable individual retirement arrangement distribution: $13,727 (reported on 9.1% of returns)
55079:
$13,727
Minnesota:
$15,212
(% of AGI for various income ranges: 3.7% for AGIs below $25k, 2.0% for AGIs $25k-50k, 2.0% for AGIs $50k-75k, 2.4% for AGIs $75k-100k, 2.4% for AGIs $100k-200k)
Total itemized deductions: $19,674 (22% of AGI, reported on 47.8% of returns)
Here:
$19,674
State:
$24,665
Here:
22.2% of AGI
State:
19.6% of AGI
(% of AGI for various income ranges: 11.7% for AGIs below $25k, 14.5% for AGIs $25k-50k, 16.2% for AGIs $50k-75k, 18.4% for AGIs $75k-100k, 17.5% for AGIs $100k-200k, 11.6% for AGIs over 200k)
Charity contributions: $2,063 (reported on 40.1% of returns)
Here:
$2,063
State:
$3,948
(% of AGI for various income ranges: 0.7% for AGIs below $25k, 1.2% for AGIs $25k-50k, 1.3% for AGIs $50k-75k, 1.7% for AGIs $75k-100k, 1.6% for AGIs $100k-200k, 1.1% for AGIs over 200k)
Taxes paid: $7,176 (reported on 47.8% of returns)
55079:
$7,176
State:
$10,589
(% of AGI for various income ranges: 2.4% for AGIs below $25k, 3.8% for AGIs $25k-50k, 5.1% for AGIs $50k-75k, 6.3% for AGIs $75k-100k, 7.3% for AGIs $100k-200k, 7.2% for AGIs over 200k)
Earned income credit: $1,848 (reported on 11.8% of returns)
Here:
$1,848
State:
$2,037
(% of AGI for various income ranges: 4.3% for AGIs below $25k, 0.8% for AGIs $25k-50k)
Percentage of individuals using paid preparers for their 2012 taxes: 57.6%
Here:
58%
State:
55%
(% for various income ranges: 50.0% for AGIs below $25k, 57.5% for AGIs $25k-50k, 63.8% for AGIs $50k-75k, 64.2% for AGIs $75k-100k, 60.3% for AGIs $100k-200k, 66.7% for AGIs over 200k)
Averages for the 2004 tax year for zip code 55079, filed in 2005:
Average Adjusted Gross Income (AGI) in 2004: $52,716 (Individual Income Tax Returns)
Here:
$52,716
State:
$53,560
Salary/wage: $47,414 (reported on 92.0% of returns)
Here:
$47,414
State:
$46,177
(% of AGI for various income ranges: 140.4% for AGIs below $10k, 81.1% for AGIs $10k-25k, 85.5% for AGIs $25k-50k, 89.6% for AGIs $50k-75k, 90.8% for AGIs $75k-100k, 68.5% for AGIs over 100k)
Taxable interest for individuals: $723 (reported on 45.4% of returns)
This zip code:
$723
Minnesota:
$1,796
(% of AGI for various income ranges: 3.8% for AGIs below $10k, 1.4% for AGIs $10k-25k, 0.7% for AGIs $25k-50k, 0.6% for AGIs $50k-75k, 0.4% for AGIs $75k-100k, 0.5% for AGIs over 100k)
Taxable dividends: $1,177 (reported on 21.0% of returns)
Here:
$1,177
State:
$3,096
(% of AGI for various income ranges: 1.4% for AGIs below $10k, 0.5% for AGIs $10k-25k, 0.3% for AGIs $25k-50k, 0.2% for AGIs $50k-75k, 0.2% for AGIs $75k-100k, 1.0% for AGIs over 100k)
Net capital gain/loss: +$8,173 (reported on 14.1% of returns)
Here:
+$8,173
State:
+$10,864
(% of AGI for various income ranges: 1.4% for AGIs below $10k, 0.1% for AGIs $10k-25k, 0.2% for AGIs $25k-50k, 0.3% for AGIs $50k-75k, 0.8% for AGIs $75k-100k, 6.2% for AGIs over 100k)
Profit/loss from business: +$6,329 (reported on 17.5% of returns)
Here:
+$6,329
State:
+$10,442
(% of AGI for various income ranges: -0.3% for AGIs below $10k, 4.6% for AGIs $10k-25k, 3.7% for AGIs $25k-50k, 1.7% for AGIs $50k-75k, 0.9% for AGIs $75k-100k, 2.0% for AGIs over 100k)
IRA payment deduction: $3,000 (reported on 2.3% of returns)
55079:
$3,000
Minnesota:
$2,955
(% of AGI for various income ranges: 0.3% for AGIs $25k-50k, 0.1% for AGIs $50k-75k, 0.1% for AGIs $75k-100k, 0.1% for AGIs over 100k)
Self-employed pension: $5,909 (reported on 0.3% of returns)
Here:
$5,909
Minnesota:
$12,099
Total itemized deductions: $17,740 (23% of AGI, reported on 52.9% of returns)
Here:
$17,740
State:
$20,035
Here:
22.5% of AGI
State:
21.3% of AGI
(% of AGI for various income ranges: 18.5% for AGIs below $10k, 12.5% for AGIs $10k-25k, 18.7% for AGIs $25k-50k, 20.5% for AGIs $50k-75k, 19.2% for AGIs $75k-100k, 15.0% for AGIs over 100k)
Charity contributions deductions: $1,988 (2% of AGI, reported on 46.9% of returns)
Here:
$1,988
State:
$3,333
Here:
2.4% of AGI
State:
3.4% of AGI
(% of AGI for various income ranges: 1.1% for AGIs below $10k, 1.2% for AGIs $10k-25k, 1.5% for AGIs $25k-50k, 1.9% for AGIs $50k-75k, 1.9% for AGIs $75k-100k, 1.8% for AGIs over 100k)
Total tax: $6,602 (reported on 83.4% of returns)
55079:
$6,602
State:
$8,485
(% of AGI for various income ranges: 4.3% for AGIs below $10k, 5.1% for AGIs $10k-25k, 6.9% for AGIs $25k-50k, 8.1% for AGIs $50k-75k, 9.1% for AGIs $75k-100k, 16.5% for AGIs over 100k)
Earned income credit: $1,457 (reported on 8.5% of returns)
Here:
$1,457
State:
$1,523
Percentage of individuals using paid preparers for their 2004 taxes: 58.1%
Here:
58%
State:
59%
(% for various income ranges: 44.5% for AGIs below $10k, 48.9% for AGIs $10k-25k, 64.1% for AGIs $25k-50k, 63.3% for AGIs $50k-75k, 61.1% for AGIs $75k-100k, 66.3% for AGIs over 100k)
Likely homosexual households (counted as self-reported same-sex unmarried-partner households)
Lesbian couples: 0.1% of all households
Gay men: 0.0% of all households
Household received Food Stamps/SNAP in the past 12 months: 145 Household did not receive Food Stamps/SNAP in the past 12 months: 3,156
Women who had a birth in the past 12 months: 113 (81 now married, 32 unmarried) Women who did not have a birth in the past 12 months: 1,703 (910 now married, 794 unmarried)
Housing units in zip code 55079 with a mortgage: 2,026 (197 second mortgage, 156 both second mortgage and home equity loan) Houses without a mortgage: 37
Median monthly owner costs for units with a mortgage: $1,786 Median monthly owner costs for units without a mortgage: $648
Residents with income below the poverty level in 2022:
This zip code:
4.4%
Whole state:
9.6%
Residents with income below 50% of the poverty level in 2022:
This zip code:
2.3%
Whole state:
5.2%
Median number of rooms in houses and condos:
Here:
6.7
State:
7.1
Median number of rooms in apartments:
Here:
5.9
State:
3.8
Notable locations in this zip code not listed on our city pages
Notable locations in zip code 55079: Falcon Ridge Golf Course (A), Stacy City Hall (B), Stacy - Lent Fire Department (C), Linwood Volunteer Fire Department (D). Display/hide their locations on the map
Churches in zip code 55079 include: Faith Church (A), Country Roads Church (B), Saint John's Lutheran Church (C), Oxford Church (D), Sunnyside Free Lutheran Church (E). Display/hide their locations on the map
Lakes and reservoirs: Upper Birch Lake (A), Typo Lake (B), Twin Lakes (C), Tamarack Lake (D), Ryan Lake (E), Peterson Slough (F), Pet Lake (G), Mud Lake (H). Display/hide their locations on the map
1,393 married couples with children.
302 single-parent households (212 men, 90 women).
95.8% of residents of 55079 zip code speak English at home.
1.4% of residents speak Spanish at home (81% very well, 8% well, 12% not at all).
0.4% of residents speak other Indo-European language at home (88% very well, 9% well, 3% not well).
1.7% of residents speak Asian or Pacific Island language at home (54% very well, 43% well, 1% not well, 2% not at all).
0.1% of residents speak other language at home (100% very well).
Foreign born population: 173 (2.0%) (73.4% of them are naturalized citizens)
This zip code:
2.0%
Whole state:
8.7%
27%Honduras
11%Costa Rica
9%Burma (Myanmar)
9%Malaysia
5%France
5%Czechoslovakia (includes Czech Republic and Slovakia)
5%Japan
26%German
12%American
7%Swedish
7%Norwegian
6%English
6%Irish
2%Polish
Year of entry for the foreign-born population
992010 or later
492000 to 2009
371990 to 1999
53Before 1990
Facilities with environmental interests located in this zip code:
FALCON RIDGE (33942 FALCON AVE in STACY, MN)
STATE MASTER (Minnesota Pollution Control Agency permits and compilance tracking) - RCRAINFO-MNR000024240, CESQG, RCRIS-MNR000024240, Conditionally Exempt Small Quantity Generators, less than 100 kg/month of hazardous waste (Resource Conservation and Recovery Act (tracking hazardous waste)) - notification Business SIC classification: AMUSEMENT AND RECREATION SERVICES Organizations: JOHNSON PAUL (CONTACT/OWNER)
AT AND T CORP (5725 287TH ST in STACY, MN)
Conditionally Exempt Small Quantity Generators, less than 100 kg/month of hazardous waste (Resource Conservation and Recovery Act (tracking hazardous waste)) - notification Organizations: A T & T (CONTACT/OWNER)
BARZEN INTL INC (128 CO RD 19 FOX HILL in STACY, MN)
Small Quantity Generators, between 100 kg and 1000 kg of hazardous waste/month (Resource Conservation and Recovery Act (tracking hazardous waste)) - notification
MILLERS AUTO RPR (RT 1 BOX 136 in STACY, MN)
(Resource Conservation and Recovery Act (tracking hazardous waste))
OLSON DALE (8747 241ST AVE NE in STACY, MN)
Small Quantity Generators, between 100 kg and 1000 kg of hazardous waste/month (Resource Conservation and Recovery Act (tracking hazardous waste)) - notification
ALPHA COMPANIES INC (24504 TYPO CREEK DR NE in STACY, MN)
Conditionally Exempt Small Quantity Generators, less than 100 kg/month of hazardous waste (Resource Conservation and Recovery Act (tracking hazardous waste)) - notification Organizations: EGERSDORF STEVE (CONTACT/OWNER)
PERRON (9008 LENT TRL in STACY, MN)
Small Quantity Generators, between 100 kg and 1000 kg of hazardous waste/month (Resource Conservation and Recovery Act (tracking hazardous waste)) Organizations: DONALD PERRON (CONTACT/OWNER)
Housing units lacking complete plumbing facilities: 0.5% Housing units lacking complete kitchen facilities: 0.6%
75.2%Utility gas
11.5%Bottled, tank, or LP gas
9.6%Electricity
2.3%Wood
0.8%Other fuel
Population in 1990: 5,936. Population change in the 1990s: +1,128 (+19.0%).
Place of birth for U.S.-born residents:
This state: 7,034
Northeast: 96
Midwest: 880
South: 195
West: 275
64% of the 55079 zip code residents lived in the same house 5 years ago. Out of people who lived in different houses, 25% lived in this county. Out of people who lived in different counties, 50% lived in Minnesota.
95% of the 55079 zip code residents lived in the same house 1 year ago. Out of people who lived in different houses, 47% moved from this county. Out of people who lived in different houses, 48% moved from different county within same state. Out of people who lived in different houses, 8% moved from different state.
Private vs. public school enrollment:
Students in private schools in grades 1 to 8 (elementary and middle school): 41
Here:
4.6%
Minnesota:
12.9%
Students in private schools in grades 9 to 12 (high school): 31
Here:
7.9%
Minnesota:
8.6%
Students in private undergraduate colleges: 95
Here:
39.9%
Minnesota:
26.2%
Occupation by median earnings in the past 12 months ($)
106,813Life, physical, and social science occupations
96,394Computer and mathematical occupations
86,129Management occupations
81,191Business and financial operations occupations
81,107Education, training, and library occupations
79,978Architecture and engineering occupations
Companies with federal contracts located in this zip code:
Y2K FLUID POWER INC (9760 238TH, AVE NE in STACY, MN; small business) : $202,483 in 11 contractsfrom 2002 to 2005
Contracts for Hydraulic and Pneumatic Presses, Power Driven, Aircraft Hydraulic, Vacuum, and De-icing System Components, Gas Turbines and Jet Engines, Non-Aircraft; and Components, Aircraft Ground Servicing Equipment, and moreby Army Signed by year:2000: $0; 2001: $0; 2002: $11,391; 2003: $171,274; 2004: $5,432; 2005: $14,386; 2006: $0.
Biggest contracts:
$171,330 with Army for Hydraulic and Pneumatic Presses, Power Driven. Signed on 2003-02-23. Completion date: 2003-04-18.
$8,518 with Army for Aircraft Hydraulic, Vacuum, and De-icing System Components. Signed on 2002-09-28. Completion date: 2002-10-31.
$8,504 with Army for Gas Turbines and Jet Engines, Non-Aircraft; and Components. Signed on 2005-09-25. Completion date: 2005-10-17.
$2,941 with Army for Hydraulic and Pneumatic Presses, Power Driven. Signed on 2005-07-27. Completion date: 2005-08-12.
ROYAL EROSION CONTROL SYSTEMS, (30622 FOREST BLVD in STACY, MN; small business) : $194,624 in 6 contractsfrom 2000 to 2005
Contracts for Miscellaneous Construction Materials, Tile, Brick, and Block, Bridges, Fixed and Floating, Other Wildlife Management Services by U.S. Army Corps of Engineers - civil program financing only, Army, U.S. Fish and Wildlife Service Signed by year:2000: $25,080; 2001: $48,795; 2002: $113,506; 2003: $0; 2004: $0; 2005: $7,243; 2006: $0.
Biggest contracts:
$84,800 with U.S. Army Corps of Engineers - civil program financing only for Miscellaneous Construction Materials. Taking place in SD. Signed on 2002-08-15. Completion date: 2002-09-30.
$48,795 with Army for Miscellaneous Construction Materials. Signed on 2001-08-09. Completion date: 2001-08-30.
$25,080 with Army for Tile, Brick, and Block. Taking place in TX. Signed on 2000-03-10. Completion date: 1999-11-17.
$18,760 with Army for Bridges, Fixed and Floating. Taking place in KY. Signed on 2002-09-06. Completion date: 2002-10-31.
Top industries in this zip code by the number of employees in 2005:
Professional, Scientific, and Technical Services: Other Services Related to Advertising (250-499 employees: 1 establishment)
Health Care and Social Assistance: Home Health Care Services (50-99: 1)
Accommodation and Food Services: Full-Service Restaurants (20-49: 1, 10-19: 1)
Construction: Plumbing, Heating, and Air-Conditioning Contractors (10-19: 1, 1-4: 5)
Construction: Painting and Wall Covering Contractors (5-9: 2, 1-4: 4)
Other Services (except Public Administration): Religious Organizations (10-19: 1, 1-4: 1)
People in group quarters in 2010:
12 people in group homes intended for adults
People in group quarters in 2000:
9 people in homes for the mentally retarded
Fatal accident statistics in 2014:
Fatal accident count: 1
Vehicles involved in fatal accidents: 2
Fatal accidents caused by drunken drivers: 1
Fatalities: 1
Persons involved in fatal accidents: 2
Pedestrians involved in fatal accidents: 0
Fatal accident statistics in 2012:
Fatal accident count: 1
Vehicles involved in fatal accidents: 2
Fatal accidents caused by drunken drivers: 2
Fatalities: 1
Persons involved in fatal accidents: 3
Pedestrians involved in fatal accidents: 0
Home Mortgage Disclosure Act Aggregated Statistics For Year 2009 (Based on 6 partial tracts)
A) FHA, FSA/RHS & VA Home Purchase Loans
B) Conventional Home Purchase Loans
C) Refinancings
D) Home Improvement Loans
F) Non-occupant Loans on < 5 Family Dwellings (A B C & D)
G) Loans On Manufactured Home Dwelling (A B C & D)
Number
Average Value
Number
Average Value
Number
Average Value
Number
Average Value
Number
Average Value
Number
Average Value
LOANS ORIGINATED
110
$175,903
69
$170,390
617
$185,271
34
$83,368
28
$172,860
2
$133,330
APPLICATIONS APPROVED, NOT ACCEPTED
6
$129,315
9
$212,099
67
$198,901
7
$34,154
0
$0
1
$30,330
APPLICATIONS DENIED
10
$162,791
12
$220,809
222
$216,900
15
$28,821
7
$103,937
2
$4,460
APPLICATIONS WITHDRAWN
8
$157,786
6
$128,353
123
$202,905
11
$77,747
5
$141,650
0
$0
FILES CLOSED FOR INCOMPLETENESS
4
$190,528
1
$187,710
56
$203,465
2
$108,460
0
$0
1
$97,340
Aggregated Statistics For Year 2008 (Based on 6 partial tracts)
A) FHA, FSA/RHS & VA Home Purchase Loans
B) Conventional Home Purchase Loans
C) Refinancings
D) Home Improvement Loans
F) Non-occupant Loans on < 5 Family Dwellings (A B C & D)
G) Loans On Manufactured Home Dwelling (A B C & D)
Number
Average Value
Number
Average Value
Number
Average Value
Number
Average Value
Number
Average Value
Number
Average Value
LOANS ORIGINATED
66
$194,838
112
$191,403
348
$187,531
63
$51,735
37
$146,303
6
$44,052
APPLICATIONS APPROVED, NOT ACCEPTED
2
$217,815
21
$170,294
63
$211,817
9
$77,214
10
$170,912
2
$75,655
APPLICATIONS DENIED
16
$216,759
37
$226,208
198
$200,347
20
$47,275
10
$221,965
5
$36,750
APPLICATIONS WITHDRAWN
5
$171,110
13
$222,113
73
$210,353
9
$72,784
8
$246,165
2
$77,480
FILES CLOSED FOR INCOMPLETENESS
3
$250,633
2
$387,485
38
$204,760
1
$21,620
2
$311,310
0
$0
Aggregated Statistics For Year 2007 (Based on 6 partial tracts)
A) FHA, FSA/RHS & VA Home Purchase Loans
B) Conventional Home Purchase Loans
C) Refinancings
D) Home Improvement Loans
F) Non-occupant Loans on < 5 Family Dwellings (A B C & D)
G) Loans On Manufactured Home Dwelling (A B C & D)
Number
Average Value
Number
Average Value
Number
Average Value
Number
Average Value
Number
Average Value
Number
Average Value
LOANS ORIGINATED
13
$178,007
193
$188,230
480
$169,706
83
$61,411
37
$198,849
6
$34,688
APPLICATIONS APPROVED, NOT ACCEPTED
2
$175,725
21
$180,943
102
$197,722
19
$41,335
3
$294,203
2
$47,140
APPLICATIONS DENIED
0
$0
43
$195,013
320
$195,957
34
$54,944
17
$196,983
7
$45,154
APPLICATIONS WITHDRAWN
0
$0
24
$153,110
117
$189,608
14
$142,588
7
$116,904
1
$13,380
FILES CLOSED FOR INCOMPLETENESS
0
$0
3
$179,887
35
$220,561
4
$54,972
0
$0
0
$0
Aggregated Statistics For Year 2006 (Based on 6 partial tracts)
A) FHA, FSA/RHS & VA Home Purchase Loans
B) Conventional Home Purchase Loans
C) Refinancings
D) Home Improvement Loans
F) Non-occupant Loans on < 5 Family Dwellings (A B C & D)
G) Loans On Manufactured Home Dwelling (A B C & D)
Number
Average Value
Number
Average Value
Number
Average Value
Number
Average Value
Number
Average Value
Number
Average Value
LOANS ORIGINATED
15
$214,672
356
$182,579
560
$171,166
123
$58,908
36
$151,761
4
$128,143
APPLICATIONS APPROVED, NOT ACCEPTED
0
$0
44
$143,888
92
$176,092
15
$86,300
10
$145,838
3
$112,600
APPLICATIONS DENIED
3
$244,943
94
$151,063
288
$195,838
36
$86,585
17
$144,990
21
$51,978
APPLICATIONS WITHDRAWN
1
$173,940
48
$149,050
200
$199,274
22
$131,318
15
$149,531
1
$86,270
FILES CLOSED FOR INCOMPLETENESS
0
$0
20
$193,046
65
$200,430
5
$45,214
2
$102,580
0
$0
Aggregated Statistics For Year 2005 (Based on 6 partial tracts)
A) FHA, FSA/RHS & VA Home Purchase Loans
B) Conventional Home Purchase Loans
C) Refinancings
D) Home Improvement Loans
E) Loans on Dwellings For 5+ Families
F) Non-occupant Loans on < 5 Family Dwellings (A B C & D)
G) Loans On Manufactured Home Dwelling (A B C & D)
Number
Average Value
Number
Average Value
Number
Average Value
Number
Average Value
Number
Average Value
Number
Average Value
Number
Average Value
LOANS ORIGINATED
18
$183,631
436
$175,717
715
$181,387
118
$62,593
0
$0
50
$163,252
7
$59,720
APPLICATIONS APPROVED, NOT ACCEPTED
0
$0
38
$159,457
124
$161,996
13
$90,675
0
$0
5
$97,974
8
$47,876
APPLICATIONS DENIED
1
$172,160
63
$146,768
313
$180,624
39
$71,391
1
$271,170
14
$121,727
15
$56,097
APPLICATIONS WITHDRAWN
0
$0
38
$170,622
319
$192,797
19
$98,181
0
$0
15
$182,028
0
$0
FILES CLOSED FOR INCOMPLETENESS
0
$0
24
$131,957
92
$200,472
5
$48,450
0
$0
2
$56,365
0
$0
Aggregated Statistics For Year 2004 (Based on 6 partial tracts)
A) FHA, FSA/RHS & VA Home Purchase Loans
B) Conventional Home Purchase Loans
C) Refinancings
D) Home Improvement Loans
F) Non-occupant Loans on < 5 Family Dwellings (A B C & D)
G) Loans On Manufactured Home Dwelling (A B C & D)
Number
Average Value
Number
Average Value
Number
Average Value
Number
Average Value
Number
Average Value
Number
Average Value
LOANS ORIGINATED
24
$192,965
351
$177,084
813
$166,457
115
$59,348
36
$170,037
13
$71,181
APPLICATIONS APPROVED, NOT ACCEPTED
0
$0
27
$141,794
139
$169,703
18
$73,664
3
$196,840
6
$51,872
APPLICATIONS DENIED
5
$167,838
66
$143,043
285
$175,798
55
$47,905
9
$127,510
27
$47,405
APPLICATIONS WITHDRAWN
2
$181,075
20
$177,622
253
$183,919
21
$78,526
4
$236,255
2
$89,200
FILES CLOSED FOR INCOMPLETENESS
0
$0
9
$191,933
67
$217,707
1
$71,360
0
$0
0
$0
Aggregated Statistics For Year 2003 (Based on 6 partial tracts)
A) FHA, FSA/RHS & VA Home Purchase Loans
B) Conventional Home Purchase Loans
C) Refinancings
D) Home Improvement Loans
F) Non-occupant Loans on < 5 Family Dwellings (A B C & D)
Number
Average Value
Number
Average Value
Number
Average Value
Number
Average Value
Number
Average Value
LOANS ORIGINATED
33
$174,314
391
$172,195
1,940
$150,000
127
$29,419
32
$154,545
APPLICATIONS APPROVED, NOT ACCEPTED
0
$0
32
$161,545
156
$159,610
6
$58,422
6
$189,333
APPLICATIONS DENIED
0
$0
53
$120,455
372
$148,842
29
$42,241
9
$115,562
APPLICATIONS WITHDRAWN
2
$175,050
43
$177,171
481
$156,749
12
$19,729
3
$139,107
FILES CLOSED FOR INCOMPLETENESS
2
$133,225
5
$152,998
59
$163,256
4
$35,432
2
$112,840
Aggregated Statistics For Year 2002 (Based on 2 partial tracts)
A) FHA, FSA/RHS & VA Home Purchase Loans
B) Conventional Home Purchase Loans
C) Refinancings
D) Home Improvement Loans
E) Loans on Dwellings For 5+ Families
F) Non-occupant Loans on < 5 Family Dwellings (A B C & D)
Number
Average Value
Number
Average Value
Number
Average Value
Number
Average Value
Number
Average Value
Number
Average Value
LOANS ORIGINATED
24
$175,241
207
$164,813
797
$147,050
62
$27,048
1
$713,600
11
$120,095
APPLICATIONS APPROVED, NOT ACCEPTED
2
$137,815
15
$167,934
79
$149,822
8
$26,091
0
$0
4
$195,795
APPLICATIONS DENIED
2
$146,290
26
$93,728
173
$129,412
24
$26,425
0
$0
3
$118,340
APPLICATIONS WITHDRAWN
2
$187,320
9
$146,387
193
$146,399
4
$55,305
0
$0
2
$151,640
FILES CLOSED FOR INCOMPLETENESS
0
$0
5
$221,216
30
$147,002
0
$0
0
$0
0
$0
Aggregated Statistics For Year 2001 (Based on 2 partial tracts)
A) FHA, FSA/RHS & VA Home Purchase Loans
B) Conventional Home Purchase Loans
C) Refinancings
D) Home Improvement Loans
F) Non-occupant Loans on < 5 Family Dwellings (A B C & D)
Number
Average Value
Number
Average Value
Number
Average Value
Number
Average Value
Number
Average Value
LOANS ORIGINATED
42
$151,343
183
$140,975
670
$130,102
86
$24,457
10
$80,726
APPLICATIONS APPROVED, NOT ACCEPTED
3
$120,123
18
$110,707
56
$125,214
7
$30,966
0
$0
APPLICATIONS DENIED
4
$143,390
30
$69,903
153
$109,862
24
$28,247
4
$82,065
APPLICATIONS WITHDRAWN
0
$0
16
$135,082
100
$118,368
11
$35,761
1
$170,370
FILES CLOSED FOR INCOMPLETENESS
0
$0
6
$121,163
21
$109,886
1
$8,920
3
$107,633
Aggregated Statistics For Year 2000 (Based on 2 partial tracts)
A) FHA, FSA/RHS & VA Home Purchase Loans
B) Conventional Home Purchase Loans
C) Refinancings
D) Home Improvement Loans
F) Non-occupant Loans on < 5 Family Dwellings (A B C & D)
Number
Average Value
Number
Average Value
Number
Average Value
Number
Average Value
Number
Average Value
LOANS ORIGINATED
54
$135,733
203
$132,860
178
$83,031
78
$18,080
4
$140,712
APPLICATIONS APPROVED, NOT ACCEPTED
0
$0
18
$57,583
26
$78,084
9
$29,733
1
$9,810
APPLICATIONS DENIED
5
$148,608
40
$74,549
79
$68,548
23
$16,133
1
$36,570
APPLICATIONS WITHDRAWN
0
$0
17
$126,979
65
$95,238
6
$20,665
2
$193,120
FILES CLOSED FOR INCOMPLETENESS
0
$0
3
$156,993
21
$113,751
2
$20,515
0
$0
Aggregated Statistics For Year 1999 (Based on 2 partial tracts)
A) FHA, FSA/RHS & VA Home Purchase Loans
B) Conventional Home Purchase Loans
C) Refinancings
D) Home Improvement Loans
F) Non-occupant Loans on < 5 Family Dwellings (A B C & D)
2002 - 2018 National Fire Incident Reporting System (NFIRS) incidents
Based on the data from the years 2002 - 2018 the average number of fire incidents per year is 37. The highest number of reported fires - 62 took place in 2002, and the least - 16 in 2014. The data has a decreasing trend.
When looking into fire subcategories, the most incidents belonged to: Outside Fires (41.6%), and Structure Fires (29.4%).
Fire incident types reported to NFIRS in Zip Code 55079

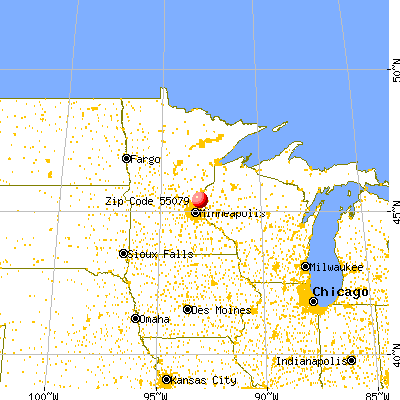


 Nearest zip codes: 55092, 55056, 55013, 55025, 55032, 55005.


 Based on the data from the years 2002 - 2018 the average number of fire incidents per year is 37. The highest number of reported fires - 62 took place in 2002, and the least - 16 in 2014. The data has a decreasing trend.
 When looking into fire subcategories, the most incidents belonged to: Outside Fires (41.6%), and Structure Fires (29.4%).