Estimated zip code population in 2022: 6,880 Zip code population in 2010: 6,541 Zip code population in 2000: 5,000
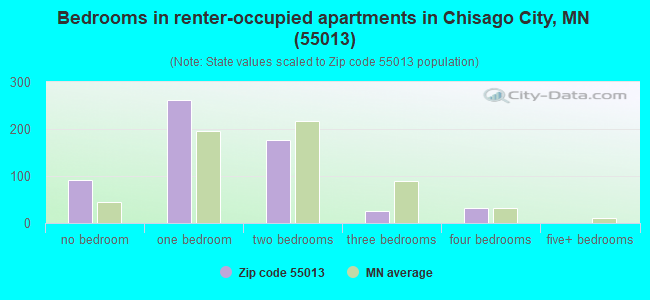
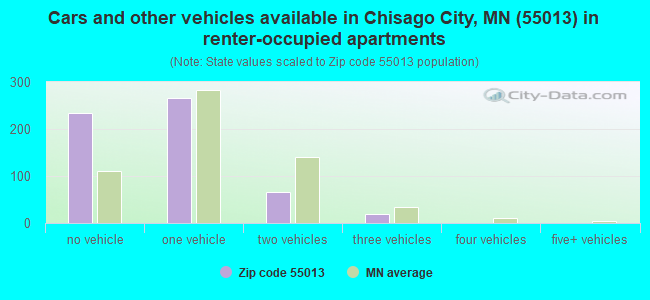
Houses and condos: 3,019 Renter-occupied apartments: 578
% of renters here:
21%
State:
28%
March 2022 cost of living index in zip code 55013: 113.1 (more than average, U.S. average is 100)
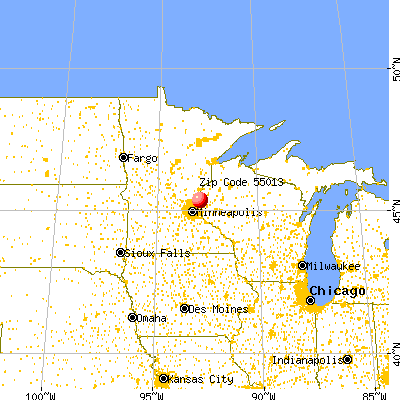
Land area: 29.3 sq. mi. Water area: 5.5 sq. mi.
Population density: 234 people per square mile
(very low).
OSM Map
General Map
Google Map
MSN Map
OSM Map
General Map
Google Map
MSN Map
OSM Map
General Map
Google Map
MSN Map
OSM Map
General Map
Google Map
MSN Map
Please wait while loading the map...
Real estate property taxes paid for housing units in 2022:
This zip code:
1.1% ($4,159)
Minnesota:
1.0% ($3,087)
Median real estate property taxes paid for housing units with mortgages in 2022: $4,227 (1.1%) Median real estate property taxes paid for housing units with no mortgage in 2022: $3,995 (1.2%)
Business Search- 14 Million verified businesses
Males: 3,375
(49.1%)
Females: 3,504
(50.9%)
For population 25 years and over in 55013:
High school or higher: 96.7%
Bachelor's degree or higher: 29.5%
Graduate or professional degree: 8.2%
Unemployed: 4.2%
Mean travel time to work (commute): 30.9 minutes
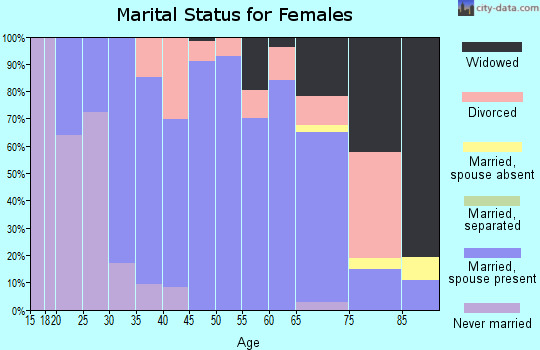
For population 15 years and over in 55013:
Never married: 22.5%
Now married: 64.7%
Separated: 0.4%
Widowed: 8.2%
Divorced: 4.2%
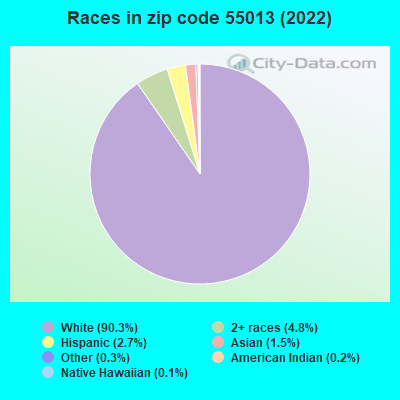
Zip code 55013 compared to state average:
Black race population percentage significantly below state average.
Hispanic race population percentage below state average.
Median age above state average.
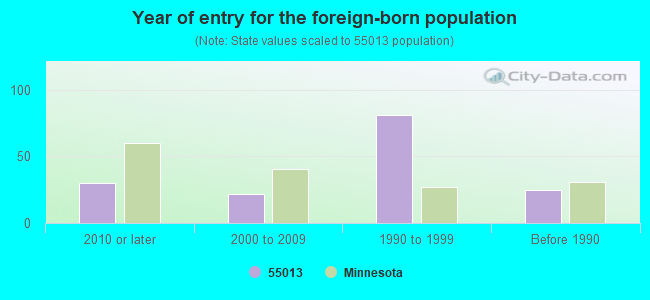
Foreign-born population percentage significantly below state average.
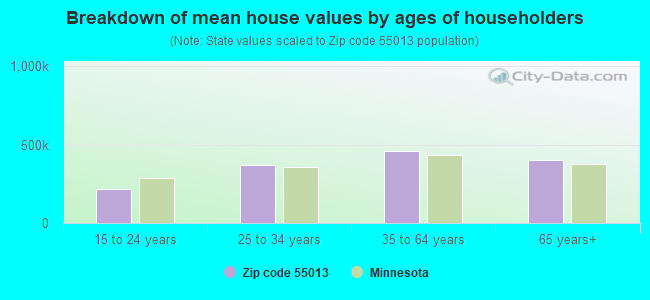
Estimated median house/condo value in 2022: $370,214
55013:
$370,214
Minnesota:
$314,600
According to our research of Minnesota and other state lists, there was 1 registered sex offender living in 55013 zip code as of May 23, 2024. The ratio of all residents to sex offenders in zip code 55013 is 6,745 to 1. The ratio of registered sex offenders to all residents in this zip code is near the state average.
Median resident age:
This zip code:
43.9 years
Minnesota median age:
39.0 years
Average household size:
This zip code:
2.4 people
Minnesota:
2.4 people
Averages for the 2020 tax year for zip code 55013, filed in 2021:
Average Adjusted Gross Income (AGI) in 2020: $84,450 (Individual Income Tax Returns)
Here:
$84,450
State:
$82,178
Salary/wage: $72,870 (reported on 79.7% of returns)
Here:
$72,870
State:
$67,438
(% of AGI for various income ranges: 1234.6% for AGIs below $25k, 3321.6% for AGIs $25k-50k, 6243.4% for AGIs $50k-75k, 9322.1% for AGIs $75k-100k, 18967.8% for AGIs $100k-200k, 68861.4% for AGIs over 200k)
Taxable interest for individuals: $1,095 (reported on 37.5% of returns)
This zip code:
$1,095
Minnesota:
$1,814
(% of AGI for various income ranges: 27.9% for AGIs below $25k, 34.5% for AGIs $25k-50k, 72.9% for AGIs $50k-75k, 43.9% for AGIs $75k-100k, 93.5% for AGIs $100k-200k, 451.4% for AGIs over 200k)
Ordinary dividends: $3,717 (reported on 25.6% of returns)
Here:
$3,717
State:
$6,928
(% of AGI for various income ranges: 43.8% for AGIs below $25k, 47.8% for AGIs $25k-50k, 87.6% for AGIs $50k-75k, 146.4% for AGIs $75k-100k, 195.4% for AGIs $100k-200k, 1841.4% for AGIs over 200k)
Net capital gain/loss in AGI: +$10,013 (reported on 21.9% of returns)
Here:
+$10,013
State:
+$20,591
(% of AGI for various income ranges: 20.2% for AGIs below $25k, 35.1% for AGIs $25k-50k, 97.4% for AGIs $50k-75k, 112.1% for AGIs $75k-100k, 390.2% for AGIs $100k-200k, 7341.4% for AGIs over 200k)
Profit/loss from business: +$12,716 (reported on 12.5% of returns)
Here:
+$12,716
State:
+$14,342
(% of AGI for various income ranges: 83.9% for AGIs below $25k, 121.6% for AGIs $25k-50k, 186.8% for AGIs $50k-75k, 293.2% for AGIs $75k-100k, 368.9% for AGIs $100k-200k, 2005.7% for AGIs over 200k)
Taxable individual retirement arrangement distribution: $19,173 (reported on 12.5% of returns)
55013:
$19,173
Minnesota:
$20,675
(% of AGI for various income ranges: 153.6% for AGIs below $25k, 217.1% for AGIs $25k-50k, 319.7% for AGIs $50k-75k, 483.9% for AGIs $75k-100k, 634.8% for AGIs $100k-200k, 1672.9% for AGIs over 200k)
Total itemized deductions: $28,351 (reported on 13.1% of returns)
Here:
$28,351
State:
$33,311
(% of AGI for various income ranges: 94.6% for AGIs below $25k, 135.7% for AGIs $25k-50k, 470.8% for AGIs $50k-75k, 647.1% for AGIs $75k-100k, 888.5% for AGIs $100k-200k, 6307.1% for AGIs over 200k)
Charity contributions: $8,197 (reported on 10.0% of returns)
Here:
$8,197
State:
$11,879
(% of AGI for various income ranges: 30.6% for AGIs $25k-50k, 56.1% for AGIs $50k-75k, 74.6% for AGIs $75k-100k, 164.3% for AGIs $100k-200k, 2310.0% for AGIs over 200k)
Taxes paid: $8,513 (reported on 12.8% of returns)
55013:
$8,513
State:
$8,252
(% of AGI for various income ranges: 12.9% for AGIs below $25k, 39.0% for AGIs $25k-50k, 142.1% for AGIs $50k-75k, 240.4% for AGIs $75k-100k, 308.0% for AGIs $100k-200k, 1450.0% for AGIs over 200k)
Earned income credit: $1,726 (reported on 6.4% of returns)
Here:
$1,726
State:
$2,055
(% of AGI for various income ranges: 35.4% for AGIs below $25k, 39.0% for AGIs $25k-50k)
Percentage of individuals using paid preparers for their 2020 taxes: 92.8%
Here:
93%
State:
94%
(% for various income ranges: 89.0% for AGIs below $25k, 92.6% for AGIs $25k-50k, 94.4% for AGIs $50k-75k, 92.9% for AGIs $75k-100k, 95.1% for AGIs $100k-200k, 95.7% for AGIs over 200k)
Averages for the 2012 tax year for zip code 55013, filed in 2013:
Average Adjusted Gross Income (AGI) in 2012: $69,695 (Individual Income Tax Returns)
Here:
$69,695
State:
$67,192
Salary/wage: $57,527 (reported on 81.5% of returns)
Here:
$57,527
State:
$55,182
(% of AGI for various income ranges: 67.9% for AGIs below $25k, 66.9% for AGIs $25k-50k, 72.3% for AGIs $50k-75k, 75.3% for AGIs $75k-100k, 79.2% for AGIs $100k-200k, 44.2% for AGIs over 200k)
Taxable interest for individuals: $1,079 (reported on 41.2% of returns)
This zip code:
$1,079
Minnesota:
$1,664
(% of AGI for various income ranges: 1.8% for AGIs below $25k, 1.2% for AGIs $25k-50k, 0.7% for AGIs $50k-75k, 0.4% for AGIs $75k-100k, 0.6% for AGIs $100k-200k, 0.4% for AGIs over 200k)
Ordinary dividends: $3,005 (reported on 25.2% of returns)
Here:
$3,005
State:
$5,665
(% of AGI for various income ranges: 2.3% for AGIs below $25k, 1.6% for AGIs $25k-50k, 1.1% for AGIs $50k-75k, 1.0% for AGIs $75k-100k, 1.2% for AGIs $100k-200k, 0.6% for AGIs over 200k)
Net capital gain/loss in AGI: +$14,115 (reported on 19.8% of returns)
Here:
+$14,115
State:
+$16,131
(% of AGI for various income ranges: 0.3% for AGIs $25k-50k, 0.2% for AGIs $50k-75k, 0.9% for AGIs $75k-100k, 1.0% for AGIs $100k-200k, 14.7% for AGIs over 200k)
Profit/loss from business: +$10,539 (reported on 15.7% of returns)
Here:
+$10,539
State:
+$12,430
(% of AGI for various income ranges: 6.8% for AGIs below $25k, 4.1% for AGIs $25k-50k, 4.3% for AGIs $50k-75k, 2.1% for AGIs $75k-100k, 1.9% for AGIs $100k-200k, 0.3% for AGIs over 200k)
Taxable individual retirement arrangement distribution: $14,023 (reported on 13.7% of returns)
55013:
$14,023
Minnesota:
$15,212
(% of AGI for various income ranges: 6.0% for AGIs below $25k, 4.5% for AGIs $25k-50k, 3.0% for AGIs $50k-75k, 3.0% for AGIs $75k-100k, 3.6% for AGIs $100k-200k)
Total itemized deductions: $22,717 (21% of AGI, reported on 49.8% of returns)
Here:
$22,717
State:
$24,665
Here:
20.5% of AGI
State:
19.6% of AGI
(% of AGI for various income ranges: 15.2% for AGIs below $25k, 16.3% for AGIs $25k-50k, 17.6% for AGIs $50k-75k, 18.3% for AGIs $75k-100k, 18.3% for AGIs $100k-200k, 11.8% for AGIs over 200k)
Charity contributions: $2,959 (reported on 43.5% of returns)
Here:
$2,959
State:
$3,948
(% of AGI for various income ranges: 1.1% for AGIs below $25k, 1.9% for AGIs $25k-50k, 1.7% for AGIs $50k-75k, 2.2% for AGIs $75k-100k, 2.1% for AGIs $100k-200k, 1.5% for AGIs over 200k)
Taxes paid: $9,296 (reported on 49.8% of returns)
55013:
$9,296
State:
$10,589
(% of AGI for various income ranges: 3.6% for AGIs below $25k, 4.8% for AGIs $25k-50k, 5.9% for AGIs $50k-75k, 6.8% for AGIs $75k-100k, 8.2% for AGIs $100k-200k, 6.5% for AGIs over 200k)
Earned income credit: $1,738 (reported on 10.2% of returns)
Here:
$1,738
State:
$2,037
(% of AGI for various income ranges: 3.7% for AGIs below $25k, 0.6% for AGIs $25k-50k)
Percentage of individuals using paid preparers for their 2012 taxes: 60.7%
Here:
61%
State:
55%
(% for various income ranges: 51.0% for AGIs below $25k, 60.9% for AGIs $25k-50k, 68.0% for AGIs $50k-75k, 65.8% for AGIs $75k-100k, 66.0% for AGIs $100k-200k, 72.7% for AGIs over 200k)
Averages for the 2004 tax year for zip code 55013, filed in 2005:
Average Adjusted Gross Income (AGI) in 2004: $56,640 (Individual Income Tax Returns)
Here:
$56,640
State:
$53,560
Salary/wage: $49,743 (reported on 84.0% of returns)
Here:
$49,743
State:
$46,177
(% of AGI for various income ranges: 103.4% for AGIs below $10k, 66.9% for AGIs $10k-25k, 75.7% for AGIs $25k-50k, 80.9% for AGIs $50k-75k, 86.1% for AGIs $75k-100k, 63.6% for AGIs over 100k)
Taxable interest for individuals: $1,476 (reported on 51.0% of returns)
This zip code:
$1,476
Minnesota:
$1,796
(% of AGI for various income ranges: 5.8% for AGIs below $10k, 4.0% for AGIs $10k-25k, 1.7% for AGIs $25k-50k, 1.4% for AGIs $50k-75k, 0.6% for AGIs $75k-100k, 1.0% for AGIs over 100k)
Taxable dividends: $1,608 (reported on 29.8% of returns)
Here:
$1,608
State:
$3,096
(% of AGI for various income ranges: 4.9% for AGIs below $10k, 2.1% for AGIs $10k-25k, 1.1% for AGIs $25k-50k, 0.5% for AGIs $50k-75k, 0.6% for AGIs $75k-100k, 0.8% for AGIs over 100k)
Net capital gain/loss: +$11,252 (reported on 22.6% of returns)
Here:
+$11,252
State:
+$10,864
(% of AGI for various income ranges: -0.9% for AGIs below $10k, -0.4% for AGIs $10k-25k, 0.5% for AGIs $25k-50k, 0.6% for AGIs $50k-75k, 1.3% for AGIs $75k-100k, 10.0% for AGIs over 100k)
Profit/loss from business: +$10,399 (reported on 16.7% of returns)
Here:
+$10,399
State:
+$10,442
(% of AGI for various income ranges: 7.9% for AGIs below $10k, 7.0% for AGIs $10k-25k, 4.8% for AGIs $25k-50k, 3.4% for AGIs $50k-75k, 2.5% for AGIs $75k-100k, 2.0% for AGIs over 100k)
IRA payment deduction: $3,130 (reported on 2.7% of returns)
55013:
$3,130
Minnesota:
$2,955
(% of AGI for various income ranges: 1.2% for AGIs below $10k, 0.3% for AGIs $25k-50k, 0.2% for AGIs $50k-75k, 0.1% for AGIs $75k-100k, 0.1% for AGIs over 100k)
Self-employed pension: $8,000 (reported on 0.9% of returns)
Here:
$8,000
Minnesota:
$12,099
Total itemized deductions: $20,336 (24% of AGI, reported on 54.7% of returns)
Here:
$20,336
State:
$20,035
Here:
23.9% of AGI
State:
21.3% of AGI
(% of AGI for various income ranges: 21.3% for AGIs below $10k, 18.5% for AGIs $10k-25k, 20.3% for AGIs $25k-50k, 22.5% for AGIs $50k-75k, 21.7% for AGIs $75k-100k, 17.1% for AGIs over 100k)
Charity contributions deductions: $2,681 (3% of AGI, reported on 50.4% of returns)
Here:
$2,681
State:
$3,333
Here:
3.0% of AGI
State:
3.4% of AGI
(% of AGI for various income ranges: 0.8% for AGIs below $10k, 1.9% for AGIs $10k-25k, 2.2% for AGIs $25k-50k, 2.5% for AGIs $50k-75k, 2.7% for AGIs $75k-100k, 2.4% for AGIs over 100k)
Total tax: $7,552 (reported on 81.7% of returns)
55013:
$7,552
State:
$8,485
(% of AGI for various income ranges: 3.0% for AGIs below $10k, 4.4% for AGIs $10k-25k, 6.9% for AGIs $25k-50k, 8.2% for AGIs $50k-75k, 8.7% for AGIs $75k-100k, 15.7% for AGIs over 100k)
Earned income credit: $1,520 (reported on 8.0% of returns)
Here:
$1,520
State:
$1,523
Percentage of individuals using paid preparers for their 2004 taxes: 61.4%
Here:
61%
State:
59%
(% for various income ranges: 44.7% for AGIs below $10k, 60.1% for AGIs $10k-25k, 63.9% for AGIs $25k-50k, 68.3% for AGIs $50k-75k, 64.9% for AGIs $75k-100k, 69.1% for AGIs over 100k)
Household received Food Stamps/SNAP in the past 12 months: 69 Household did not receive Food Stamps/SNAP in the past 12 months: 2,651
Women who had a birth in the past 12 months: 53 (27 now married, 25 unmarried) Women who did not have a birth in the past 12 months: 1,240 (784 now married, 457 unmarried)
Housing units in zip code 55013 with a mortgage: 1,498 (215 second mortgage, 177 both second mortgage and home equity loan) Houses without a mortgage: 28
Median monthly owner costs for units with a mortgage: $2,023 Median monthly owner costs for units without a mortgage: $711
Residents with income below the poverty level in 2022:
This zip code:
5.5%
Whole state:
9.6%
Residents with income below 50% of the poverty level in 2022:
This zip code:
1.9%
Whole state:
5.2%
Median number of rooms in houses and condos:
Here:
6.8
State:
7.1
Median number of rooms in apartments:
Here:
3.3
State:
3.8
Notable locations in this zip code not listed on our city pages
Notable locations in zip code 55013: Chisago City City Hall (A), Chisago City Fire Department (B), Chisago City Police Department (C). Display/hide their locations on the map
Churches in zip code 55013 include: Zion Church (A), Bible Baptist Church (B), Assembly of God Church (C), Kingdom Hall of Jehovahs Witnesses (D). Display/hide their locations on the map
Lakes and reservoirs: White Stone Lake (A), Wallmark Lake (B), Third Lake (C), Swamp Lake (D), Spider Lake (E), School Lake (F), Sam Lake (G), Pine Lake (H). Display/hide their locations on the map
In group quarters: 211 (-1 institutionalized population)
Size of family households: 1,039 2-persons, 338 3-persons, 428 4-persons, 141 5-persons, 86 6-persons
Size of nonfamily households: 649 1-person, 31 2-persons, 9 3-persons
1,234 married couples with children.
176 single-parent households (103 men, 73 women).
96.4% of residents of 55013 zip code speak English at home.
2.3% of residents speak Spanish at home (93% very well, 7% well).
0.3% of residents speak other Indo-European language at home (100% very well).
0.5% of residents speak Asian or Pacific Island language at home (35% very well, 29% well, 35% not well).
0.3% of residents speak other language at home (100% very well).
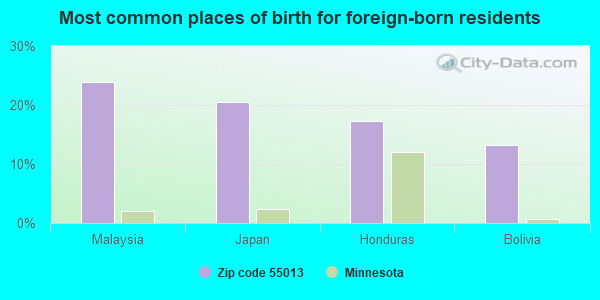
Foreign born population: 154 (2.2%) (92.8% of them are naturalized citizens)
This zip code:
2.2%
Whole state:
8.7%
24%Malaysia
21%Japan
17%Honduras
13%Bolivia
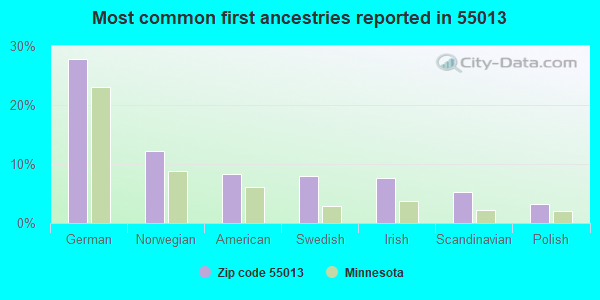
28%German
12%Norwegian
8%American
8%Swedish
8%Irish
5%Scandinavian
3%Polish
Year of entry for the foreign-born population
302010 or later
222000 to 2009
811990 to 1999
25Before 1990
Facilities with environmental interests located in this zip code:
NORTHERN ENTERPRISES INCORPORATED (10840 LIBERTY LANE in CHISAGO CITY, MN)
AIR MINOR (AIRS/AFS) STATE MASTER (Minnesota Pollution Control Agency permits and compilance tracking) - AIRS-2702500048, AIR PROGRAM, AFS-2702500048, AIR SYNTHETIC MINOR CRITERIA AND HAZARDOUS AIR POLLUTANT INVENTORY (Inventory of air pollution sources) Conditionally Exempt Small Quantity Generators, less than 100 kg/month of hazardous waste (Resource Conservation and Recovery Act (tracking hazardous waste)) - notification Business SIC classification: PLASTICS PRODUCTS Business NAICS classification: ALL OTHER PLASTICS PRODUCT MANUFACTURING. Organizations: WILLIAM A MESSINER (CONTACT/OWNER)
Alternative names: IMPRESS COMPANIES
FAIRVIEW CHISAGO LAKES HEALTH CENTER (11685 LAKE BLVD in CHISAGO CITY, MN)
STATE MASTER (Minnesota Pollution Control Agency permits and compilance tracking) - AIRS-2702500020, AIR PROGRAM, RCRAINFO-MND981538291, HAZARDOUS WASTE PROGRAM, AFS-2702500020, AIR SYNTHETIC MINOR, RCRIS-MND981538291, CESQG CRITERIA AND HAZARDOUS AIR POLLUTANT INVENTORY (Inventory of air pollution sources) Small Quantity Generators, between 100 kg and 1000 kg of hazardous waste/month (Resource Conservation and Recovery Act (tracking hazardous waste)) - notification Business SIC and NAICS classification: GENERAL MEDICAL AND SURGICAL HOSPITALS Organizations: CHISAGO LAKES HOSP DIST (CONTACT/OWNER)
, FAIRVIEW UNIVERSITY MEDICAL CENTER (CONTACT/OWNER)
Alternative names: CHISAGO LAKES HOSPITAL
GLENNAS AUTO REPAIR (10845 STINSON AVE E in CHISAGO CITY, MN)
STATE MASTER (Minnesota Pollution Control Agency permits and compilance tracking) - RCRAINFO-MND981532484, CESQG, RCRIS-MND981532484, Conditionally Exempt Small Quantity Generators, less than 100 kg/month of hazardous waste (Resource Conservation and Recovery Act (tracking hazardous waste)) - notification Business SIC classification: TOP, BODY, AND UPHOLSTERY REPAIR SHOPS AND PAINT SHOPS Business NAICS classification: AUTOMOTIVE BODY, PAINT, AND INTERIOR REPAIR AND MAINTENANCE. Organizations: GLENNA WALTER (CONTACT/OWNER)
, GLENNA S AUTO REPAIR (CONTACT/OWNER)
Alternative names: GLENNAS AUTO RPR
CHISAGO LAKES JOINT STC (31705 LOFTON AVE in CHISAGO CITY, MN)
STATE MASTER (Minnesota Pollution Control Agency permits and compilance tracking) - PCS-MN0055808, NPDES MAJOR, NPDES NON-MAJOR CRITERIA AND HAZARDOUS AIR POLLUTANT INVENTORY (Inventory of air pollution sources) National Pollutant Discharge Elimination System MAJOR (Tracking pollutant discharge elimination systems) - permit Business SIC classification: SEWERAGE SYSTEMS Business NAICS classification: SEWAGE TREATMENT FACILITIES. Organizations: CHISAGO LAKES JSTC (CONTACT/OPERATOR)
MILTS AUTO BODY AND PAINT (8885 WYOMING TRAIL in CHISAGO CITY, MN)
STATE MASTER (Minnesota Pollution Control Agency permits and compilance tracking) - RCRAINFO-MN0000451310, CESQG, RCRIS-MN0000451310, Conditionally Exempt Small Quantity Generators, less than 100 kg/month of hazardous waste (Resource Conservation and Recovery Act (tracking hazardous waste)) - notification Business SIC classification: TOP, BODY, AND UPHOLSTERY REPAIR SHOPS AND PAINT SHOPS Organizations: LESMANN MILTON (CONTACT/OWNER)
, MILTS AUTO BODY & PAINT (CONTACT/OWNER)
HAUS SPECIALTY MFG (29500 BLOOM ST in CHISAGO CITY, MN)
STATE MASTER (Minnesota Pollution Control Agency permits and compilance tracking) - RCRAINFO-MN0000196196, HAZARDOUS WASTE PROGRAM, RCRIS-MN0000196196, Small Quantity Generators, between 100 kg and 1000 kg of hazardous waste/month (Resource Conservation and Recovery Act (tracking hazardous waste)) - notification Organizations: HAUS BRUCE (CONTACT/OWNER)
HAUS SPECIALTY MFG (10489 LIBERTY LANE in CHISAGO CITY, MN)
STATE MASTER (Minnesota Pollution Control Agency permits and compilance tracking) - RCRAINFO-MNR000025031, CESQG, RCRIS-MNR000025031, Conditionally Exempt Small Quantity Generators, less than 100 kg/month of hazardous waste (Resource Conservation and Recovery Act (tracking hazardous waste)) - notification Business SIC classification: CUTTING TOOLS, MACHINE TOOL ACCESSORIES, AND MACHINISTS' PRECISION MEASURING DEVICES Business NAICS classification: MACHINE SHOPS. Organizations: HAUS BRUCE (CONTACT/OWNER)
CHISAGO HARDWARE (HWY 8 AND CNTY 77 in CHISAGO CITY, MN)
STATE MASTER (Minnesota Pollution Control Agency permits and compilance tracking) - RCRAINFO-MND985700608, CESQG, RCRIS-MND985700608, Conditionally Exempt Small Quantity Generators, less than 100 kg/month of hazardous waste (Resource Conservation and Recovery Act (tracking hazardous waste)) - notification Organizations: DUSENKA FRANK C (CONTACT/OWNER)
FISK TIRE & AUTO REPAIR INC (29611 GATEWAY AVE in CHISAGO CITY, MN)
STATE MASTER (Minnesota Pollution Control Agency permits and compilance tracking) - RCRIS-MNS000106971, CESQG Conditionally Exempt Small Quantity Generators, less than 100 kg/month of hazardous waste (Resource Conservation and Recovery Act (tracking hazardous waste)) Business SIC classification: TIRES AND TUBES Business NAICS classification: TIRE DEALERS.
FOSHAY JAMES (24520 LOFTON AVENUE in CHISAGO CITY, MN)
(Resource Conservation and Recovery Act (tracking hazardous waste)) Business NAICS classification: AUTOMOTIVE TRANSMISSION REPAIR. Organizations: JAMES L FOSHAY (CONTACT/OPERATOR)
, FOSHAY JAMES L (CONTACT/OWNER)
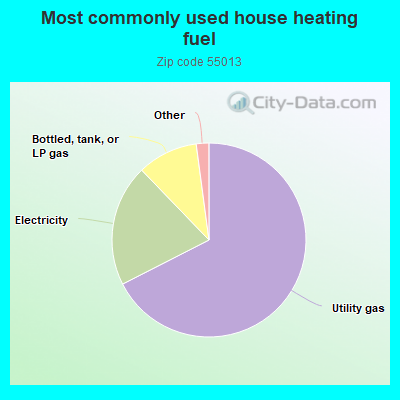
67.5%Utility gas
20.3%Electricity
10.1%Bottled, tank, or LP gas
0.9%Wood
0.6%No fuel used
Population in 1990: 2,905. Population change in the 1990s: +2,095 (+72.1%).
Place of birth for U.S.-born residents:
This state: 5,194
Northeast: 99
Midwest: 1,147
South: 75
West: 165
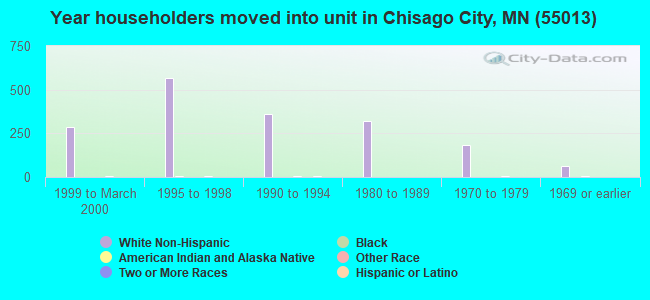
53% of the 55013 zip code residents lived in the same house 5 years ago. Out of people who lived in different houses, 40% lived in this county. Out of people who lived in different counties, 50% lived in Minnesota.
88% of the 55013 zip code residents lived in the same house 1 year ago. Out of people who lived in different houses, 57% moved from this county. Out of people who lived in different houses, 35% moved from different county within same state. Out of people who lived in different houses, 2% moved from different state. Out of people who lived in different houses, 1% moved from abroad.
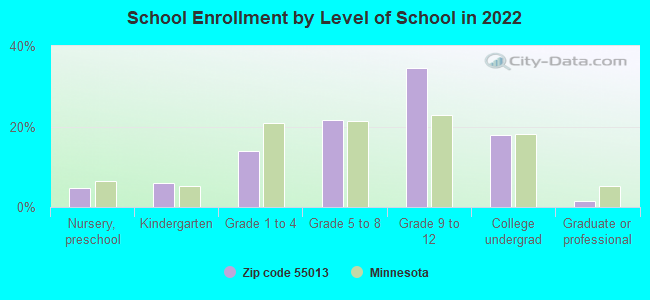
Private vs. public school enrollment:
Students in private schools in grades 1 to 8 (elementary and middle school): 99
Here:
20.0%
Minnesota:
12.9%
Students in private schools in grades 9 to 12 (high school):
Here:
0.0%
Minnesota:
8.6%
Students in private undergraduate colleges: 111
Here:
43.1%
Minnesota:
26.2%
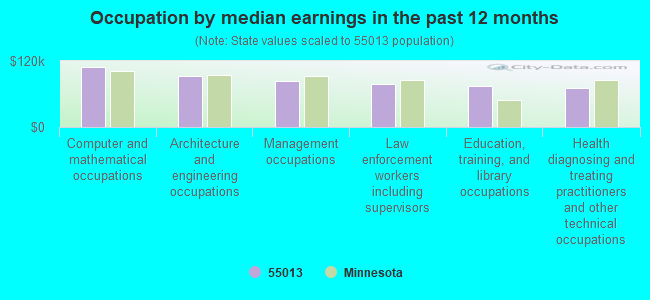
Occupation by median earnings in the past 12 months ($)
108,786Computer and mathematical occupations
92,257Architecture and engineering occupations
82,847Management occupations
78,351Law enforcement workers including supervisors
75,412Education, training, and library occupations
71,401Health diagnosing and treating practitioners and other technical occupations
Companies with federal contracts located in this zip code:
A & S TRAINING LLC (26981 MORGAN AVE in CHISAGO CITY, MN; small business) : $29,830 in 2 contractsfrom 2004 to 2005
$23,630 with Army for Educational Services. Signed on 2004-03-11. Completion date: 2004-06-12.
$6,200 with Army for Education Services. Signed on 2005-01-26. Completion date: 2005-04-17.
Top industries in this zip code by the number of employees in 2005:
Health Care and Social Assistance: Continuing Care Retirement Communities (100-249 employees: 1 establishment, 10-19 employees: 1 establishment)
Health Care and Social Assistance: Nursing Care Facilities (100-249: 1)
Health Care and Social Assistance: Vocational Rehabilitation Services (100-249: 1)
Accommodation and Food Services: Limited-Service Restaurants (20-49: 2)
Other Services (except Public Administration): Religious Organizations (20-49: 1, 10-19: 1, 1-4: 1)
Accommodation and Food Services: Full-Service Restaurants (20-49: 1, 5-9: 1)
Finance and Insurance: Commercial Banking (20-49: 1, 5-9: 1)
Wholesale Trade: Beer and Ale Merchant Wholesalers (20-49: 1)
People in group quarters in 2010:
106 people in nursing facilities/skilled-nursing facilities
27 people in group homes intended for adults
5 people in residential treatment centers for juveniles (non-correctional)
4 people in workers' group living quarters and job corps centers
People in group quarters in 2000:
96 people in nursing homes
12 people in homes for the mentally retarded
5 people in other group homes
Fatal accident statistics in 2014:
Fatal accident count: 1
Vehicles involved in fatal accidents: 2
Fatal accidents caused by drunken drivers: 0
Fatalities: 1
Persons involved in fatal accidents: 2
Pedestrians involved in fatal accidents: 0
Fatal accident statistics in 2013:
Fatal accident count: 1
Vehicles involved in fatal accidents: 2
Fatal accidents caused by drunken drivers: 0
Fatalities: 1
Persons involved in fatal accidents: 3
Pedestrians involved in fatal accidents: 0
Home Mortgage Disclosure Act Aggregated Statistics For Year 2009 (Based on 6 partial tracts)
A) FHA, FSA/RHS & VA Home Purchase Loans
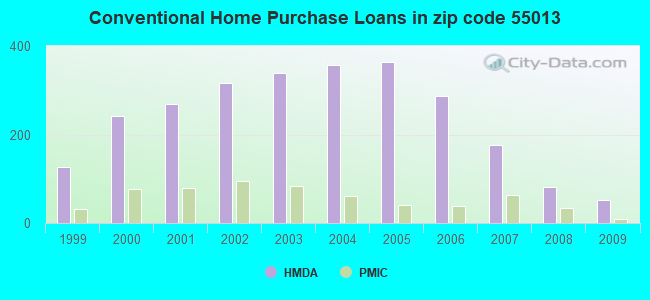
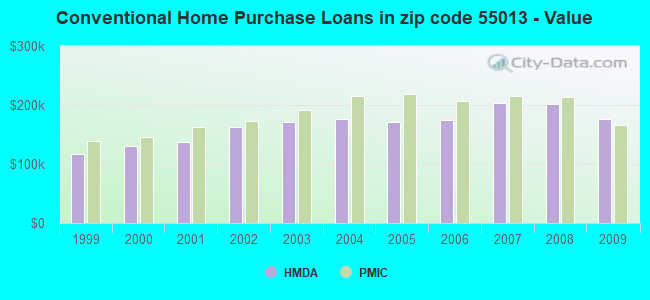
B) Conventional Home Purchase Loans
C) Refinancings
D) Home Improvement Loans
E) Loans on Dwellings For 5+ Families
F) Non-occupant Loans on < 5 Family Dwellings (A B C & D)
G) Loans On Manufactured Home Dwelling (A B C & D)
Number
Average Value
Number
Average Value
Number
Average Value
Number
Average Value
Number
Average Value
Number
Average Value
Number
Average Value
LOANS ORIGINATED
72
$174,618
53
$176,979
472
$192,996
21
$74,321
1
$296,600
32
$213,822
3
$124,917
APPLICATIONS APPROVED, NOT ACCEPTED
4
$148,442
5
$126,068
44
$207,746
5
$67,020
0
$0
2
$203,150
2
$37,615
APPLICATIONS DENIED
9
$171,058
9
$166,467
151
$225,774
9
$56,360
0
$0
8
$165,459
1
$3,250
APPLICATIONS WITHDRAWN
4
$162,765
7
$190,996
96
$192,605
8
$70,630
0
$0
7
$171,849
1
$48,760
FILES CLOSED FOR INCOMPLETENESS
2
$231,565
1
$193,340
32
$217,727
0
$0
0
$0
1
$315,290
0
$0
Aggregated Statistics For Year 2008 (Based on 6 partial tracts)
A) FHA, FSA/RHS & VA Home Purchase Loans
B) Conventional Home Purchase Loans
C) Refinancings
D) Home Improvement Loans
E) Loans on Dwellings For 5+ Families
F) Non-occupant Loans on < 5 Family Dwellings (A B C & D)
G) Loans On Manufactured Home Dwelling (A B C & D)
Number
Average Value
Number
Average Value
Number
Average Value
Number
Average Value
Number
Average Value
Number
Average Value
Number
Average Value
LOANS ORIGINATED
53
$174,322
82
$202,517
241
$189,429
39
$58,782
1
$2,437,800
30
$172,090
3
$49,530
APPLICATIONS APPROVED, NOT ACCEPTED
3
$180,987
16
$164,983
54
$235,167
7
$112,206
1
$418,490
7
$185,100
2
$46,620
APPLICATIONS DENIED
8
$154,919
20
$229,914
150
$210,361
22
$88,844
0
$0
11
$278,505
4
$23,625
APPLICATIONS WITHDRAWN
3
$119,007
15
$241,042
66
$216,590
4
$147,418
0
$0
8
$210,310
1
$27,590
FILES CLOSED FOR INCOMPLETENESS
1
$141,850
4
$210,225
17
$200,038
2
$38,500
0
$0
1
$287,530
0
$0
Aggregated Statistics For Year 2007 (Based on 6 partial tracts)
A) FHA, FSA/RHS & VA Home Purchase Loans
B) Conventional Home Purchase Loans
C) Refinancings
D) Home Improvement Loans
F) Non-occupant Loans on < 5 Family Dwellings (A B C & D)
G) Loans On Manufactured Home Dwelling (A B C & D)
Number
Average Value
Number
Average Value
Number
Average Value
Number
Average Value
Number
Average Value
Number
Average Value
LOANS ORIGINATED
5
$172,294
176
$203,099
335
$182,244
71
$73,637
55
$198,674
5
$33,658
APPLICATIONS APPROVED, NOT ACCEPTED
1
$127,890
21
$211,136
69
$181,552
19
$75,487
4
$271,265
2
$36,180
APPLICATIONS DENIED
0
$0
27
$194,190
202
$205,254
24
$77,682
18
$218,759
6
$33,083
APPLICATIONS WITHDRAWN
1
$128,390
19
$200,756
69
$211,112
7
$90,793
6
$182,822
0
$0
FILES CLOSED FOR INCOMPLETENESS
0
$0
5
$241,050
29
$235,370
2
$63,355
2
$319,350
0
$0
Aggregated Statistics For Year 2006 (Based on 6 partial tracts)
A) FHA, FSA/RHS & VA Home Purchase Loans
B) Conventional Home Purchase Loans
C) Refinancings
D) Home Improvement Loans
E) Loans on Dwellings For 5+ Families
F) Non-occupant Loans on < 5 Family Dwellings (A B C & D)
G) Loans On Manufactured Home Dwelling (A B C & D)
Number
Average Value
Number
Average Value
Number
Average Value
Number
Average Value
Number
Average Value
Number
Average Value
Number
Average Value
LOANS ORIGINATED
8
$224,048
288
$174,372
432
$176,852
86
$57,432
1
$40,630
51
$163,359
7
$39,077
APPLICATIONS APPROVED, NOT ACCEPTED
0
$0
33
$168,042
80
$202,598
10
$102,576
0
$0
10
$171,583
2
$41,035
APPLICATIONS DENIED
1
$251,520
55
$159,786
214
$193,337
29
$97,561
0
$0
16
$155,438
10
$43,002
APPLICATIONS WITHDRAWN
2
$181,165
38
$162,764
140
$212,632
17
$108,915
0
$0
5
$112,156
1
$45,660
FILES CLOSED FOR INCOMPLETENESS
0
$0
6
$255,978
40
$220,663
2
$135,415
0
$0
1
$269,680
0
$0
Aggregated Statistics For Year 2005 (Based on 6 partial tracts)
A) FHA, FSA/RHS & VA Home Purchase Loans
B) Conventional Home Purchase Loans
C) Refinancings
D) Home Improvement Loans
E) Loans on Dwellings For 5+ Families
F) Non-occupant Loans on < 5 Family Dwellings (A B C & D)
G) Loans On Manufactured Home Dwelling (A B C & D)
Number
Average Value
Number
Average Value
Number
Average Value
Number
Average Value
Number
Average Value
Number
Average Value
Number
Average Value
LOANS ORIGINATED
11
$190,913
364
$170,648
534
$185,705
94
$65,479
1
$484,310
46
$161,705
6
$27,773
APPLICATIONS APPROVED, NOT ACCEPTED
0
$0
33
$145,134
85
$174,365
11
$71,047
0
$0
5
$143,276
6
$43,157
APPLICATIONS DENIED
1
$214,600
57
$135,418
202
$179,304
36
$68,551
0
$0
13
$157,350
10
$51,267
APPLICATIONS WITHDRAWN
0
$0
35
$172,094
206
$195,627
11
$104,285
0
$0
11
$181,892
2
$30,065
FILES CLOSED FOR INCOMPLETENESS
1
$152,770
10
$180,137
72
$203,070
3
$36,207
0
$0
0
$0
0
$0
Aggregated Statistics For Year 2004 (Based on 6 partial tracts)
A) FHA, FSA/RHS & VA Home Purchase Loans
B) Conventional Home Purchase Loans
C) Refinancings
D) Home Improvement Loans
F) Non-occupant Loans on < 5 Family Dwellings (A B C & D)
G) Loans On Manufactured Home Dwelling (A B C & D)
Number
Average Value
Number
Average Value
Number
Average Value
Number
Average Value
Number
Average Value
Number
Average Value
LOANS ORIGINATED
21
$187,241
357
$175,686
576
$169,313
77
$49,262
46
$159,577
6
$65,095
APPLICATIONS APPROVED, NOT ACCEPTED
0
$0
28
$168,579
94
$181,531
7
$109,996
6
$150,612
2
$41,710
APPLICATIONS DENIED
5
$153,134
47
$131,423
197
$157,909
32
$69,771
8
$147,464
20
$40,267
APPLICATIONS WITHDRAWN
3
$181,530
25
$172,299
181
$180,413
14
$69,905
1
$187,620
1
$64,920
FILES CLOSED FOR INCOMPLETENESS
0
$0
8
$201,490
44
$202,073
1
$194,520
0
$0
0
$0
Aggregated Statistics For Year 2003 (Based on 6 partial tracts)
A) FHA, FSA/RHS & VA Home Purchase Loans
B) Conventional Home Purchase Loans
C) Refinancings
D) Home Improvement Loans
E) Loans on Dwellings For 5+ Families
F) Non-occupant Loans on < 5 Family Dwellings (A B C & D)
Number
Average Value
Number
Average Value
Number
Average Value
Number
Average Value
Number
Average Value
Number
Average Value
LOANS ORIGINATED
26
$175,006
338
$170,763
1,426
$152,344
80
$34,642
2
$443,680
40
$159,014
APPLICATIONS APPROVED, NOT ACCEPTED
2
$150,185
30
$183,745
109
$164,818
6
$68,117
0
$0
4
$237,980
APPLICATIONS DENIED
3
$173,160
37
$103,010
242
$156,311
16
$20,988
0
$0
8
$107,210
APPLICATIONS WITHDRAWN
1
$119,800
33
$177,957
298
$160,897
5
$16,926
0
$0
5
$105,440
FILES CLOSED FOR INCOMPLETENESS
1
$156,830
3
$234,057
54
$159,939
1
$64,570
0
$0
3
$92,047
Aggregated Statistics For Year 2002 (Based on 6 partial tracts)
A) FHA, FSA/RHS & VA Home Purchase Loans
B) Conventional Home Purchase Loans
C) Refinancings
D) Home Improvement Loans
F) Non-occupant Loans on < 5 Family Dwellings (A B C & D)
Number
Average Value
Number
Average Value
Number
Average Value
Number
Average Value
Number
Average Value
LOANS ORIGINATED
36
$166,654
316
$162,066
945
$145,645
85
$32,823
27
$113,280
APPLICATIONS APPROVED, NOT ACCEPTED
1
$199,440
27
$152,951
99
$148,191
12
$33,002
3
$151,070
APPLICATIONS DENIED
1
$106,470
28
$87,188
195
$127,522
22
$32,031
5
$96,356
APPLICATIONS WITHDRAWN
1
$136,330
14
$130,954
259
$153,703
7
$46,486
1
$110,360
FILES CLOSED FOR INCOMPLETENESS
1
$83,700
6
$152,377
40
$154,144
1
$4,880
1
$89,390
Aggregated Statistics For Year 2001 (Based on 6 partial tracts)
A) FHA, FSA/RHS & VA Home Purchase Loans
B) Conventional Home Purchase Loans
C) Refinancings
D) Home Improvement Loans
E) Loans on Dwellings For 5+ Families
F) Non-occupant Loans on < 5 Family Dwellings (A B C & D)
Number
Average Value
Number
Average Value
Number
Average Value
Number
Average Value
Number
Average Value
Number
Average Value
LOANS ORIGINATED
54
$143,558
269
$137,877
765
$131,428
87
$26,514
1
$12,190
24
$111,014
APPLICATIONS APPROVED, NOT ACCEPTED
1
$131,140
19
$115,768
64
$126,856
4
$30,335
0
$0
3
$70,833
APPLICATIONS DENIED
5
$134,380
35
$83,887
199
$111,254
30
$22,840
0
$0
6
$124,973
APPLICATIONS WITHDRAWN
3
$101,510
15
$147,627
160
$113,415
13
$38,953
0
$0
2
$59,440
FILES CLOSED FOR INCOMPLETENESS
0
$0
7
$113,613
36
$115,109
3
$19,673
0
$0
1
$117,510
Aggregated Statistics For Year 2000 (Based on 6 partial tracts)
A) FHA, FSA/RHS & VA Home Purchase Loans
B) Conventional Home Purchase Loans
C) Refinancings
D) Home Improvement Loans
F) Non-occupant Loans on < 5 Family Dwellings (A B C & D)
Number
Average Value
Number
Average Value
Number
Average Value
Number
Average Value
Number
Average Value
LOANS ORIGINATED
54
$132,642
242
$130,489
205
$94,948
89
$23,691
15
$112,319
APPLICATIONS APPROVED, NOT ACCEPTED
1
$101,580
26
$102,874
31
$107,990
15
$32,388
1
$141,710
APPLICATIONS DENIED
2
$148,910
49
$80,913
98
$74,891
38
$27,552
3
$75,067
APPLICATIONS WITHDRAWN
0
$0
17
$118,746
76
$89,445
4
$17,780
2
$143,410
FILES CLOSED FOR INCOMPLETENESS
0
$0
5
$174,168
28
$109,208
1
$14,930
2
$147,895
Aggregated Statistics For Year 1999 (Based on 3 partial tracts)
A) FHA, FSA/RHS & VA Home Purchase Loans
B) Conventional Home Purchase Loans
C) Refinancings
D) Home Improvement Loans
F) Non-occupant Loans on < 5 Family Dwellings (A B C & D)
2003 - 2018 National Fire Incident Reporting System (NFIRS) incidents
According to the data from the years 2003 - 2018 the average number of fires per year is 17. The highest number of reported fires - 31 took place in 2011, and the least - 2 in 2003. The data has an increasing trend.
When looking into fire subcategories, the most reports belonged to: Structure Fires (43.4%), and Outside Fires (28.7%).
Fire incident types reported to NFIRS in Zip Code 55013


 Nearest zip codes: 55045, 55073, 55025, 55079, 55012, 55047.


 According to the data from the years 2003 - 2018 the average number of fires per year is 17. The highest number of reported fires - 31 took place in 2011, and the least - 2 in 2003. The data has an increasing trend.
 When looking into fire subcategories, the most reports belonged to: Structure Fires (43.4%), and Outside Fires (28.7%).