Estimated zip code population in 2022: 1,997 Zip code population in 2010: 1,939 Zip code population in 2000: 1,794
Houses and condos: 1,622 Renter-occupied apartments: 153
% of renters here:
18%
State:
27%
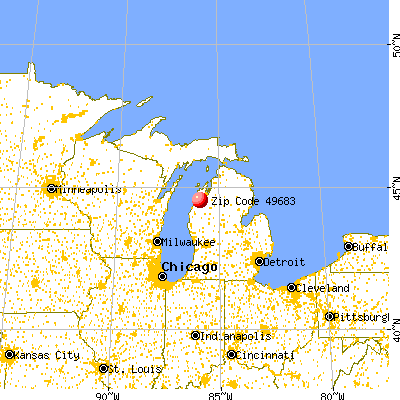
March 2022 cost of living index in zip code 49683: 82.6 (low, U.S. average is 100)
Land area: 86.1 sq. mi. Water area: 0.4 sq. mi.
Population density: 23 people per square mile
(very low).
OSM Map
General Map
Google Map
MSN Map
OSM Map
General Map
Google Map
MSN Map
OSM Map
General Map
Google Map
MSN Map
OSM Map
General Map
Google Map
MSN Map
Please wait while loading the map...
Real estate property taxes paid for housing units in 2022:
This zip code:
0.8% ($1,338)
Michigan:
1.2% ($2,746)
Median real estate property taxes paid for housing units with mortgages in 2022: $1,555 (0.7%) Median real estate property taxes paid for housing units with no mortgage in 2022: $1,094 (0.9%)
Business Search- 14 Million verified businesses
Males: 1,022
(51.2%)
Females: 974
(48.8%)
For population 25 years and over in 49683:
High school or higher: 86.7%
Bachelor's degree or higher: 21.3%
Graduate or professional degree: 6.9%
Unemployed: 4.1%
Mean travel time to work (commute): 28.3 minutes
For population 15 years and over in 49683:
Never married: 24.5%
Now married: 49.0%
Separated: 1.3%
Widowed: 6.4%
Divorced: 18.9%
Zip code 49683 compared to state average:
Black race population percentage significantly below state average.
Hispanic race population percentage significantly below state average.
Median age significantly above state average.
Foreign-born population percentage significantly below state average.
Renting percentage below state average.
Length of stay since moving in significantly above state average.
Averages for the 2020 tax year for zip code 49683, filed in 2021:
Average Adjusted Gross Income (AGI) in 2020: $55,552 (Individual Income Tax Returns)
Here:
$55,552
State:
$68,945
Salary/wage: $40,532 (reported on 76.6% of returns)
Here:
$40,532
State:
$57,142
(% of AGI for various income ranges: 970.0% for AGIs below $25k, 3159.6% for AGIs $25k-50k, 5975.0% for AGIs $50k-75k, 7958.3% for AGIs $75k-100k, 12893.3% for AGIs $100k-200k)
Taxable interest for individuals: $1,796 (reported on 25.2% of returns)
This zip code:
$1,796
Michigan:
$1,630
(% of AGI for various income ranges: 11.7% for AGIs below $25k, 21.7% for AGIs $25k-50k, 7.0% for AGIs $50k-75k, 43.3% for AGIs $75k-100k, 110.0% for AGIs $100k-200k)
Ordinary dividends: $9,333 (reported on 14.0% of returns)
Here:
$9,333
State:
$6,972
(% of AGI for various income ranges: 14.5% for AGIs below $25k, 25.8% for AGIs $25k-50k, 143.0% for AGIs $50k-75k, 113.3% for AGIs $100k-200k)
Net capital gain/loss in AGI: +$12,360 (reported on 14.0% of returns)
Here:
+$12,360
State:
+$20,064
(% of AGI for various income ranges: 5.9% for AGIs below $25k, 65.8% for AGIs $25k-50k, 247.0% for AGIs $50k-75k, 2386.7% for AGIs $100k-200k)
Profit/loss from business: +$8,829 (reported on 15.9% of returns)
Here:
+$8,829
State:
+$11,172
(% of AGI for various income ranges: 150.3% for AGIs below $25k, 116.3% for AGIs $25k-50k, 150.0% for AGIs $50k-75k, 1060.0% for AGIs $100k-200k)
Taxable individual retirement arrangement distribution: $16,318 (reported on 10.3% of returns)
49683:
$16,318
Michigan:
$19,803
(% of AGI for various income ranges: 61.0% for AGIs below $25k, 143.8% for AGIs $25k-50k, 256.0% for AGIs $50k-75k, 1695.0% for AGIs $100k-200k)
Total itemized deductions: $26,150 (reported on 3.7% of returns)
Here:
$26,150
State:
$34,117
(% of AGI for various income ranges: 1743.3% for AGIs $100k-200k)
Taxes paid: $7,933 (reported on 2.8% of returns)
49683:
$7,933
State:
$7,972
(% of AGI for various income ranges: 396.7% for AGIs $100k-200k)
Earned income credit: $2,006 (reported on 15.9% of returns)
Here:
$2,006
State:
$2,251
(% of AGI for various income ranges: 73.1% for AGIs below $25k, 53.8% for AGIs $25k-50k)
Percentage of individuals using paid preparers for their 2020 taxes: 91.6%
Here:
92%
State:
93%
(% for various income ranges: 90.2% for AGIs below $25k, 93.5% for AGIs $25k-50k, 92.3% for AGIs $50k-75k, 88.9% for AGIs $75k-100k, 90.0% for AGIs $100k-200k, 100.0% for AGIs over 200k)
Averages for the 2012 tax year for zip code 49683, filed in 2013:
Average Adjusted Gross Income (AGI) in 2012: $37,022 (Individual Income Tax Returns)
Here:
$37,022
State:
$55,609
Salary/wage: $29,624 (reported on 80.0% of returns)
Here:
$29,624
State:
$46,782
(% of AGI for various income ranges: 68.6% for AGIs below $25k, 68.8% for AGIs $25k-50k, 74.1% for AGIs $50k-75k, 65.8% for AGIs $75k-100k, 46.4% for AGIs $100k-200k)
Taxable interest for individuals: $1,330 (reported on 24.2% of returns)
This zip code:
$1,330
Michigan:
$1,491
(% of AGI for various income ranges: 0.5% for AGIs below $25k, 0.9% for AGIs $25k-50k, 0.3% for AGIs $50k-75k, 1.9% for AGIs $75k-100k, 1.1% for AGIs $100k-200k)
Ordinary dividends: $3,315 (reported on 13.7% of returns)
Here:
$3,315
State:
$6,225
(% of AGI for various income ranges: 0.1% for AGIs below $25k, 1.1% for AGIs $25k-50k, 2.6% for AGIs $50k-75k, 1.4% for AGIs $100k-200k)
Net capital gain/loss in AGI: +$1,856 (reported on 9.5% of returns)
Here:
+$1,856
State:
+$9,326
(% of AGI for various income ranges: 0.1% for AGIs $50k-75k, 2.0% for AGIs $100k-200k)
Profit/loss from business: +$3,581 (reported on 16.8% of returns)
Here:
+$3,581
State:
+$11,523
(% of AGI for various income ranges: 7.2% for AGIs below $25k, 1.3% for AGIs $25k-50k, 0.1% for AGIs $50k-75k, 1.3% for AGIs $75k-100k)
Taxable individual retirement arrangement distribution: $15,878 (reported on 9.5% of returns)
49683:
$15,878
Michigan:
$15,298
(% of AGI for various income ranges: 2.2% for AGIs below $25k, 6.9% for AGIs $25k-50k, 16.1% for AGIs $75k-100k)
Total itemized deductions: $16,332 (22% of AGI, reported on 23.2% of returns)
Here:
$16,332
State:
$21,628
Here:
22.5% of AGI
State:
18.4% of AGI
(% of AGI for various income ranges: 8.6% for AGIs below $25k, 10.1% for AGIs $25k-50k, 10.4% for AGIs $50k-75k, 9.8% for AGIs $75k-100k, 11.3% for AGIs $100k-200k)
Charity contributions: $1,964 (reported on 14.7% of returns)
Here:
$1,964
State:
$4,225
(% of AGI for various income ranges: 1.0% for AGIs $25k-50k, 1.2% for AGIs $50k-75k, 1.1% for AGIs $100k-200k)
Taxes paid: $5,109 (reported on 23.2% of returns)
49683:
$5,109
State:
$8,327
(% of AGI for various income ranges: 1.1% for AGIs below $25k, 2.4% for AGIs $25k-50k, 3.2% for AGIs $50k-75k, 3.2% for AGIs $75k-100k, 5.3% for AGIs $100k-200k)
Earned income credit: $1,941 (reported on 23.2% of returns)
Here:
$1,941
State:
$2,306
(% of AGI for various income ranges: 6.3% for AGIs below $25k, 0.9% for AGIs $25k-50k)
Percentage of individuals using paid preparers for their 2012 taxes: 51.6%
Here:
52%
State:
57%
(% for various income ranges: 45.8% for AGIs below $25k, 50.0% for AGIs $25k-50k, 61.5% for AGIs $50k-75k, 60.0% for AGIs $75k-100k, 80.0% for AGIs $100k-200k)
Averages for the 2004 tax year for zip code 49683, filed in 2005:
Average Adjusted Gross Income (AGI) in 2004: $32,498 (Individual Income Tax Returns)
Here:
$32,498
State:
$48,204
Salary/wage: $26,683 (reported on 85.7% of returns)
Here:
$26,683
State:
$42,791
(% of AGI for various income ranges: 118.4% for AGIs below $10k, 73.6% for AGIs $10k-25k, 72.4% for AGIs $25k-50k, 81.7% for AGIs $50k-75k, 70.2% for AGIs $75k-100k, 39.6% for AGIs over 100k)
Taxable interest for individuals: $1,103 (reported on 36.6% of returns)
This zip code:
$1,103
Michigan:
$1,725
(% of AGI for various income ranges: 4.7% for AGIs below $10k, 1.1% for AGIs $10k-25k, 1.2% for AGIs $25k-50k, 0.4% for AGIs $50k-75k, 1.4% for AGIs $75k-100k, 2.2% for AGIs over 100k)
Taxable dividends: $1,217 (reported on 15.9% of returns)
Here:
$1,217
State:
$3,420
(% of AGI for various income ranges: 0.6% for AGIs $10k-25k, 0.6% for AGIs $25k-50k, 0.2% for AGIs $50k-75k, 0.6% for AGIs $75k-100k, 1.3% for AGIs over 100k)
Net capital gain/loss: +$4,504 (reported on 13.7% of returns)
Here:
+$4,504
State:
+$8,532
(% of AGI for various income ranges: -0.1% for AGIs $10k-25k, 1.3% for AGIs $25k-50k, 0.2% for AGIs $50k-75k, -0.4% for AGIs $75k-100k, 9.6% for AGIs over 100k)
Profit/loss from business: +$3,331 (reported on 18.4% of returns)
Here:
+$3,331
State:
+$9,547
(% of AGI for various income ranges: 0.3% for AGIs below $10k, 4.6% for AGIs $10k-25k, 2.4% for AGIs $25k-50k, 2.0% for AGIs $50k-75k, -1.2% for AGIs $75k-100k)
IRA payment deduction: $2,852 (reported on 3.0% of returns)
49683:
$2,852
Michigan:
$2,875
Total itemized deductions: $14,619 (24% of AGI, reported on 23.9% of returns)
Here:
$14,619
State:
$18,509
Here:
24.1% of AGI
State:
20.7% of AGI
(% of AGI for various income ranges: 8.6% for AGIs $10k-25k, 8.8% for AGIs $25k-50k, 13.0% for AGIs $50k-75k, 14.1% for AGIs $75k-100k, 12.4% for AGIs over 100k)
Charity contributions deductions: $1,816 (3% of AGI, reported on 16.9% of returns)
Here:
$1,816
State:
$3,365
Here:
2.7% of AGI
State:
3.6% of AGI
(% of AGI for various income ranges: 0.6% for AGIs $10k-25k, 0.6% for AGIs $25k-50k, 0.8% for AGIs $50k-75k, 1.3% for AGIs $75k-100k, 2.1% for AGIs over 100k)
Total tax: $3,748 (reported on 71.0% of returns)
49683:
$3,748
State:
$7,691
(% of AGI for various income ranges: 3.1% for AGIs below $10k, 3.5% for AGIs $10k-25k, 5.7% for AGIs $25k-50k, 8.1% for AGIs $50k-75k, 10.3% for AGIs $75k-100k, 17.4% for AGIs over 100k)
Earned income credit: $1,772 (reported on 21.4% of returns)
Here:
$1,772
State:
$1,737
Percentage of individuals using paid preparers for their 2004 taxes: 62.0%
Here:
62%
State:
60%
(% for various income ranges: 49.4% for AGIs below $10k, 61.0% for AGIs $10k-25k, 66.4% for AGIs $25k-50k, 69.8% for AGIs $50k-75k, 65.7% for AGIs $75k-100k, 75.9% for AGIs over 100k)
Household received Food Stamps/SNAP in the past 12 months: 183 Household did not receive Food Stamps/SNAP in the past 12 months: 682
Women who had a birth in the past 12 months: 17 (11 now married, 5 unmarried) Women who did not have a birth in the past 12 months: 340 (154 now married, 185 unmarried)
Housing units in zip code 49683 with a mortgage: 383 (22 second mortgage, 2 home equity loan, 12 both second mortgage and home equity loan) Houses without a mortgage: 1
Median monthly owner costs for units with a mortgage: $1,195 Median monthly owner costs for units without a mortgage: $401
Residents with income below the poverty level in 2022:
This zip code:
16.6%
Whole state:
13.4%
Residents with income below 50% of the poverty level in 2022:
This zip code:
7.1%
Whole state:
6.9%
Median number of rooms in houses and condos:
Here:
5.9
State:
6.5
Median number of rooms in apartments:
Here:
4.8
State:
4.3
Notable locations in this zip code not listed on our city pages
Notable locations in zip code 49683: Crystal Mountain Betsie Valley Golf Course (A), Crystal Mountain Mountain Ridge Golf Course (B), Crystal Mountain Ski Area (C), Turtle Lake Campground (D), Ramsay School (E), Crystal Mountain Resort (F), Thompsonville Volunteer Ambulance Service (G), Betsie Valley District Library (H), Weldon Township Hall (I), Colfax Township Hall (J), Thompsonville Village Hall (K), Thompsonville Volunteer Fire Department (L). Display/hide their locations on the map
Churches in zip code 49683 include: Saint Raphael Church (A), First Congregational Church (B), Springdale Church (C). Display/hide their locations on the map
Cemeteries: Colfax Township Cemetery (1), Thompsonville Cemetery (2), Springdale Cemetery (3), Township Cemetery (4), Holy Family Cemetery (5). Display/hide their locations on the map
Rivers and creeks: Pickerel Creek (A), Grass Lake Creek (B), Third Creek (C), First Creek (D), Little Betsie River (E), Second Creek (F), Dutchman Creek (G). Display/hide their locations on the map
Size of family households: 297 2-persons, 68 3-persons, 79 4-persons, 35 5-persons, 6 6-persons, 4 7-or-more-persons
Size of nonfamily households: 275 1-person, 94 2-persons, 5 3-persons
231 married couples with children.
82 single-parent households (12 men, 70 women).
98.3% of residents of 49683 zip code speak English at home.
0.6% of residents speak Spanish at home (64% very well, 36% not well).
1.3% of residents speak other Indo-European language at home (72% very well, 16% well, 12% not well).
Foreign born population: 40 (2.0%) (56.3% of them are naturalized citizens)
This zip code:
2.0%
Whole state:
6.9%
40%Afghanistan
15%France
8%Sweden
8%United Kingdom, excluding England and Scotland
8%Guatemala
20%German
12%English
10%American
7%Irish
7%Polish
5%Dutch
3%European
Year of entry for the foreign-born population
162010 or later
02000 to 2009
101990 to 1999
13Before 1990
Facilities with environmental interests located in this zip code:
BETSIE VALLEY SCHOOL (17936 CADILLAC HIGHWAY in THOMPSONVILLE, MI)
(National Center for Education Statistics) - STATE ID-05591 Organizations: BENZIE COUNTY CENTRAL SCHOOLS (SCHOOL DISTRICT)
MI DEPT/ENVIRONMENTAL QUALITY (7505 MICHIGAN in THOMPSONVILLE, MI)
(Resource Conservation and Recovery Act (tracking hazardous waste)) Organizations: MDEQ/THOMAS BALDWIN (CONTACT/OWNER)
Alternative names: MI DEPT/ENVIRONMENTAL QUALITY RRD
Housing units lacking complete plumbing facilities: 1.1% Housing units lacking complete kitchen facilities: 2.1%
64.4%Bottled, tank, or LP gas
12.7%Wood
12.2%Electricity
4.6%Other fuel
4.2%Utility gas
1.4%Fuel oil, kerosene, etc.
0.7%No fuel used
Population in 1990: 1,231. Population change in the 1990s: +563 (+45.7%).
Place of birth for U.S.-born residents:
This state: 1,629
Northeast: 28
Midwest: 185
South: 87
West: 23
57% of the 49683 zip code residents lived in the same house 5 years ago. Out of people who lived in different houses, 24% lived in this county. Out of people who lived in different counties, 50% lived in Michigan.
93% of the 49683 zip code residents lived in the same house 1 year ago. Out of people who lived in different houses, 21% moved from this county. Out of people who lived in different houses, 67% moved from different county within same state. Out of people who lived in different houses, 12% moved from different state.
Private vs. public school enrollment:
Students in private schools in grades 1 to 8 (elementary and middle school): 53
Here:
34.6%
Michigan:
12.4%
Students in private schools in grades 9 to 12 (high school): 9
Here:
11.6%
Michigan:
9.8%
Students in private undergraduate colleges: 5
Here:
9.4%
Michigan:
14.9%
Occupation by median earnings in the past 12 months ($)
73,821Architecture and engineering occupations
71,097Health diagnosing and treating practitioners and other technical occupations
62,547Arts, design, entertainment, sports, and media occupations
56,078Health technologists and technicians
56,056Business and financial operations occupations
55,451Management occupations
Top industries in this zip code by the number of employees in 2005:
Administrative and Support and Waste Management and Remediation Services: Professional Employer Organizations (500-999 employees: 1 establishment)
Accommodation and Food Services: Full-Service Restaurants (5-9: 1)
Administrative and Support and Waste Management and Remediation Services: Facilities Support Services (5-9: 1)
Accommodation and Food Services: Drinking Places (Alcoholic Beverages) (1-4: 2)
Construction: New Single-Family Housing Construction (except Operative Builders) (1-4: 2)
Other Services (except Public Administration): Religious Organizations (1-4: 1)
Construction: Residential Remodelers (1-4: 1)
Construction: Poured Concrete Foundation and Structure Contractors (1-4: 1)
Arts, Entertainment, and Recreation: Fitness and Recreational Sports Centers (1-4: 1)
Fatal accident statistics in 2014:
Fatal accident count: 1
Vehicles involved in fatal accidents: 1
Fatal accidents caused by drunken drivers: 0
Fatalities: 1
Persons involved in fatal accidents: 5
Pedestrians involved in fatal accidents: 0
Fatal accident statistics in 2013:
Fatal accident count: 2
Vehicles involved in fatal accidents: 3
Fatal accidents caused by drunken drivers: 0
Fatalities: 3
Persons involved in fatal accidents: 4
Pedestrians involved in fatal accidents: 1
2003 - 2018 National Fire Incident Reporting System (NFIRS) incidents
According to the data from the years 2003 - 2018 the average number of fires per year is 8. The highest number of reported fire incidents - 16 took place in 2009, and the least - 1 in 2014. The data has a growing trend.
When looking into fire subcategories, the most incidents belonged to: Structure Fires (53.2%), and Outside Fires (33.1%).
Fire incident types reported to NFIRS in Zip Code 49683


 Nearest zip codes: 49625, 49643, 49617, 49616, 49650, 49645.


 According to the data from the years 2003 - 2018 the average number of fires per year is 8. The highest number of reported fire incidents - 16 took place in 2009, and the least - 1 in 2014. The data has a growing trend.
 When looking into fire subcategories, the most incidents belonged to: Structure Fires (53.2%), and Outside Fires (33.1%).