Estimated zip code population in 2022: 2,219 Zip code population in 2010: 1,974 Zip code population in 2000: 2,105
Houses and condos: 1,122 Renter-occupied apartments: 104
% of renters here:
11%
State:
27%
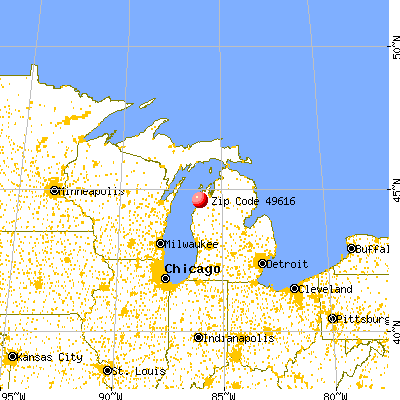
March 2022 cost of living index in zip code 49616: 83.1 (low, U.S. average is 100)
Land area: 36.9 sq. mi. Water area: 0.3 sq. mi.
Population density: 60 people per square mile
(very low).
OSM Map
General Map
Google Map
MSN Map
OSM Map
General Map
Google Map
MSN Map
OSM Map
General Map
Google Map
MSN Map
OSM Map
General Map
Google Map
MSN Map
Please wait while loading the map...
Real estate property taxes paid for housing units in 2022:
This zip code:
0.7% ($1,617)
Michigan:
1.2% ($2,746)
Median real estate property taxes paid for housing units with mortgages in 2022: $1,538 (0.7%) Median real estate property taxes paid for housing units with no mortgage in 2022: $1,690 (0.8%)
Business Search- 14 Million verified businesses
Males: 1,119
(50.4%)
Females: 1,099
(49.6%)
For population 25 years and over in 49616:
High school or higher: 93.2%
Bachelor's degree or higher: 25.4%
Graduate or professional degree: 8.6%
Unemployed: 3.8%
Mean travel time to work (commute): 19.7 minutes
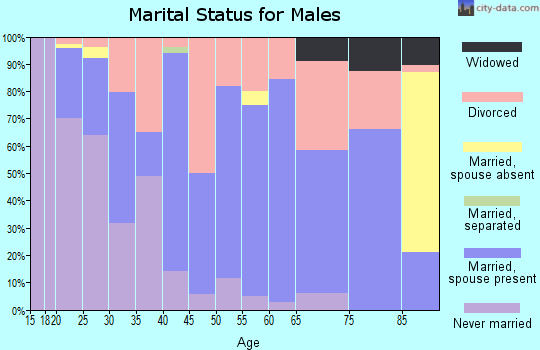
For population 15 years and over in 49616:
Never married: 27.5%
Now married: 49.4%
Separated: 0.6%
Widowed: 7.8%
Divorced: 14.7%
Zip code 49616 compared to state average:
Median household income below state average.
Black race population percentage significantly below state average.
Median age significantly above state average.
Foreign-born population percentage significantly below state average.
Renting percentage significantly below state average.
Length of stay since moving in significantly above state average.
Averages for the 2020 tax year for zip code 49616, filed in 2021:
Average Adjusted Gross Income (AGI) in 2020: $41,951 (Individual Income Tax Returns)
Here:
$41,951
State:
$68,945
Salary/wage: $34,898 (reported on 75.2% of returns)
Here:
$34,898
State:
$57,142
(% of AGI for various income ranges: 1076.4% for AGIs below $25k, 3197.6% for AGIs $25k-50k, 5642.7% for AGIs $50k-75k, 6075.0% for AGIs $75k-100k, 15048.0% for AGIs $100k-200k)
Taxable interest for individuals: $924 (reported on 29.2% of returns)
This zip code:
$924
Michigan:
$1,630
(% of AGI for various income ranges: 29.6% for AGIs below $25k, 15.2% for AGIs $25k-50k, 31.8% for AGIs $50k-75k, 111.7% for AGIs $75k-100k, 152.0% for AGIs $100k-200k)
Ordinary dividends: $3,328 (reported on 15.9% of returns)
Here:
$3,328
State:
$6,972
(% of AGI for various income ranges: 34.3% for AGIs below $25k, 9.3% for AGIs $25k-50k, 108.2% for AGIs $50k-75k, 380.0% for AGIs $75k-100k, 258.0% for AGIs $100k-200k)
Net capital gain/loss in AGI: +$4,517 (reported on 15.9% of returns)
Here:
+$4,517
State:
+$20,064
(% of AGI for various income ranges: 10.7% for AGIs below $25k, 50.0% for AGIs $25k-50k, 118.2% for AGIs $50k-75k, 126.7% for AGIs $75k-100k, 864.0% for AGIs $100k-200k)
Profit/loss from business: +$7,935 (reported on 15.0% of returns)
Here:
+$7,935
State:
+$11,172
(% of AGI for various income ranges: 106.8% for AGIs below $25k, 202.1% for AGIs $25k-50k, 256.4% for AGIs $50k-75k, 303.3% for AGIs $75k-100k)
Taxable individual retirement arrangement distribution: $14,230 (reported on 8.8% of returns)
49616:
$14,230
Michigan:
$19,803
(% of AGI for various income ranges: 157.1% for AGIs below $25k, 347.3% for AGIs $50k-75k, 1001.7% for AGIs $75k-100k)
Total itemized deductions: $26,133 (reported on 2.7% of returns)
Here:
$26,133
State:
$34,117
(% of AGI for various income ranges: 712.7% for AGIs $50k-75k)
Taxes paid: $5,233 (reported on 2.7% of returns)
49616:
$5,233
State:
$7,972
(% of AGI for various income ranges: 142.7% for AGIs $50k-75k)
Earned income credit: $2,221 (reported on 16.8% of returns)
Here:
$2,221
State:
$2,251
(% of AGI for various income ranges: 68.9% for AGIs below $25k, 79.0% for AGIs $25k-50k)
Percentage of individuals using paid preparers for their 2020 taxes: 93.8%
Here:
94%
State:
93%
(% for various income ranges: 90.9% for AGIs below $25k, 92.1% for AGIs $25k-50k, 100.0% for AGIs $50k-75k, 100.0% for AGIs $75k-100k, 100.0% for AGIs $100k-200k)
Averages for the 2012 tax year for zip code 49616, filed in 2013:
Average Adjusted Gross Income (AGI) in 2012: $32,213 (Individual Income Tax Returns)
Here:
$32,213
State:
$55,609
Salary/wage: $26,678 (reported on 77.0% of returns)
Here:
$26,678
State:
$46,782
(% of AGI for various income ranges: 66.9% for AGIs below $25k, 68.5% for AGIs $25k-50k, 65.6% for AGIs $50k-75k, 61.1% for AGIs $75k-100k, 52.2% for AGIs $100k-200k)
Taxable interest for individuals: $1,296 (reported on 28.0% of returns)
This zip code:
$1,296
Michigan:
$1,491
(% of AGI for various income ranges: 2.3% for AGIs below $25k, 1.4% for AGIs $25k-50k, 0.5% for AGIs $50k-75k, 0.5% for AGIs $75k-100k, 0.7% for AGIs $100k-200k)
Ordinary dividends: $2,850 (reported on 16.0% of returns)
Here:
$2,850
State:
$6,225
(% of AGI for various income ranges: 2.4% for AGIs below $25k, 1.1% for AGIs $25k-50k, 1.4% for AGIs $50k-75k, 2.3% for AGIs $75k-100k)
Net capital gain/loss in AGI: +$1,086 (reported on 14.0% of returns)
Here:
+$1,086
State:
+$9,326
(% of AGI for various income ranges: 0.3% for AGIs below $25k, 0.9% for AGIs $50k-75k, 1.4% for AGIs $75k-100k)
Profit/loss from business: +$7,687 (reported on 15.0% of returns)
Here:
+$7,687
State:
+$11,523
(% of AGI for various income ranges: 4.8% for AGIs below $25k, 4.6% for AGIs $25k-50k, 6.1% for AGIs $50k-75k)
Taxable individual retirement arrangement distribution: $7,990 (reported on 10.0% of returns)
49616:
$7,990
Michigan:
$15,298
(% of AGI for various income ranges: 2.7% for AGIs below $25k, 2.2% for AGIs $25k-50k, 6.0% for AGIs $50k-75k)
Total itemized deductions: $18,422 (29% of AGI, reported on 18.0% of returns)
Here:
$18,422
State:
$21,628
Here:
28.8% of AGI
State:
18.4% of AGI
(% of AGI for various income ranges: 8.5% for AGIs below $25k, 10.9% for AGIs $25k-50k, 11.3% for AGIs $50k-75k, 9.2% for AGIs $75k-100k, 10.9% for AGIs $100k-200k)
Charity contributions: $2,575 (reported on 12.0% of returns)
Here:
$2,575
State:
$4,225
(% of AGI for various income ranges: 0.8% for AGIs below $25k, 1.0% for AGIs $25k-50k, 1.0% for AGIs $50k-75k, 2.2% for AGIs $75k-100k)
Taxes paid: $4,350 (reported on 18.0% of returns)
49616:
$4,350
State:
$8,327
(% of AGI for various income ranges: 1.7% for AGIs below $25k, 1.7% for AGIs $25k-50k, 2.5% for AGIs $50k-75k, 2.6% for AGIs $75k-100k, 4.3% for AGIs $100k-200k)
Earned income credit: $1,975 (reported on 24.0% of returns)
Here:
$1,975
State:
$2,306
(% of AGI for various income ranges: 5.6% for AGIs below $25k, 1.4% for AGIs $25k-50k)
Percentage of individuals using paid preparers for their 2012 taxes: 59.0%
Here:
59%
State:
57%
(% for various income ranges: 52.7% for AGIs below $25k, 58.3% for AGIs $25k-50k, 75.0% for AGIs $50k-75k, 80.0% for AGIs $75k-100k, 75.0% for AGIs $100k-200k)
Averages for the 2004 tax year for zip code 49616, filed in 2005:
Average Adjusted Gross Income (AGI) in 2004: $30,964 (Individual Income Tax Returns)
Here:
$30,964
State:
$48,204
Salary/wage: $25,446 (reported on 82.2% of returns)
Here:
$25,446
State:
$42,791
(% of AGI for various income ranges: 96.4% for AGIs below $10k, 68.9% for AGIs $10k-25k, 74.3% for AGIs $25k-50k, 74.5% for AGIs $50k-75k, 71.4% for AGIs $75k-100k, 35.3% for AGIs over 100k)
Taxable interest for individuals: $1,379 (reported on 44.2% of returns)
This zip code:
$1,379
Michigan:
$1,725
(% of AGI for various income ranges: 9.6% for AGIs below $10k, 2.4% for AGIs $10k-25k, 1.9% for AGIs $25k-50k, 1.9% for AGIs $50k-75k, 1.1% for AGIs $75k-100k, 1.1% for AGIs over 100k)
Taxable dividends: $2,750 (reported on 18.5% of returns)
Here:
$2,750
State:
$3,420
(% of AGI for various income ranges: 7.6% for AGIs below $10k, 2.0% for AGIs $10k-25k, 1.2% for AGIs $25k-50k, 2.0% for AGIs $50k-75k, 0.8% for AGIs $75k-100k, 1.4% for AGIs over 100k)
Net capital gain/loss: +$5,929 (reported on 14.5% of returns)
Here:
+$5,929
State:
+$8,532
(% of AGI for various income ranges: -4.9% for AGIs below $10k, -1.0% for AGIs $10k-25k, 0.1% for AGIs $25k-50k, 0.3% for AGIs $50k-75k, 3.7% for AGIs $75k-100k, 15.7% for AGIs over 100k)
Profit/loss from business: +$3,694 (reported on 17.8% of returns)
Here:
+$3,694
State:
+$9,547
(% of AGI for various income ranges: 6.7% for AGIs below $10k, 5.1% for AGIs $10k-25k, 3.1% for AGIs $25k-50k, 1.2% for AGIs $50k-75k, -0.9% for AGIs $75k-100k)
IRA payment deduction: $2,656 (reported on 3.3% of returns)
49616:
$2,656
Michigan:
$2,875
Total itemized deductions: $14,948 (29% of AGI, reported on 23.8% of returns)
Here:
$14,948
State:
$18,509
Here:
28.7% of AGI
State:
20.7% of AGI
(% of AGI for various income ranges: 18.7% for AGIs below $10k, 9.0% for AGIs $10k-25k, 10.0% for AGIs $25k-50k, 13.0% for AGIs $50k-75k, 14.3% for AGIs $75k-100k, 11.5% for AGIs over 100k)
Charity contributions deductions: $2,151 (4% of AGI, reported on 17.1% of returns)
Here:
$2,151
State:
$3,365
Here:
3.8% of AGI
State:
3.6% of AGI
(% of AGI for various income ranges: 1.0% for AGIs $10k-25k, 1.1% for AGIs $25k-50k, 1.3% for AGIs $50k-75k, 1.6% for AGIs $75k-100k, 1.3% for AGIs over 100k)
Total tax: $3,373 (reported on 69.0% of returns)
49616:
$3,373
State:
$7,691
(% of AGI for various income ranges: 2.9% for AGIs below $10k, 3.9% for AGIs $10k-25k, 5.6% for AGIs $25k-50k, 8.3% for AGIs $50k-75k, 9.1% for AGIs $75k-100k, 13.7% for AGIs over 100k)
Earned income credit: $1,538 (reported on 20.0% of returns)
Here:
$1,538
State:
$1,737
Percentage of individuals using paid preparers for their 2004 taxes: 66.5%
Here:
66%
State:
60%
(% for various income ranges: 60.2% for AGIs below $10k, 65.7% for AGIs $10k-25k, 65.8% for AGIs $25k-50k, 73.7% for AGIs $50k-75k, 81.2% for AGIs $75k-100k, 83.3% for AGIs over 100k)
Likely homosexual households (counted as self-reported same-sex unmarried-partner households)
Lesbian couples: 0.3% of all households
Gay men: 1.1% of all households
Household received Food Stamps/SNAP in the past 12 months: 123 Household did not receive Food Stamps/SNAP in the past 12 months: 786
Women who had a birth in the past 12 months: 30 (31 now married, 0 unmarried) Women who did not have a birth in the past 12 months: 386 (182 now married, 203 unmarried)
Housing units in zip code 49616 with a mortgage: 387 (51 second mortgage, 47 both second mortgage and home equity loan) Houses without a mortgage: 11
Median monthly owner costs for units with a mortgage: $1,380 Median monthly owner costs for units without a mortgage: $512
Residents with income below the poverty level in 2022:
This zip code:
23.2%
Whole state:
13.4%
Residents with income below 50% of the poverty level in 2022:
This zip code:
20.5%
Whole state:
6.9%
Median number of rooms in houses and condos:
Here:
6.1
State:
6.5
Median number of rooms in apartments:
Here:
4.3
State:
4.3
Notable locations in this zip code not listed on our city pages
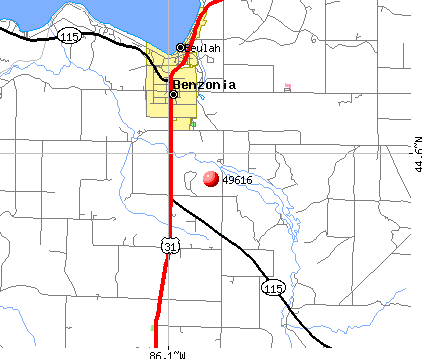
Notable locations in zip code 49616: Timberline Campground (A), Vacation Trailer Park Campground (B), Benzie Area Historical Museum (C), Benzonia Public Library (D), Joyfield Township Hall (E), Benzonia City Hall (F), Benzonia Township Fire Department (G). Display/hide their locations on the map
Churches in zip code 49616 include: First Congregational Church of Benzonia (A), Faith Baptist Church (B), Our Savior Lutheran Church (C), Union Chapel (D), Church of Christ (E). Display/hide their locations on the map
Parks in zip code 49616 include: Memorial Park (1), Benzonia Village Park (2), Benzonia Congregational Church Historical Marker (3), Bruce Cotton Historical Marker (4), Mills Community House Historical Marker (5), Benzonia College Historical Marker (6), Joyfield Cemetery Historical Marker (7). Display/hide their locations on the map
245 married couples with children.
66 single-parent households (26 men, 40 women).
99.7% of residents of 49616 zip code speak English at home.
0.3% of residents speak Spanish at home (83% very well, 17% well).
Foreign born population: 0 (0.0%)
:
0.0%
Whole state:
6.9%
21%English
15%German
14%American
4%Dutch
4%Polish
3%Greek
3%Irish
Year of entry for the foreign-born population
02010 or later
02000 to 2009
91990 to 1999
6Before 1990
Facilities with environmental interests located in this zip code:
BENZIE CENTRAL MIDDLE SCHOOL (9300 HOMESTEAD ROAD in BENZONIA, MI)
(National Center for Education Statistics) - STATE ID-06952 Organizations: BENZIE COUNTY CENTRAL SCHOOLS (SCHOOL DISTRICT)
BENZIE CENTRAL SR. HIGH SCHOOL (9300 HOMESTEAD ROAD in BENZONIA, MI)
(National Center for Education Statistics) - STATE ID-00287 Organizations: BENZIE COUNTY CENTRAL SCHOOLS (SCHOOL DISTRICT)
BENZONIA STANDARD INC (1011 MICHIGAN AVE in BENZONIA, MI)
(Resource Conservation and Recovery Act (tracking hazardous waste)) Organizations: WESTCOTT DALE AND SUSAN (CONTACT/OWNER)
DTE ENERGY/MICHCON (NORTHSIDE HOMESTEAD RD in BENZONIA, MI)
(Resource Conservation and Recovery Act (tracking hazardous waste)) Organizations: MICHIGAN CONSOLIDATED GAS CO (CONTACT/OWNER)
Alternative names: MICHCON BENZONIA GATE
FIELD CRAFTS (1058 MICHIGAN AVE in BENZONIA, MI)
(Resource Conservation and Recovery Act (tracking hazardous waste))
BENZIE COUNTY SCHOOL (9222 HOMESTEAD RD in BENZONIA, MI)
COMPLIANCE ACTIVITY (Tracking inspections of insecticide, fungicide, and rodenticide, and toxic substances) Alternative names: BENZIE COUNTY CENTRAL SCH
MI DEPT/TRANSPORTATION BRIDGE B01-10042 (M-115 OVER BETSIE RIVER in BENZONIA, MI)
Conditionally Exempt Small Quantity Generators, less than 100 kg/month of hazardous waste (Resource Conservation and Recovery Act (tracking hazardous waste)) Organizations: MICH DEPT OF TRANSPORTATION (CONTACT/OPERATOR)
FIELD CRAFTS INC (1034 MICHIGAN AVE in BENZONIA, MI)
Conditionally Exempt Small Quantity Generators, less than 100 kg/month of hazardous waste (Resource Conservation and Recovery Act (tracking hazardous waste)) Business NAICS classification: OTHER COMMERCIAL PRINTING. Organizations: JACK GYR (CONTACT/OPERATOR)
Housing units lacking complete plumbing facilities: 1.8% Housing units lacking complete kitchen facilities: 1.8%
43.1%Utility gas
36.7%Bottled, tank, or LP gas
11.7%Wood
5.4%Electricity
2.1%No fuel used
0.8%Solar energy
0.6%Fuel oil, kerosene, etc.
Population in 1990: 1,833. Population change in the 1990s: +272 (+14.8%).
Place of birth for U.S.-born residents:
This state: 1,717
Northeast: 73
Midwest: 204
South: 111
West: 100
59% of the 49616 zip code residents lived in the same house 5 years ago. Out of people who lived in different houses, 42% lived in this county. Out of people who lived in different counties, 50% lived in Michigan.
94% of the 49616 zip code residents lived in the same house 1 year ago. Out of people who lived in different houses, 35% moved from this county. Out of people who lived in different houses, 61% moved from different county within same state. Out of people who lived in different houses, 5% moved from different state.
Private vs. public school enrollment:
Students in private schools in grades 1 to 8 (elementary and middle school): 33
Here:
21.4%
Michigan:
12.4%
Students in private schools in grades 9 to 12 (high school): 8
Here:
10.4%
Michigan:
9.8%
Students in private undergraduate colleges: 12
Here:
28.4%
Michigan:
14.9%
Occupation by median earnings in the past 12 months ($)
104,198Business and financial operations occupations
74,112Health diagnosing and treating practitioners and other technical occupations
54,559Installation, maintenance, and repair occupations
54,308Education, training, and library occupations
39,624Sales and related occupations
33,744Office and administrative support occupations
Top industries in this zip code by the number of employees in 2005:
Administrative and Support and Waste Management and Remediation Services: Professional Employer Organizations (20-49: 1)
Accommodation and Food Services: Full-Service Restaurants (10-19: 2)
Health Care and Social Assistance: Homes for the Elderly (10-19: 1, 1-4: 1)
People in group quarters in 2010:
29 people in group homes intended for adults
5 people in correctional facilities intended for juveniles
2 people in workers' group living quarters and job corps centers
People in group quarters in 2000:
39 people in local jails and other confinement facilities (including police lockups)
26 people in unknown juvenile institutions
5 people in other group homes
Fatal accident statistics in 2014:
Fatal accident count: 1
Vehicles involved in fatal accidents: 1
Fatal accidents caused by drunken drivers: 0
Fatalities: 1
Persons involved in fatal accidents: 1
Pedestrians involved in fatal accidents: 1
Fatal accident statistics in 2012:
Fatal accident count: 1
Vehicles involved in fatal accidents: 3
Fatal accidents caused by drunken drivers: 0
Fatalities: 1
Persons involved in fatal accidents: 4
Pedestrians involved in fatal accidents: 0
2002 - 2018 National Fire Incident Reporting System (NFIRS) incidents
Based on the data from the years 2002 - 2018 the average number of fires per year is 9. The highest number of reported fire incidents - 17 took place in 2012, and the least - 3 in 2016. The data has a declining trend.
When looking into fire subcategories, the most incidents belonged to: Structure Fires (50.3%), and Outside Fires (35.2%).
Fire incident types reported to NFIRS in Zip Code 49616


 Nearest zip codes: 49617, 49635, 49613, 49640, 49614, 49628.


 Based on the data from the years 2002 - 2018 the average number of fires per year is 9. The highest number of reported fire incidents - 17 took place in 2012, and the least - 3 in 2016. The data has a declining trend.
 When looking into fire subcategories, the most incidents belonged to: Structure Fires (50.3%), and Outside Fires (35.2%).