Estimated zip code population in 2022: 2,682 Zip code population in 2010: 2,330 Zip code population in 2000: 2,465
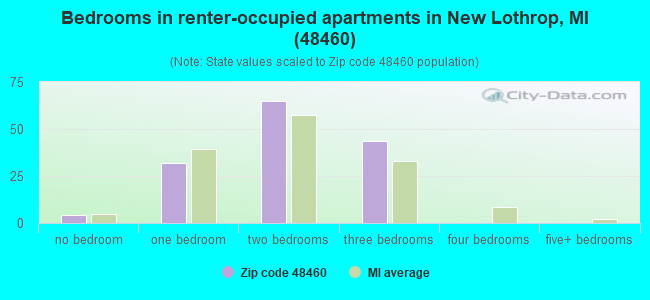
Houses and condos: 1,102 Renter-occupied apartments: 146
% of renters here:
13%
State:
27%
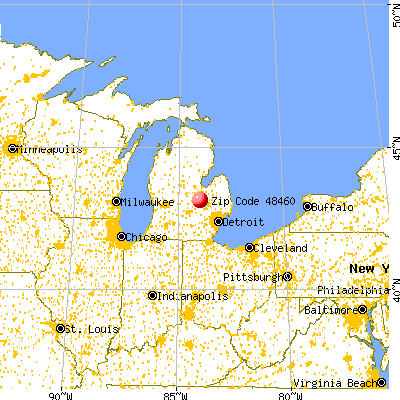
March 2022 cost of living index in zip code 48460: 80.3 (low, U.S. average is 100)
Land area: 33.7 sq. mi. Water area: 0.4 sq. mi.
Population density: 80 people per square mile
(very low).
OSM Map
General Map
Google Map
MSN Map
OSM Map
General Map
Google Map
MSN Map
OSM Map
General Map
Google Map
MSN Map
OSM Map
General Map
Google Map
MSN Map
Please wait while loading the map...
Real estate property taxes paid for housing units in 2022:
This zip code:
1.4% ($2,738)
Michigan:
1.2% ($2,746)
Median real estate property taxes paid for housing units with mortgages in 2022: $2,703 (1.4%) Median real estate property taxes paid for housing units with no mortgage in 2022: $2,802 (1.4%)
Estimated median house/condo value in 2022: $195,611
48460:
$195,611
Michigan:
$224,400
According to our research of Michigan and other state lists, there were 5 registered sex offenders living in 48460 zip code as of May 25, 2024. The ratio of all residents to sex offenders in zip code 48460 is 465 to 1. The ratio of registered sex offenders to all residents in this zip code is lower than the state average.
Median resident age:
This zip code:
41.7 years
Michigan median age:
40.3 years
Average household size:
This zip code:
2.5 people
Michigan:
2.4 people
Averages for the 2020 tax year for zip code 48460, filed in 2021:
Average Adjusted Gross Income (AGI) in 2020: $63,963 (Individual Income Tax Returns)
Here:
$63,963
State:
$68,945
Salary/wage: $57,024 (reported on 72.8% of returns)
Here:
$57,024
State:
$57,142
(% of AGI for various income ranges: 884.2% for AGIs below $25k, 2862.8% for AGIs $25k-50k, 4935.0% for AGIs $50k-75k, 8537.8% for AGIs $75k-100k, 12865.7% for AGIs $100k-200k)
Taxable interest for individuals: $1,129 (reported on 42.1% of returns)
This zip code:
$1,129
Michigan:
$1,630
(% of AGI for various income ranges: 29.6% for AGIs below $25k, 37.2% for AGIs $25k-50k, 122.1% for AGIs $50k-75k, 38.9% for AGIs $75k-100k, 115.7% for AGIs $100k-200k)
Ordinary dividends: $2,346 (reported on 21.1% of returns)
Here:
$2,346
State:
$6,972
(% of AGI for various income ranges: 31.7% for AGIs below $25k, 37.2% for AGIs $25k-50k, 62.9% for AGIs $50k-75k, 102.2% for AGIs $75k-100k, 171.4% for AGIs $100k-200k)
Net capital gain/loss in AGI: +$5,673 (reported on 19.3% of returns)
Here:
+$5,673
State:
+$20,064
(% of AGI for various income ranges: 5.8% for AGIs below $25k, 13.9% for AGIs $25k-50k, 36.4% for AGIs $50k-75k, 242.2% for AGIs $75k-100k, 671.4% for AGIs $100k-200k)
Profit/loss from business: +$5,439 (reported on 15.8% of returns)
Here:
+$5,439
State:
+$11,172
(% of AGI for various income ranges: 68.8% for AGIs below $25k, 127.8% for AGIs $25k-50k, 141.4% for AGIs $50k-75k, 83.3% for AGIs $75k-100k, 222.1% for AGIs $100k-200k)
Taxable individual retirement arrangement distribution: $11,646 (reported on 11.4% of returns)
48460:
$11,646
Michigan:
$19,803
(% of AGI for various income ranges: 75.8% for AGIs below $25k, 128.9% for AGIs $25k-50k, 345.0% for AGIs $50k-75k, 440.7% for AGIs $100k-200k)
Total itemized deductions: $28,075 (reported on 3.5% of returns)
Here:
$28,075
State:
$34,117
(% of AGI for various income ranges: 802.1% for AGIs $50k-75k)
Charity contributions: $5,625 (reported on 3.5% of returns)
Here:
$5,625
State:
$13,548
(% of AGI for various income ranges: 160.7% for AGIs $50k-75k)
Taxes paid: $7,000 (reported on 3.5% of returns)
48460:
$7,000
State:
$7,972
(% of AGI for various income ranges: 200.0% for AGIs $50k-75k)
Earned income credit: $2,100 (reported on 10.5% of returns)
Here:
$2,100
State:
$2,251
(% of AGI for various income ranges: 57.1% for AGIs below $25k, 63.9% for AGIs $25k-50k)
Percentage of individuals using paid preparers for their 2020 taxes: 94.7%
Here:
95%
State:
93%
(% for various income ranges: 92.1% for AGIs below $25k, 95.8% for AGIs $25k-50k, 94.4% for AGIs $50k-75k, 92.3% for AGIs $75k-100k, 100.0% for AGIs $100k-200k, 100.0% for AGIs over 200k)
Averages for the 2012 tax year for zip code 48460, filed in 2013:
Average Adjusted Gross Income (AGI) in 2012: $47,147 (Individual Income Tax Returns)
Here:
$47,147
State:
$55,609
Salary/wage: $40,110 (reported on 81.0% of returns)
Here:
$40,110
State:
$46,782
(% of AGI for various income ranges: 62.5% for AGIs below $25k, 58.7% for AGIs $25k-50k, 65.7% for AGIs $50k-75k, 71.9% for AGIs $75k-100k, 76.5% for AGIs $100k-200k)
Taxable interest for individuals: $1,098 (reported on 41.4% of returns)
This zip code:
$1,098
Michigan:
$1,491
(% of AGI for various income ranges: 2.1% for AGIs below $25k, 1.5% for AGIs $25k-50k, 1.6% for AGIs $50k-75k, 0.4% for AGIs $75k-100k, 0.3% for AGIs $100k-200k)
Ordinary dividends: $2,728 (reported on 21.6% of returns)
Here:
$2,728
State:
$6,225
(% of AGI for various income ranges: 1.6% for AGIs below $25k, 1.1% for AGIs $25k-50k, 2.1% for AGIs $50k-75k, 0.7% for AGIs $75k-100k, 1.0% for AGIs $100k-200k)
Net capital gain/loss in AGI: +$1,786 (reported on 19.0% of returns)
Here:
+$1,786
State:
+$9,326
(% of AGI for various income ranges: 0.1% for AGIs $25k-50k, 0.4% for AGIs $50k-75k, 2.0% for AGIs $100k-200k)
Profit/loss from business: +$2,362 (reported on 13.8% of returns)
Here:
+$2,362
State:
+$11,523
(% of AGI for various income ranges: 3.6% for AGIs below $25k, 0.8% for AGIs $25k-50k, 0.7% for AGIs $50k-75k, 0.4% for AGIs $75k-100k)
Taxable individual retirement arrangement distribution: $7,567 (reported on 12.9% of returns)
48460:
$7,567
Michigan:
$15,298
(% of AGI for various income ranges: 2.8% for AGIs below $25k, 3.2% for AGIs $25k-50k, 2.4% for AGIs $50k-75k, 4.1% for AGIs $75k-100k)
Total itemized deductions: $18,079 (21% of AGI, reported on 24.1% of returns)
Here:
$18,079
State:
$21,628
Here:
20.5% of AGI
State:
18.4% of AGI
(% of AGI for various income ranges: 8.9% for AGIs below $25k, 7.6% for AGIs $25k-50k, 8.0% for AGIs $50k-75k, 7.3% for AGIs $75k-100k, 12.0% for AGIs $100k-200k)
Charity contributions: $3,139 (reported on 19.8% of returns)
Here:
$3,139
State:
$4,225
(% of AGI for various income ranges: 1.6% for AGIs $25k-50k, 1.2% for AGIs $50k-75k, 0.9% for AGIs $75k-100k, 1.8% for AGIs $100k-200k)
Taxes paid: $6,561 (reported on 24.1% of returns)
48460:
$6,561
State:
$8,327
(% of AGI for various income ranges: 1.0% for AGIs below $25k, 2.1% for AGIs $25k-50k, 2.4% for AGIs $50k-75k, 2.7% for AGIs $75k-100k, 5.6% for AGIs $100k-200k)
Earned income credit: $2,350 (reported on 10.3% of returns)
Here:
$2,350
State:
$2,306
(% of AGI for various income ranges: 4.0% for AGIs below $25k, 0.8% for AGIs $25k-50k)
Percentage of individuals using paid preparers for their 2012 taxes: 69.8%
Here:
70%
State:
57%
(% for various income ranges: 64.4% for AGIs below $25k, 71.4% for AGIs $25k-50k, 77.8% for AGIs $50k-75k, 75.0% for AGIs $75k-100k, 69.2% for AGIs $100k-200k)
Averages for the 2004 tax year for zip code 48460, filed in 2005:
Average Adjusted Gross Income (AGI) in 2004: $41,899 (Individual Income Tax Returns)
Here:
$41,899
State:
$48,204
Salary/wage: $37,962 (reported on 87.0% of returns)
Here:
$37,962
State:
$42,791
(% of AGI for various income ranges: 109.0% for AGIs below $10k, 61.2% for AGIs $10k-25k, 68.3% for AGIs $25k-50k, 81.9% for AGIs $50k-75k, 94.2% for AGIs $75k-100k, 75.5% for AGIs over 100k)
Taxable interest for individuals: $1,004 (reported on 56.7% of returns)
This zip code:
$1,004
Michigan:
$1,725
(% of AGI for various income ranges: 4.3% for AGIs below $10k, 4.2% for AGIs $10k-25k, 2.2% for AGIs $25k-50k, 1.2% for AGIs $50k-75k, 0.4% for AGIs $75k-100k, 0.5% for AGIs over 100k)
Taxable dividends: $1,184 (reported on 27.8% of returns)
Here:
$1,184
State:
$3,420
(% of AGI for various income ranges: 1.7% for AGIs below $10k, 1.4% for AGIs $10k-25k, 0.9% for AGIs $25k-50k, 1.0% for AGIs $50k-75k, 0.1% for AGIs $75k-100k, 0.7% for AGIs over 100k)
Net capital gain/loss: +$1,917 (reported on 21.2% of returns)
Here:
+$1,917
State:
+$8,532
(% of AGI for various income ranges: -0.4% for AGIs below $10k, 1.2% for AGIs $10k-25k, 0.9% for AGIs $25k-50k, 1.2% for AGIs $50k-75k, 0.1% for AGIs $75k-100k, 1.6% for AGIs over 100k)
Profit/loss from business: +$1,459 (reported on 12.4% of returns)
Here:
+$1,459
State:
+$9,547
(% of AGI for various income ranges: -0.8% for AGIs below $10k, 4.6% for AGIs $10k-25k, 1.2% for AGIs $25k-50k, -0.5% for AGIs $50k-75k, -0.2% for AGIs $75k-100k, -0.1% for AGIs over 100k)
IRA payment deduction: $3,222 (reported on 1.5% of returns)
48460:
$3,222
Michigan:
$2,875
Total itemized deductions: $15,820 (20% of AGI, reported on 29.7% of returns)
Here:
$15,820
State:
$18,509
Here:
20.0% of AGI
State:
20.7% of AGI
(% of AGI for various income ranges: 10.4% for AGIs $10k-25k, 9.9% for AGIs $25k-50k, 10.7% for AGIs $50k-75k, 11.7% for AGIs $75k-100k, 13.3% for AGIs over 100k)
Charity contributions deductions: $2,371 (3% of AGI, reported on 26.9% of returns)
Here:
$2,371
State:
$3,365
Here:
2.9% of AGI
State:
3.6% of AGI
(% of AGI for various income ranges: 0.8% for AGIs $10k-25k, 1.2% for AGIs $25k-50k, 1.5% for AGIs $50k-75k, 2.0% for AGIs $75k-100k, 1.7% for AGIs over 100k)
Total tax: $5,149 (reported on 79.5% of returns)
48460:
$5,149
State:
$7,691
(% of AGI for various income ranges: 3.0% for AGIs below $10k, 4.2% for AGIs $10k-25k, 6.8% for AGIs $25k-50k, 8.2% for AGIs $50k-75k, 9.3% for AGIs $75k-100k, 15.8% for AGIs over 100k)
Earned income credit: $1,364 (reported on 8.3% of returns)
Here:
$1,364
State:
$1,737
Percentage of individuals using paid preparers for their 2004 taxes: 67.7%
Here:
68%
State:
60%
(% for various income ranges: 60.7% for AGIs below $10k, 66.3% for AGIs $10k-25k, 72.4% for AGIs $25k-50k, 70.8% for AGIs $50k-75k, 73.8% for AGIs $75k-100k, 65.6% for AGIs over 100k)
Household received Food Stamps/SNAP in the past 12 months: 56 Household did not receive Food Stamps/SNAP in the past 12 months: 1,026
Women who had a birth in the past 12 months: 17 (17 now married, 0 unmarried) Women who did not have a birth in the past 12 months: 471 (223 now married, 247 unmarried)
Housing units in zip code 48460 with a mortgage: 505 (18 second mortgage, 15 both second mortgage and home equity loan) Houses without a mortgage: 8
Median monthly owner costs for units with a mortgage: $1,198 Median monthly owner costs for units without a mortgage: $607
Residents with income below the poverty level in 2022:
This zip code:
8.6%
Whole state:
13.4%
Residents with income below 50% of the poverty level in 2022:
This zip code:
2.0%
Whole state:
6.9%
Median number of rooms in houses and condos:
Here:
6.7
State:
6.5
Median number of rooms in apartments:
Here:
4.3
State:
4.3
Notable locations in this zip code not listed on our city pages
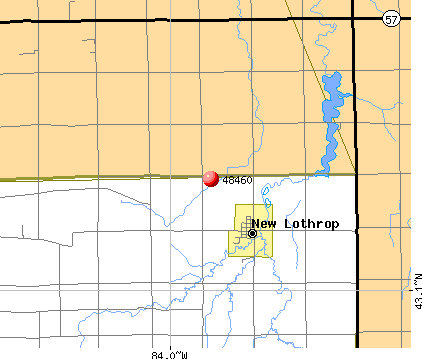
Notable locations in zip code 48460: Twin Township Library (A), New Lothrop Police Department (B), Hazelton - New Lothrop Township Fire Department (C), Twin Township Ambulance (D). Display/hide their locations on the map
Churches in zip code 48460 include: First United Methodist Church (A), New Lothrop Church of the Nazarene (B), Saint Michael Church (C). Display/hide their locations on the map
Cemeteries: Hazelton Cemetery (1), Vietz Cemetery (2), North Ridge Cemetery (3), Saint Michaels Cemetery (4), Maple Grove Cemetery (5). Display/hide their locations on the map
Parks in zip code 48460 include: Saint Michael Catholic Parish Historical Marker (1), Methodist Episcopal Church Historical Marker (2). Display/hide their locations on the map
Size of family households: 348 2-persons, 151 3-persons, 197 4-persons, 26 5-persons, 6 6-persons, 24 7-or-more-persons
Size of nonfamily households: 303 1-person, 25 2-persons, 3 4-persons
380 married couples with children.
184 single-parent households (19 men, 165 women).
99.6% of residents of 48460 zip code speak English at home.
0.1% of residents speak other Indo-European language at home (100% very well).
0.1% of residents speak other language at home (100% very well).
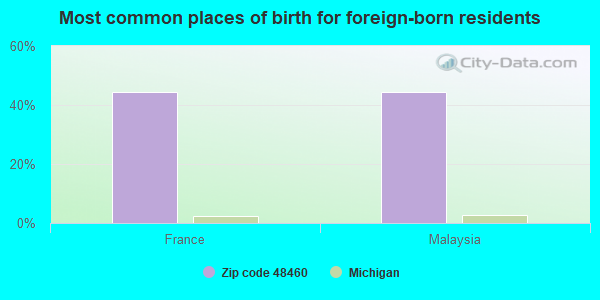
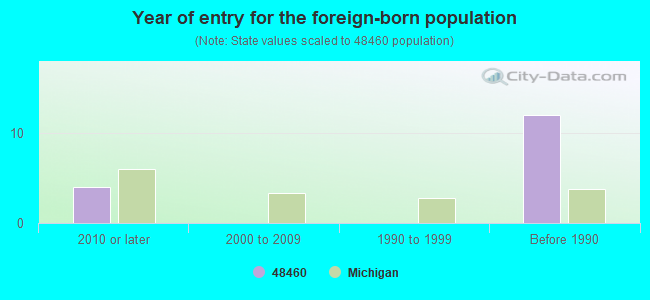
Foreign born population: 9 (0.3%) (100.0% of them are naturalized citizens)
This zip code:
0.3%
Whole state:
6.9%
44%France
44%Malaysia
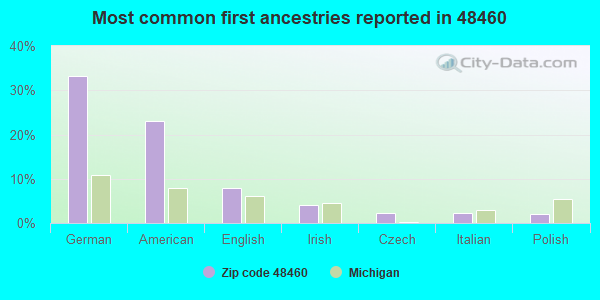
33%German
23%American
8%English
4%Irish
2%Czech
2%Italian
2%Polish
Year of entry for the foreign-born population
42010 or later
02000 to 2009
01990 to 1999
12Before 1990
Facilities with environmental interests located in this zip code:
BORDEN CHEMICAL SMITH-DOUGLASS DIV (1005 GENESEE ST in NEW LOTHROP, MI)
(Resource Conservation and Recovery Act (tracking hazardous waste)) Organizations: SMITH DOUGLASS DIVISION (CONTACT/OPERATOR)
, BORDEN CHEMICALS (CONTACT/OWNER)
BIRCHMEIER ED MECHANICAL (9472 GENESEE ST in NEW LOTHROP, MI)
Conditionally Exempt Small Quantity Generators, less than 100 kg/month of hazardous waste (Resource Conservation and Recovery Act (tracking hazardous waste)) - notification Organizations: BIRCHMEIER MIKE (CONTACT/OWNER)
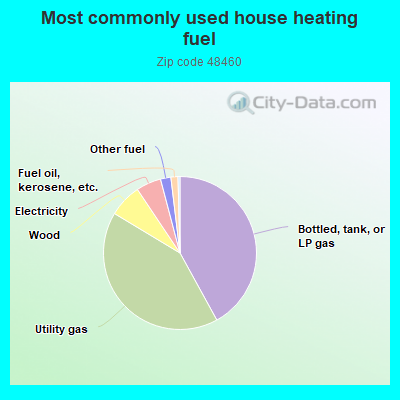
42.1%Bottled, tank, or LP gas
41.7%Utility gas
7.0%Wood
5.3%Electricity
2.2%Other fuel
1.5%Fuel oil, kerosene, etc.
Population in 1990: 3,206.
Place of birth for U.S.-born residents:
This state: 2,414
Northeast: 13
Midwest: 91
South: 101
West: 37
75% of the 48460 zip code residents lived in the same house 5 years ago. Out of people who lived in different houses, 34% lived in this county. Out of people who lived in different counties, 50% lived in Michigan.
98% of the 48460 zip code residents lived in the same house 1 year ago. Out of people who lived in different houses, 18% moved from this county. Out of people who lived in different houses, 84% moved from different county within same state. Out of people who lived in different houses, 11% moved from abroad.
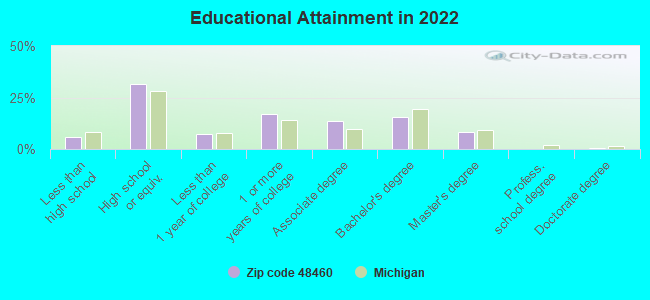
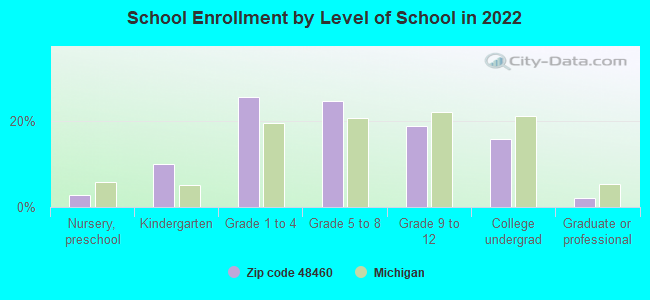
Private vs. public school enrollment:
Students in private schools in grades 1 to 8 (elementary and middle school): 20
Here:
6.2%
Michigan:
12.4%
Students in private schools in grades 9 to 12 (high school): 3
Here:
2.5%
Michigan:
9.8%
Students in private undergraduate colleges: 15
Here:
14.6%
Michigan:
14.9%
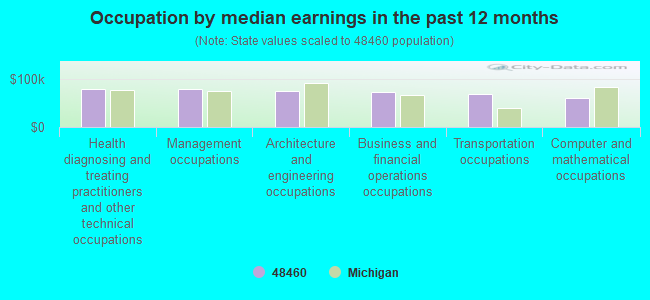
Occupation by median earnings in the past 12 months ($)
80,727Health diagnosing and treating practitioners and other technical occupations
80,105Management occupations
75,670Architecture and engineering occupations
73,559Business and financial operations occupations
69,591Transportation occupations
60,182Computer and mathematical occupations
Top industries in this zip code by the number of employees in 2005:
Other Services (except Public Administration): Religious Organizations (20-49 employees: 1 establishment, 1-4 employees: 3 establishments)
Accommodation and Food Services: Full-Service Restaurants (20-49: 1)
Construction: Water and Sewer Line and Related Structures Construction (10-19: 1)
Construction: Plumbing, Heating, and Air-Conditioning Contractors (10-19: 1)
Health Care and Social Assistance: Ambulance Services (5-9: 1)
Accommodation and Food Services: Drinking Places (Alcoholic Beverages) (5-9: 1)
Construction: Site Preparation Contractors (5-9: 1)
People in group quarters in 2000:
5 people in other group homes
Fatal accident statistics in 2012:
Fatal accident count: 1
Vehicles involved in fatal accidents: 2
Fatal accidents caused by drunken drivers: 0
Fatalities: 1
Persons involved in fatal accidents: 1
Pedestrians involved in fatal accidents: 0
Fatal accident statistics in 2010:
Fatal accident count: 1
Vehicles involved in fatal accidents: 1
Fatal accidents caused by drunken drivers: 0
Fatalities: 1
Persons involved in fatal accidents: 1
Pedestrians involved in fatal accidents: 1
Home Mortgage Disclosure Act Aggregated Statistics For Year 2009 (Based on 2 partial tracts)
A) FHA, FSA/RHS & VA Home Purchase Loans
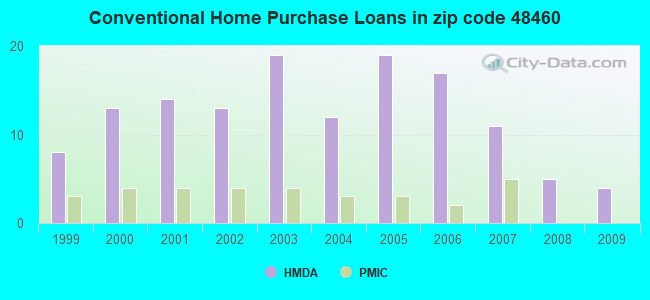
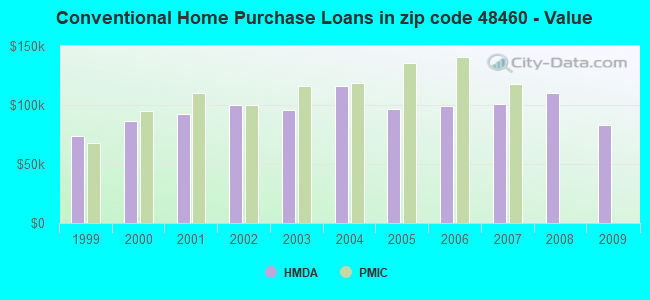
B) Conventional Home Purchase Loans
C) Refinancings
D) Home Improvement Loans
F) Non-occupant Loans on < 5 Family Dwellings (A B C & D)
G) Loans On Manufactured Home Dwelling (A B C & D)
Number
Average Value
Number
Average Value
Number
Average Value
Number
Average Value
Number
Average Value
Number
Average Value
LOANS ORIGINATED
4
$88,835
4
$82,998
30
$102,969
2
$46,510
1
$56,820
1
$28,020
APPLICATIONS APPROVED, NOT ACCEPTED
0
$0
0
$0
2
$80,370
0
$0
0
$0
0
$0
APPLICATIONS DENIED
2
$118,900
3
$73,690
8
$130,090
3
$35,677
0
$0
0
$0
APPLICATIONS WITHDRAWN
1
$89,130
0
$0
6
$132,587
1
$26,080
0
$0
1
$60,330
FILES CLOSED FOR INCOMPLETENESS
0
$0
0
$0
1
$77,060
0
$0
0
$0
0
$0
Aggregated Statistics For Year 2008 (Based on 2 partial tracts)
A) FHA, FSA/RHS & VA Home Purchase Loans
B) Conventional Home Purchase Loans
C) Refinancings
D) Home Improvement Loans
F) Non-occupant Loans on < 5 Family Dwellings (A B C & D)
G) Loans On Manufactured Home Dwelling (A B C & D)
Number
Average Value
Number
Average Value
Number
Average Value
Number
Average Value
Number
Average Value
Number
Average Value
LOANS ORIGINATED
5
$107,498
5
$110,532
23
$97,825
6
$28,087
2
$49,820
2
$91,075
APPLICATIONS APPROVED, NOT ACCEPTED
1
$95,350
1
$50,210
5
$75,972
0
$0
0
$0
0
$0
APPLICATIONS DENIED
2
$103,140
1
$47,480
19
$116,023
3
$62,143
1
$59,550
5
$85,156
APPLICATIONS WITHDRAWN
0
$0
2
$121,625
5
$130,304
0
$0
1
$70,060
1
$61,490
FILES CLOSED FOR INCOMPLETENESS
0
$0
0
$0
1
$111,310
0
$0
0
$0
0
$0
Aggregated Statistics For Year 2007 (Based on 2 partial tracts)
A) FHA, FSA/RHS & VA Home Purchase Loans
B) Conventional Home Purchase Loans
C) Refinancings
D) Home Improvement Loans
F) Non-occupant Loans on < 5 Family Dwellings (A B C & D)
G) Loans On Manufactured Home Dwelling (A B C & D)
Number
Average Value
Number
Average Value
Number
Average Value
Number
Average Value
Number
Average Value
Number
Average Value
LOANS ORIGINATED
1
$145,170
11
$100,909
33
$97,996
7
$26,577
1
$51,760
3
$49,947
APPLICATIONS APPROVED, NOT ACCEPTED
0
$0
4
$99,245
6
$115,592
1
$42,810
1
$35,030
2
$57,210
APPLICATIONS DENIED
0
$0
8
$53,078
30
$98,922
6
$45,797
1
$48,260
3
$59,677
APPLICATIONS WITHDRAWN
0
$0
4
$77,352
15
$105,214
0
$0
1
$41,640
0
$0
FILES CLOSED FOR INCOMPLETENESS
0
$0
0
$0
2
$143,810
0
$0
0
$0
0
$0
Aggregated Statistics For Year 2006 (Based on 2 partial tracts)
A) FHA, FSA/RHS & VA Home Purchase Loans
B) Conventional Home Purchase Loans
C) Refinancings
D) Home Improvement Loans
F) Non-occupant Loans on < 5 Family Dwellings (A B C & D)
G) Loans On Manufactured Home Dwelling (A B C & D)
Number
Average Value
Number
Average Value
Number
Average Value
Number
Average Value
Number
Average Value
Number
Average Value
LOANS ORIGINATED
3
$110,013
17
$98,742
38
$88,604
10
$29,424
2
$116,760
3
$62,143
APPLICATIONS APPROVED, NOT ACCEPTED
1
$125,320
2
$54,490
7
$102,804
2
$29,970
0
$0
1
$91,460
APPLICATIONS DENIED
1
$125,710
5
$64,296
30
$98,247
7
$22,296
2
$27,440
5
$59,704
APPLICATIONS WITHDRAWN
0
$0
1
$100,800
28
$108,684
1
$84,850
1
$58,380
1
$44,370
FILES CLOSED FOR INCOMPLETENESS
0
$0
0
$0
4
$140,988
0
$0
0
$0
0
$0
Aggregated Statistics For Year 2005 (Based on 2 partial tracts)
A) FHA, FSA/RHS & VA Home Purchase Loans
B) Conventional Home Purchase Loans
C) Refinancings
D) Home Improvement Loans
F) Non-occupant Loans on < 5 Family Dwellings (A B C & D)
G) Loans On Manufactured Home Dwelling (A B C & D)
Number
Average Value
Number
Average Value
Number
Average Value
Number
Average Value
Number
Average Value
Number
Average Value
LOANS ORIGINATED
4
$114,522
19
$97,013
45
$101,417
10
$45,731
2
$94,965
5
$95,898
APPLICATIONS APPROVED, NOT ACCEPTED
0
$0
2
$111,115
14
$104,056
2
$13,620
1
$76,670
2
$76,285
APPLICATIONS DENIED
0
$0
7
$66,999
47
$108,612
7
$30,136
2
$59,740
4
$65,482
APPLICATIONS WITHDRAWN
0
$0
2
$74,725
21
$102,156
1
$161,910
1
$56,040
0
$0
FILES CLOSED FOR INCOMPLETENESS
0
$0
0
$0
9
$111,873
0
$0
0
$0
2
$49,430
Aggregated Statistics For Year 2004 (Based on 2 partial tracts)
A) FHA, FSA/RHS & VA Home Purchase Loans
B) Conventional Home Purchase Loans
C) Refinancings
D) Home Improvement Loans
F) Non-occupant Loans on < 5 Family Dwellings (A B C & D)
G) Loans On Manufactured Home Dwelling (A B C & D)
Number
Average Value
Number
Average Value
Number
Average Value
Number
Average Value
Number
Average Value
Number
Average Value
LOANS ORIGINATED
4
$109,950
12
$116,338
61
$106,698
9
$45,190
1
$38,530
6
$69,992
APPLICATIONS APPROVED, NOT ACCEPTED
0
$0
2
$128,825
7
$85,124
2
$30,940
1
$135,440
1
$74,340
APPLICATIONS DENIED
0
$0
2
$37,945
40
$94,897
5
$32,770
2
$35,030
5
$57,524
APPLICATIONS WITHDRAWN
0
$0
0
$0
12
$133,268
2
$47,095
0
$0
1
$54,490
FILES CLOSED FOR INCOMPLETENESS
0
$0
2
$67,720
4
$108,878
0
$0
0
$0
1
$61,100
Aggregated Statistics For Year 2003 (Based on 2 partial tracts)
A) FHA, FSA/RHS & VA Home Purchase Loans
B) Conventional Home Purchase Loans
C) Refinancings
D) Home Improvement Loans
F) Non-occupant Loans on < 5 Family Dwellings (A B C & D)
Number
Average Value
Number
Average Value
Number
Average Value
Number
Average Value
Number
Average Value
LOANS ORIGINATED
1
$117,150
19
$95,518
126
$93,495
6
$20,822
3
$81,863
APPLICATIONS APPROVED, NOT ACCEPTED
1
$142,060
2
$92,045
12
$88,413
0
$0
0
$0
APPLICATIONS DENIED
0
$0
5
$65,620
42
$91,666
3
$36,327
1
$88,740
APPLICATIONS WITHDRAWN
0
$0
2
$67,720
14
$96,521
0
$0
0
$0
FILES CLOSED FOR INCOMPLETENESS
1
$109,750
0
$0
2
$81,345
0
$0
0
$0
Aggregated Statistics For Year 2002 (Based on 2 partial tracts)
A) FHA, FSA/RHS & VA Home Purchase Loans
B) Conventional Home Purchase Loans
C) Refinancings
D) Home Improvement Loans
F) Non-occupant Loans on < 5 Family Dwellings (A B C & D)
Number
Average Value
Number
Average Value
Number
Average Value
Number
Average Value
Number
Average Value
LOANS ORIGINATED
2
$91,655
13
$99,695
91
$92,420
4
$22,185
3
$99,637
APPLICATIONS APPROVED, NOT ACCEPTED
0
$0
2
$75,310
11
$100,838
0
$0
0
$0
APPLICATIONS DENIED
0
$0
4
$45,245
29
$77,008
2
$21,210
1
$34,250
APPLICATIONS WITHDRAWN
0
$0
1
$55,270
22
$86,296
0
$0
1
$26,470
FILES CLOSED FOR INCOMPLETENESS
0
$0
0
$0
7
$73,391
1
$5,840
0
$0
Aggregated Statistics For Year 2001 (Based on 2 partial tracts)
A) FHA, FSA/RHS & VA Home Purchase Loans
B) Conventional Home Purchase Loans
C) Refinancings
D) Home Improvement Loans
F) Non-occupant Loans on < 5 Family Dwellings (A B C & D)
Number
Average Value
Number
Average Value
Number
Average Value
Number
Average Value
Number
Average Value
LOANS ORIGINATED
3
$71,223
14
$92,379
81
$89,021
12
$25,395
2
$80,955
APPLICATIONS APPROVED, NOT ACCEPTED
0
$0
2
$119,290
9
$74,467
2
$17,905
0
$0
APPLICATIONS DENIED
0
$0
6
$69,342
35
$75,772
7
$28,134
1
$37,360
APPLICATIONS WITHDRAWN
0
$0
1
$39,700
22
$81,644
0
$0
0
$0
FILES CLOSED FOR INCOMPLETENESS
0
$0
0
$0
4
$101,678
0
$0
0
$0
Aggregated Statistics For Year 2000 (Based on 2 partial tracts)
A) FHA, FSA/RHS & VA Home Purchase Loans
B) Conventional Home Purchase Loans
C) Refinancings
D) Home Improvement Loans
F) Non-occupant Loans on < 5 Family Dwellings (A B C & D)
Number
Average Value
Number
Average Value
Number
Average Value
Number
Average Value
Number
Average Value
LOANS ORIGINATED
2
$99,440
13
$86,702
35
$64,596
10
$14,945
1
$97,300
APPLICATIONS APPROVED, NOT ACCEPTED
0
$0
2
$83,095
10
$75,155
5
$26,776
0
$0
APPLICATIONS DENIED
0
$0
5
$50,206
17
$70,514
9
$24,822
0
$0
APPLICATIONS WITHDRAWN
1
$58,770
4
$77,352
11
$63,616
1
$35,810
1
$23,740
FILES CLOSED FOR INCOMPLETENESS
0
$0
1
$76,670
4
$78,328
0
$0
0
$0
Aggregated Statistics For Year 1999 (Based on 1 partial tract)
A) FHA, FSA/RHS & VA Home Purchase Loans
B) Conventional Home Purchase Loans
C) Refinancings
D) Home Improvement Loans
F) Non-occupant Loans on < 5 Family Dwellings (A B C & D)
Detailed PMIC statistics for the following Tracts:0129.00
2002 - 2018 National Fire Incident Reporting System (NFIRS) incidents
Based on the data from the years 2002 - 2018 the average number of fire incidents per year is 6. The highest number of fires - 25 took place in 2016, and the least - 0 in 2006. The data has a growing trend.
When looking into fire subcategories, the most reports belonged to: Structure Fires (54.1%), and Outside Fires (31.2%).
Fire incident types reported to NFIRS in Zip Code 48460


 Nearest zip codes: 48457, 48433, 48817, 48417, 48616, 48449.


 Based on the data from the years 2002 - 2018 the average number of fire incidents per year is 6. The highest number of fires - 25 took place in 2016, and the least - 0 in 2006. The data has a growing trend.
 When looking into fire subcategories, the most reports belonged to: Structure Fires (54.1%), and Outside Fires (31.2%).