Estimated zip code population in 2022: 8,854 Zip code population in 2010: 8,436 Zip code population in 2000: 8,416
Houses and condos: 3,622 Renter-occupied apartments: 595
% of renters here:
17%
State:
27%
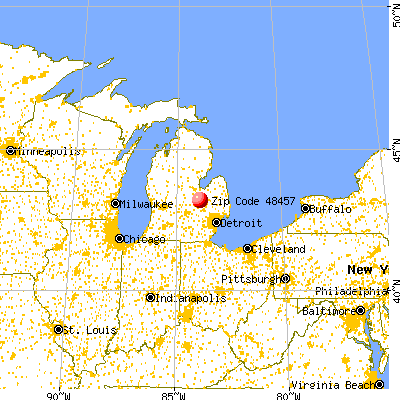
March 2022 cost of living index in zip code 48457: 81.0 (low, U.S. average is 100)
Land area: 43.9 sq. mi. Water area: 0.9 sq. mi.
Population density: 202 people per square mile
(very low).
OSM Map
General Map
Google Map
MSN Map
OSM Map
General Map
Google Map
MSN Map
OSM Map
General Map
Google Map
MSN Map
OSM Map
General Map
Google Map
MSN Map
Please wait while loading the map...
Real estate property taxes paid for housing units in 2022:
This zip code:
1.4% ($2,390)
Michigan:
1.2% ($2,746)
Median real estate property taxes paid for housing units with mortgages in 2022: $2,551 (1.5%) Median real estate property taxes paid for housing units with no mortgage in 2022: $2,191 (1.4%)
Business Search- 14 Million verified businesses
Males: 4,837
(54.6%)
Females: 4,016
(45.4%)
For population 25 years and over in 48457:
High school or higher: 86.9%
Bachelor's degree or higher: 12.4%
Graduate or professional degree: 3.6%
Unemployed: 4.0%
Mean travel time to work (commute): 27.3 minutes
For population 15 years and over in 48457:
Never married: 32.6%
Now married: 49.8%
Separated: 1.5%
Widowed: 4.7%
Divorced: 11.5%
Zip code 48457 compared to state average:
Black race population percentage significantly below state average.
Hispanic race population percentage below state average.
Foreign-born population percentage significantly below state average.
Renting percentage below state average.
Length of stay since moving in significantly above state average.
Number of college students below state average.
Percentage of population with a bachelor's degree or higher significantly below state average.
Estimated median house/condo value in 2022: $167,491
48457:
$167,491
Michigan:
$224,400
According to our research of Michigan and other state lists, there were 23 registered sex offenders living in 48457 zip code as of May 24, 2024. The ratio of all residents to sex offenders in zip code 48457 is 365 to 1. The ratio of registered sex offenders to all residents in this zip code is near the state average.
Median resident age:
This zip code:
42.2 years
Michigan median age:
40.3 years
Average household size:
This zip code:
2.6 people
Michigan:
2.4 people
Averages for the 2020 tax year for zip code 48457, filed in 2021:
Average Adjusted Gross Income (AGI) in 2020: $47,895 (Individual Income Tax Returns)
Here:
$47,895
State:
$68,945
Salary/wage: $43,077 (reported on 75.3% of returns)
Here:
$43,077
State:
$57,142
(% of AGI for various income ranges: 907.8% for AGIs below $25k, 2899.4% for AGIs $25k-50k, 5730.5% for AGIs $50k-75k, 8652.7% for AGIs $75k-100k, 13595.2% for AGIs $100k-200k)
Taxable interest for individuals: $740 (reported on 29.5% of returns)
This zip code:
$740
Michigan:
$1,630
(% of AGI for various income ranges: 14.2% for AGIs below $25k, 22.4% for AGIs $25k-50k, 25.7% for AGIs $50k-75k, 21.0% for AGIs $75k-100k, 86.7% for AGIs $100k-200k)
Ordinary dividends: $2,612 (reported on 10.4% of returns)
Here:
$2,612
State:
$6,972
(% of AGI for various income ranges: 9.3% for AGIs below $25k, 29.6% for AGIs $25k-50k, 34.8% for AGIs $50k-75k, 23.0% for AGIs $75k-100k, 187.4% for AGIs $100k-200k)
Net capital gain/loss in AGI: +$7,989 (reported on 9.4% of returns)
Here:
+$7,989
State:
+$20,064
(% of AGI for various income ranges: 0.5% for AGIs below $25k, 16.2% for AGIs $25k-50k, 24.1% for AGIs $50k-75k, 85.0% for AGIs $75k-100k, 253.0% for AGIs $100k-200k)
Profit/loss from business: +$4,545 (reported on 14.0% of returns)
Here:
+$4,545
State:
+$11,172
(% of AGI for various income ranges: 71.0% for AGIs below $25k, 55.0% for AGIs $25k-50k, 139.3% for AGIs $50k-75k, 54.7% for AGIs $75k-100k, 189.6% for AGIs $100k-200k)
Taxable individual retirement arrangement distribution: $13,917 (reported on 7.6% of returns)
48457:
$13,917
Michigan:
$19,803
(% of AGI for various income ranges: 39.5% for AGIs below $25k, 73.5% for AGIs $25k-50k, 177.3% for AGIs $50k-75k, 269.7% for AGIs $75k-100k, 577.8% for AGIs $100k-200k)
Total itemized deductions: $28,958 (reported on 3.1% of returns)
Here:
$28,958
State:
$34,117
(% of AGI for various income ranges: 110.9% for AGIs $25k-50k, 156.6% for AGIs $50k-75k, 197.0% for AGIs $75k-100k, 476.3% for AGIs $100k-200k)
Charity contributions: $7,573 (reported on 2.8% of returns)
Here:
$7,573
State:
$13,548
(% of AGI for various income ranges: 15.5% for AGIs $25k-50k, 67.0% for AGIs $50k-75k, 152.2% for AGIs $100k-200k)
Taxes paid: $8,042 (reported on 3.1% of returns)
48457:
$8,042
State:
$7,972
(% of AGI for various income ranges: 17.0% for AGIs $25k-50k, 45.7% for AGIs $50k-75k, 82.7% for AGIs $75k-100k, 139.6% for AGIs $100k-200k)
Earned income credit: $2,300 (reported on 17.0% of returns)
Here:
$2,300
State:
$2,251
(% of AGI for various income ranges: 81.6% for AGIs below $25k, 81.5% for AGIs $25k-50k)
Percentage of individuals using paid preparers for their 2020 taxes: 94.9%
Here:
95%
State:
93%
(% for various income ranges: 93.4% for AGIs below $25k, 95.1% for AGIs $25k-50k, 94.8% for AGIs $50k-75k, 100.0% for AGIs $75k-100k, 94.7% for AGIs $100k-200k, 100.0% for AGIs over 200k)
Averages for the 2012 tax year for zip code 48457, filed in 2013:
Average Adjusted Gross Income (AGI) in 2012: $38,779 (Individual Income Tax Returns)
Here:
$38,779
State:
$55,609
Salary/wage: $32,503 (reported on 84.2% of returns)
Here:
$32,503
State:
$46,782
(% of AGI for various income ranges: 62.5% for AGIs below $25k, 65.1% for AGIs $25k-50k, 71.3% for AGIs $50k-75k, 75.6% for AGIs $75k-100k, 75.5% for AGIs $100k-200k)
Taxable interest for individuals: $891 (reported on 30.1% of returns)
This zip code:
$891
Michigan:
$1,491
(% of AGI for various income ranges: 0.8% for AGIs below $25k, 0.6% for AGIs $25k-50k, 0.7% for AGIs $50k-75k, 0.5% for AGIs $75k-100k, 0.9% for AGIs $100k-200k)
Ordinary dividends: $2,748 (reported on 11.6% of returns)
Here:
$2,748
State:
$6,225
(% of AGI for various income ranges: 0.7% for AGIs below $25k, 0.4% for AGIs $25k-50k, 0.8% for AGIs $50k-75k, 0.7% for AGIs $75k-100k, 1.3% for AGIs $100k-200k)
Net capital gain/loss in AGI: +$717 (reported on 9.2% of returns)
Here:
+$717
State:
+$9,326
(% of AGI for various income ranges: 0.2% for AGIs $75k-100k, 0.8% for AGIs $100k-200k)
Profit/loss from business: +$4,942 (reported on 13.2% of returns)
Here:
+$4,942
State:
+$11,523
(% of AGI for various income ranges: 4.9% for AGIs below $25k, 2.3% for AGIs $25k-50k, 1.2% for AGIs $50k-75k, 0.5% for AGIs $75k-100k, 0.6% for AGIs $100k-200k)
Taxable individual retirement arrangement distribution: $11,600 (reported on 7.7% of returns)
48457:
$11,600
Michigan:
$15,298
(% of AGI for various income ranges: 1.5% for AGIs below $25k, 1.6% for AGIs $25k-50k, 2.7% for AGIs $50k-75k, 2.7% for AGIs $75k-100k, 2.6% for AGIs $100k-200k)
Total itemized deductions: $16,878 (24% of AGI, reported on 23.2% of returns)
Here:
$16,878
State:
$21,628
Here:
23.6% of AGI
State:
18.4% of AGI
(% of AGI for various income ranges: 7.7% for AGIs below $25k, 8.5% for AGIs $25k-50k, 10.2% for AGIs $50k-75k, 10.5% for AGIs $75k-100k, 12.6% for AGIs $100k-200k)
Charity contributions: $2,723 (reported on 18.5% of returns)
Here:
$2,723
State:
$4,225
(% of AGI for various income ranges: 0.6% for AGIs below $25k, 1.1% for AGIs $25k-50k, 1.3% for AGIs $50k-75k, 1.4% for AGIs $75k-100k, 1.8% for AGIs $100k-200k)
Taxes paid: $5,236 (reported on 23.2% of returns)
48457:
$5,236
State:
$8,327
(% of AGI for various income ranges: 1.3% for AGIs below $25k, 2.2% for AGIs $25k-50k, 3.0% for AGIs $50k-75k, 3.3% for AGIs $75k-100k, 5.1% for AGIs $100k-200k)
Earned income credit: $2,202 (reported on 22.2% of returns)
Here:
$2,202
State:
$2,306
(% of AGI for various income ranges: 6.8% for AGIs below $25k, 1.3% for AGIs $25k-50k)
Percentage of individuals using paid preparers for their 2012 taxes: 63.1%
Here:
63%
State:
57%
(% for various income ranges: 58.5% for AGIs below $25k, 63.9% for AGIs $25k-50k, 69.1% for AGIs $50k-75k, 68.8% for AGIs $75k-100k, 73.1% for AGIs $100k-200k)
Averages for the 2004 tax year for zip code 48457, filed in 2005:
Average Adjusted Gross Income (AGI) in 2004: $38,030 (Individual Income Tax Returns)
Here:
$38,030
State:
$48,204
Salary/wage: $33,887 (reported on 88.6% of returns)
Here:
$33,887
State:
$42,791
(% of AGI for various income ranges: 85.8% for AGIs below $10k, 67.0% for AGIs $10k-25k, 72.2% for AGIs $25k-50k, 83.9% for AGIs $50k-75k, 86.9% for AGIs $75k-100k, 77.7% for AGIs over 100k)
Taxable interest for individuals: $991 (reported on 44.8% of returns)
This zip code:
$991
Michigan:
$1,725
(% of AGI for various income ranges: 3.8% for AGIs below $10k, 1.9% for AGIs $10k-25k, 1.2% for AGIs $25k-50k, 0.8% for AGIs $50k-75k, 1.0% for AGIs $75k-100k, 1.1% for AGIs over 100k)
Taxable dividends: $1,403 (reported on 18.7% of returns)
Here:
$1,403
State:
$3,420
(% of AGI for various income ranges: 1.9% for AGIs below $10k, 0.9% for AGIs $10k-25k, 0.5% for AGIs $25k-50k, 0.6% for AGIs $50k-75k, 0.6% for AGIs $75k-100k, 0.9% for AGIs over 100k)
Net capital gain/loss: +$5,069 (reported on 12.1% of returns)
Here:
+$5,069
State:
+$8,532
(% of AGI for various income ranges: -1.6% for AGIs below $10k, 0.3% for AGIs $10k-25k, 0.3% for AGIs $25k-50k, 0.6% for AGIs $50k-75k, 1.1% for AGIs $75k-100k, 6.1% for AGIs over 100k)
Profit/loss from business: +$4,222 (reported on 14.1% of returns)
Here:
+$4,222
State:
+$9,547
(% of AGI for various income ranges: 4.2% for AGIs below $10k, 3.7% for AGIs $10k-25k, 2.2% for AGIs $25k-50k, 1.5% for AGIs $50k-75k, 0.3% for AGIs $75k-100k, 0.6% for AGIs over 100k)
IRA payment deduction: $2,864 (reported on 1.5% of returns)
48457:
$2,864
Michigan:
$2,875
Total itemized deductions: $14,623 (23% of AGI, reported on 33.0% of returns)
Here:
$14,623
State:
$18,509
Here:
22.6% of AGI
State:
20.7% of AGI
(% of AGI for various income ranges: 7.7% for AGIs below $10k, 9.7% for AGIs $10k-25k, 13.2% for AGIs $25k-50k, 13.5% for AGIs $50k-75k, 13.0% for AGIs $75k-100k, 13.0% for AGIs over 100k)
Charity contributions deductions: $2,176 (3% of AGI, reported on 29.2% of returns)
Here:
$2,176
State:
$3,365
Here:
3.2% of AGI
State:
3.6% of AGI
(% of AGI for various income ranges: 0.3% for AGIs below $10k, 0.9% for AGIs $10k-25k, 1.5% for AGIs $25k-50k, 1.4% for AGIs $50k-75k, 2.1% for AGIs $75k-100k, 2.4% for AGIs over 100k)
Total tax: $4,624 (reported on 72.0% of returns)
48457:
$4,624
State:
$7,691
(% of AGI for various income ranges: 2.4% for AGIs below $10k, 3.4% for AGIs $10k-25k, 5.9% for AGIs $25k-50k, 8.3% for AGIs $50k-75k, 10.4% for AGIs $75k-100k, 14.6% for AGIs over 100k)
Earned income credit: $1,733 (reported on 16.6% of returns)
Here:
$1,733
State:
$1,737
Percentage of individuals using paid preparers for their 2004 taxes: 66.9%
Here:
67%
State:
60%
(% for various income ranges: 61.7% for AGIs below $10k, 67.4% for AGIs $10k-25k, 67.2% for AGIs $25k-50k, 70.4% for AGIs $50k-75k, 69.1% for AGIs $75k-100k, 70.6% for AGIs over 100k)
Household received Food Stamps/SNAP in the past 12 months: 623 Household did not receive Food Stamps/SNAP in the past 12 months: 2,796
Women who had a birth in the past 12 months: 161 (65 now married, 92 unmarried) Women who did not have a birth in the past 12 months: 1,569 (693 now married, 873 unmarried)
Housing units in zip code 48457 with a mortgage: 1,534 (116 second mortgage, 93 both second mortgage and home equity loan) Houses without a mortgage: 79
Median monthly owner costs for units with a mortgage: $1,262 Median monthly owner costs for units without a mortgage: $565
Residents with income below the poverty level in 2022:
This zip code:
19.3%
Whole state:
13.4%
Residents with income below 50% of the poverty level in 2022:
This zip code:
12.5%
Whole state:
6.9%
Median number of rooms in houses and condos:
Here:
6.2
State:
6.5
Median number of rooms in apartments:
Here:
4.5
State:
4.3
Notable locations in this zip code not listed on our city pages
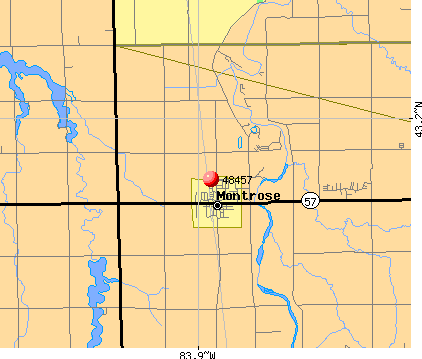
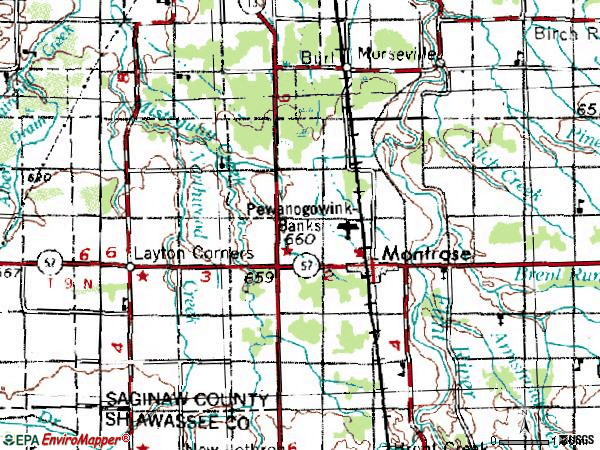
Notable locations in zip code 48457: Montrose Station (A), Briar Ridge Golf Course (B), Montrose Jennings Library (C), Montrose Historical and Telephone Pioneer Museum (D), Montrose Township Fire Department (E). Display/hide their locations on the map
Churches in zip code 48457 include: First Baptist Church (A), Full Gospel Church (B), Mount Sinai Lutheran Church (C), Montrose Wesleyan Church (D), Montrose United Methodist Church (E), Montrose Baptist Church (F), Good Shepherd Church (G), Lamb of God Fellowship (H), Christian Faith Church (I). Display/hide their locations on the map
Streams, rivers, and creeks: Brent Run (A), Armstrong Creek (B), Mitchell Creek (C), Northwood Creek (D), Pitch Creek (E). Display/hide their locations on the map
Parks in zip code 48457 include: Methodist Episcopal Church Historical Marker (1), Morseville Bridge Historical Marker (2). Display/hide their locations on the map
1,006 married couples with children.
506 single-parent households (203 men, 303 women).
98.4% of residents of 48457 zip code speak English at home.
1.0% of residents speak Spanish at home (41% very well, 59% well).
0.4% of residents speak other Indo-European language at home (28% very well, 72% not well).
0.2% of residents speak Asian or Pacific Island language at home (41% very well, 59% well).
Foreign born population: 71 (0.8%) (64.6% of them are naturalized citizens)
This zip code:
0.8%
Whole state:
6.9%
25%Romania
20%Colombia
15%Sweden
14%Malaysia
10%Poland
26%German
13%American
12%English
5%Irish
4%Polish
4%European
3%French Canadian
Year of entry for the foreign-born population
202010 or later
362000 to 2009
141990 to 1999
24Before 1990
Facilities with environmental interests located in this zip code:
GENESEE CO-RAGNONE WWTP (9290 FARRAND ROAD in MONTROSE, MI)
National Pollutant Discharge Elimination System MAJOR (Tracking pollutant discharge elimination systems) - permit National Pollutant Discharge Elimination System NON-MAJOR (Tracking pollutant discharge elimination systems) - permit (Resource Conservation and Recovery Act (tracking hazardous waste)) Business SIC classification: SEWERAGE SYSTEMS Organizations: GENESEE CO DRAIN COMMISSIONER (CONTACT/OWNER)
, COUNTY OF GENESEE DRAIN COMMISSIONER (CONTACT/OWNER)
Alternative names: ANTHONY RAGNONE WASTE WATER TREATMENT PLANT, GENESEE COUNTY DRAIN COMMISION, GENESEE COUNTY WASTEWATER TREATMENT, GENESEE COUNTY WATER & WASTE SERVICES
CHIPPEWA CONTRACTING INC (PRESNULL PIT in MONTROSE, MI)
National Pollutant Discharge Elimination System NON-MAJOR (Tracking pollutant discharge elimination systems) - permit Business SIC classification: CONSTRUCTION SAND AND GRAVEL Alternative names: CHIPPEWA CONTRACTING-PRESNULL
MI DEPT/TRANSPORTATION (M57 OVER BRENT RUN CREEK in MONTROSE, MI)
Conditionally Exempt Small Quantity Generators, less than 100 kg/month of hazardous waste (Resource Conservation and Recovery Act (tracking hazardous waste)) Organizations: MICH DEPT OF TRANSPORTATION (CONTACT/OPERATOR)
Alternative names: MI/DEPT TRANSPORTATION BRIDGE B02 25101
GRANGER SEYMOUR ROAD GENERATING STATION (13200 N SEYMOUR RD in MONTROSE, MI)
CRITERIA AND HAZARDOUS AIR POLLUTANT INVENTORY (Inventory of air pollution sources) Business SIC classification: ELECTRIC SERVICES
DUNNINGS DISPOSAL (9321 MCKINLEY RD in MONTROSE, MI)
CRITERIA AND HAZARDOUS AIR POLLUTANT INVENTORY (Inventory of air pollution sources) Business SIC classification: REFUSE SYSTEMS Business NAICS classification: SOLID WASTE LANDFILL.
Housing units lacking complete plumbing facilities: 2.0% Housing units lacking complete kitchen facilities: 2.4%
62.1%Utility gas
19.9%Bottled, tank, or LP gas
8.9%Electricity
4.9%Wood
1.9%Other fuel
1.6%Fuel oil, kerosene, etc.
0.7%No fuel used
Population in 1990: 7,181. Population change in the 1990s: +1,235 (+17.2%).
Place of birth for U.S.-born residents:
This state: 7,882
Northeast: 58
Midwest: 230
South: 509
West: 49
64% of the 48457 zip code residents lived in the same house 5 years ago. Out of people who lived in different houses, 62% lived in this county. Out of people who lived in different counties, 50% lived in Michigan.
92% of the 48457 zip code residents lived in the same house 1 year ago. Out of people who lived in different houses, 47% moved from this county. Out of people who lived in different houses, 42% moved from different county within same state. Out of people who lived in different houses, 8% moved from different state. Out of people who lived in different houses, 3% moved from abroad.
Private vs. public school enrollment:
Students in private schools in grades 1 to 8 (elementary and middle school): 31
Here:
3.9%
Michigan:
12.4%
Students in private schools in grades 9 to 12 (high school): 12
Here:
3.4%
Michigan:
9.8%
Students in private undergraduate colleges: 44
Here:
17.7%
Michigan:
14.9%
Occupation by median earnings in the past 12 months ($)
83,133Computer and mathematical occupations
82,277Health diagnosing and treating practitioners and other technical occupations
65,867Installation, maintenance, and repair occupations
58,877Architecture and engineering occupations
55,773Community and social service occupations
49,430Business and financial operations occupations
Top industries in this zip code by the number of employees in 2005:
Health Care and Social Assistance: Nursing Care Facilities (50-99 employees: 1 establishment, 5-9 employees: 1 establishment)
Health Care and Social Assistance: Residential Mental Retardation Facilities (10-19: 3, 1-4: 1)
Administrative and Support and Waste Management and Remediation Services: Janitorial Services (20-49: 1, 1-4: 1)
Finance and Insurance: Commercial Banking (20-49: 1)
Wholesale Trade: Metal Service Centers and Other Metal Merchant Wholesalers (20-49: 1)
Health Care and Social Assistance: Home Health Care Services (20-49: 1)
Construction: Residential Remodelers (20-49: 1)
Health Care and Social Assistance: Offices of Physicians (except Mental Health Specialists) (10-19: 1, 5-9: 1, 1-4: 2)
Accommodation and Food Services: Limited-Service Restaurants (10-19: 1, 5-9: 1)
People in group quarters in 2010:
98 people in group homes intended for adults
59 people in nursing facilities/skilled-nursing facilities
8 people in workers' group living quarters and job corps centers
People in group quarters in 2000:
79 people in nursing homes
52 people in other group homes
33 people in homes for the mentally retarded
21 people in other noninstitutional group quarters
14 people in homes for the physically handicapped
12 people in homes for the mentally ill
Fatal accident statistics in 2012:
Fatal accident count: 2
Vehicles involved in fatal accidents: 2
Fatal accidents caused by drunken drivers: 1
Fatalities: 2
Persons involved in fatal accidents: 2
Pedestrians involved in fatal accidents: 0
Fatal accident statistics in 2011:
Fatal accident count: 1
Vehicles involved in fatal accidents: 2
Fatal accidents caused by drunken drivers: 0
Fatalities: 1
Persons involved in fatal accidents: 2
Pedestrians involved in fatal accidents: 0
Home Mortgage Disclosure Act Aggregated Statistics For Year 2009 (Based on 1 full and 6 partial tracts)
A) FHA, FSA/RHS & VA Home Purchase Loans
B) Conventional Home Purchase Loans
C) Refinancings
D) Home Improvement Loans
F) Non-occupant Loans on < 5 Family Dwellings (A B C & D)
G) Loans On Manufactured Home Dwelling (A B C & D)
Number
Average Value
Number
Average Value
Number
Average Value
Number
Average Value
Number
Average Value
Number
Average Value
LOANS ORIGINATED
41
$74,466
18
$77,496
171
$98,886
10
$15,625
10
$41,910
9
$61,758
APPLICATIONS APPROVED, NOT ACCEPTED
2
$151,095
5
$32,820
14
$86,121
1
$10,440
0
$0
2
$30,230
APPLICATIONS DENIED
18
$85,842
18
$46,038
82
$107,734
11
$60,926
10
$57,475
5
$70,006
APPLICATIONS WITHDRAWN
10
$80,597
7
$50,207
41
$121,183
2
$17,380
2
$37,315
4
$61,052
FILES CLOSED FOR INCOMPLETENESS
2
$67,520
1
$50,000
8
$99,166
0
$0
0
$0
2
$35,535
Aggregated Statistics For Year 2008 (Based on 1 full and 6 partial tracts)
A) FHA, FSA/RHS & VA Home Purchase Loans
B) Conventional Home Purchase Loans
C) Refinancings
D) Home Improvement Loans
F) Non-occupant Loans on < 5 Family Dwellings (A B C & D)
G) Loans On Manufactured Home Dwelling (A B C & D)
Number
Average Value
Number
Average Value
Number
Average Value
Number
Average Value
Number
Average Value
Number
Average Value
LOANS ORIGINATED
59
$99,510
27
$73,127
136
$118,340
33
$41,787
10
$284,670
9
$332,618
APPLICATIONS APPROVED, NOT ACCEPTED
1
$68,650
5
$124,218
30
$120,972
7
$48,547
3
$48,213
2
$123,750
APPLICATIONS DENIED
11
$105,501
18
$50,983
153
$112,205
20
$69,259
13
$52,325
16
$61,924
APPLICATIONS WITHDRAWN
8
$93,091
3
$73,183
33
$108,740
2
$27,855
1
$50,440
1
$44,270
FILES CLOSED FOR INCOMPLETENESS
3
$79,110
2
$137,700
12
$101,544
2
$91,550
2
$45,775
2
$102,165
Aggregated Statistics For Year 2007 (Based on 1 full and 6 partial tracts)
A) FHA, FSA/RHS & VA Home Purchase Loans
B) Conventional Home Purchase Loans
C) Refinancings
D) Home Improvement Loans
F) Non-occupant Loans on < 5 Family Dwellings (A B C & D)
G) Loans On Manufactured Home Dwelling (A B C & D)
Number
Average Value
Number
Average Value
Number
Average Value
Number
Average Value
Number
Average Value
Number
Average Value
LOANS ORIGINATED
34
$99,960
83
$90,104
292
$93,484
58
$29,253
31
$56,938
23
$81,342
APPLICATIONS APPROVED, NOT ACCEPTED
0
$0
24
$108,936
56
$123,750
19
$25,517
5
$66,482
5
$66,936
APPLICATIONS DENIED
6
$101,112
51
$88,820
274
$111,594
54
$39,263
16
$64,406
21
$60,379
APPLICATIONS WITHDRAWN
0
$0
16
$100,966
82
$112,811
6
$59,133
2
$55,855
3
$111,130
FILES CLOSED FOR INCOMPLETENESS
0
$0
3
$36,997
25
$123,632
4
$37,388
0
$0
2
$101,280
Aggregated Statistics For Year 2006 (Based on 1 full and 6 partial tracts)
A) FHA, FSA/RHS & VA Home Purchase Loans
B) Conventional Home Purchase Loans
C) Refinancings
D) Home Improvement Loans
F) Non-occupant Loans on < 5 Family Dwellings (A B C & D)
G) Loans On Manufactured Home Dwelling (A B C & D)
Number
Average Value
Number
Average Value
Number
Average Value
Number
Average Value
Number
Average Value
Number
Average Value
LOANS ORIGINATED
24
$105,458
132
$95,332
366
$91,095
67
$55,932
25
$97,583
29
$76,779
APPLICATIONS APPROVED, NOT ACCEPTED
1
$90,220
33
$93,027
76
$101,720
10
$28,168
11
$81,926
9
$72,240
APPLICATIONS DENIED
1
$90,500
65
$87,884
376
$117,216
47
$42,049
22
$75,095
43
$86,039
APPLICATIONS WITHDRAWN
0
$0
24
$87,262
167
$114,922
7
$63,564
6
$100,177
6
$68,112
FILES CLOSED FOR INCOMPLETENESS
0
$0
0
$0
53
$126,665
0
$0
2
$149,420
2
$73,735
Aggregated Statistics For Year 2005 (Based on 1 full and 6 partial tracts)
A) FHA, FSA/RHS & VA Home Purchase Loans
B) Conventional Home Purchase Loans
C) Refinancings
D) Home Improvement Loans
F) Non-occupant Loans on < 5 Family Dwellings (A B C & D)
G) Loans On Manufactured Home Dwelling (A B C & D)
Number
Average Value
Number
Average Value
Number
Average Value
Number
Average Value
Number
Average Value
Number
Average Value
LOANS ORIGINATED
22
$110,601
211
$93,440
429
$94,768
79
$42,685
27
$79,013
28
$101,158
APPLICATIONS APPROVED, NOT ACCEPTED
2
$99,065
30
$71,497
95
$105,532
9
$34,188
3
$88,970
9
$97,689
APPLICATIONS DENIED
7
$132,244
95
$107,434
380
$114,435
51
$42,953
6
$91,432
49
$85,980
APPLICATIONS WITHDRAWN
2
$93,280
35
$110,397
232
$117,791
18
$183,548
4
$99,815
13
$81,318
FILES CLOSED FOR INCOMPLETENESS
0
$0
9
$84,600
65
$126,281
0
$0
2
$82,050
3
$74,660
Aggregated Statistics For Year 2004 (Based on 1 full and 6 partial tracts)
A) FHA, FSA/RHS & VA Home Purchase Loans
B) Conventional Home Purchase Loans
C) Refinancings
D) Home Improvement Loans
E) Loans on Dwellings For 5+ Families
F) Non-occupant Loans on < 5 Family Dwellings (A B C & D)
G) Loans On Manufactured Home Dwelling (A B C & D)
Number
Average Value
Number
Average Value
Number
Average Value
Number
Average Value
Number
Average Value
Number
Average Value
Number
Average Value
LOANS ORIGINATED
14
$103,149
161
$102,944
542
$96,790
114
$45,954
2
$27,540
20
$72,301
57
$95,739
APPLICATIONS APPROVED, NOT ACCEPTED
3
$93,040
43
$96,880
99
$102,711
15
$54,277
0
$0
7
$92,007
20
$63,916
APPLICATIONS DENIED
5
$93,094
62
$99,100
342
$116,952
52
$44,151
0
$0
4
$56,860
46
$86,922
APPLICATIONS WITHDRAWN
3
$81,523
17
$88,934
176
$118,258
12
$32,178
0
$0
4
$75,620
13
$102,312
FILES CLOSED FOR INCOMPLETENESS
0
$0
15
$87,614
62
$128,923
5
$145,102
0
$0
0
$0
6
$90,545
Aggregated Statistics For Year 2003 (Based on 1 full and 6 partial tracts)
A) FHA, FSA/RHS & VA Home Purchase Loans
B) Conventional Home Purchase Loans
C) Refinancings
D) Home Improvement Loans
F) Non-occupant Loans on < 5 Family Dwellings (A B C & D)
Number
Average Value
Number
Average Value
Number
Average Value
Number
Average Value
Number
Average Value
LOANS ORIGINATED
29
$102,397
174
$97,345
884
$94,029
69
$20,256
28
$59,701
APPLICATIONS APPROVED, NOT ACCEPTED
7
$104,161
29
$84,723
175
$91,508
13
$17,882
11
$94,425
APPLICATIONS DENIED
7
$80,464
81
$109,461
348
$91,347
43
$24,339
8
$87,116
APPLICATIONS WITHDRAWN
4
$61,300
24
$107,368
150
$96,976
2
$12,580
6
$103,670
FILES CLOSED FOR INCOMPLETENESS
1
$79,020
24
$73,104
45
$99,355
2
$39,980
0
$0
Aggregated Statistics For Year 2002 (Based on 2 partial tracts)
A) FHA, FSA/RHS & VA Home Purchase Loans
B) Conventional Home Purchase Loans
C) Refinancings
D) Home Improvement Loans
F) Non-occupant Loans on < 5 Family Dwellings (A B C & D)
Number
Average Value
Number
Average Value
Number
Average Value
Number
Average Value
Number
Average Value
LOANS ORIGINATED
1
$131,970
9
$103,674
65
$93,151
3
$21,297
2
$107,595
APPLICATIONS APPROVED, NOT ACCEPTED
0
$0
1
$108,440
8
$99,821
0
$0
0
$0
APPLICATIONS DENIED
0
$0
3
$43,430
21
$76,561
2
$15,270
1
$24,660
APPLICATIONS WITHDRAWN
0
$0
1
$39,790
16
$85,426
0
$0
1
$19,050
FILES CLOSED FOR INCOMPLETENESS
0
$0
0
$0
5
$73,972
1
$4,200
0
$0
Aggregated Statistics For Year 2001 (Based on 2 partial tracts)
A) FHA, FSA/RHS & VA Home Purchase Loans
B) Conventional Home Purchase Loans
C) Refinancings
D) Home Improvement Loans
F) Non-occupant Loans on < 5 Family Dwellings (A B C & D)
Number
Average Value
Number
Average Value
Number
Average Value
Number
Average Value
Number
Average Value
LOANS ORIGINATED
2
$76,915
10
$93,110
59
$87,988
9
$24,378
1
$116,560
APPLICATIONS APPROVED, NOT ACCEPTED
0
$0
2
$85,880
6
$80,417
1
$25,780
0
$0
APPLICATIONS DENIED
0
$0
4
$74,882
25
$76,371
5
$28,356
1
$26,900
APPLICATIONS WITHDRAWN
0
$0
1
$28,580
16
$80,820
0
$0
0
$0
FILES CLOSED FOR INCOMPLETENESS
0
$0
0
$0
3
$97,603
0
$0
0
$0
Aggregated Statistics For Year 2000 (Based on 2 partial tracts)
A) FHA, FSA/RHS & VA Home Purchase Loans
B) Conventional Home Purchase Loans
C) Refinancings
D) Home Improvement Loans
F) Non-occupant Loans on < 5 Family Dwellings (A B C & D)
Number
Average Value
Number
Average Value
Number
Average Value
Number
Average Value
Number
Average Value
LOANS ORIGINATED
2
$71,590
9
$90,162
25
$65,107
7
$15,371
1
$70,050
APPLICATIONS APPROVED, NOT ACCEPTED
0
$0
2
$59,825
7
$77,296
3
$32,130
0
$0
APPLICATIONS DENIED
0
$0
4
$45,182
12
$71,918
7
$22,976
0
$0
APPLICATIONS WITHDRAWN
1
$42,310
3
$74,253
8
$62,975
1
$25,780
1
$17,090
FILES CLOSED FOR INCOMPLETENESS
0
$0
1
$55,200
3
$75,187
0
$0
0
$0
Aggregated Statistics For Year 1999 (Based on 2 partial tracts)
A) FHA, FSA/RHS & VA Home Purchase Loans
B) Conventional Home Purchase Loans
C) Refinancings
D) Home Improvement Loans
F) Non-occupant Loans on < 5 Family Dwellings (A B C & D)
2002 - 2018 National Fire Incident Reporting System (NFIRS) incidents
Based on the data from the years 2002 - 2018 the average number of fire incidents per year is 48. The highest number of fires - 79 took place in 2009, and the least - 10 in 2004. The data has a growing trend.
When looking into fire subcategories, the most reports belonged to: Structure Fires (56.9%), and Outside Fires (26.6%).
Fire incident types reported to NFIRS in Zip Code 48457


 Nearest zip codes: 48417, 48460, 48433, 48415, 48722, 48420.


 Based on the data from the years 2002 - 2018 the average number of fire incidents per year is 48. The highest number of fires - 79 took place in 2009, and the least - 10 in 2004. The data has a growing trend.
 When looking into fire subcategories, the most reports belonged to: Structure Fires (56.9%), and Outside Fires (26.6%).