Estimated zip code population in 2022: 11,286 Zip code population in 2010: 10,547 Zip code population in 2000: 10,015
Houses and condos: 4,727 Renter-occupied apartments: 827
% of renters here:
17%
State:
27%
March 2022 cost of living index in zip code 48065: 96.0 (near average, U.S. average is 100)
Land area: 37.4 sq. mi. Water area: 0.4 sq. mi.
Population density: 302 people per square mile
(very low).
OSM Map
General Map
Google Map
MSN Map
OSM Map
General Map
Google Map
MSN Map
OSM Map
General Map
Google Map
MSN Map
OSM Map
General Map
Google Map
MSN Map
Please wait while loading the map...
Real estate property taxes paid for housing units in 2022:
This zip code:
1.1% ($3,766)
Michigan:
1.2% ($2,746)
Median real estate property taxes paid for housing units with mortgages in 2022: $4,087 (1.1%) Median real estate property taxes paid for housing units with no mortgage in 2022: $3,348 (1.1%)
Estimated median house/condo value in 2022: $345,806
48065:
$345,806
Michigan:
$224,400
According to our research of Michigan and other state lists, there were 12 registered sex offenders living in 48065 zip code as of May 25, 2024. The ratio of all residents to sex offenders in zip code 48065 is 933 to 1. The ratio of registered sex offenders to all residents in this zip code is much lower than the state average.
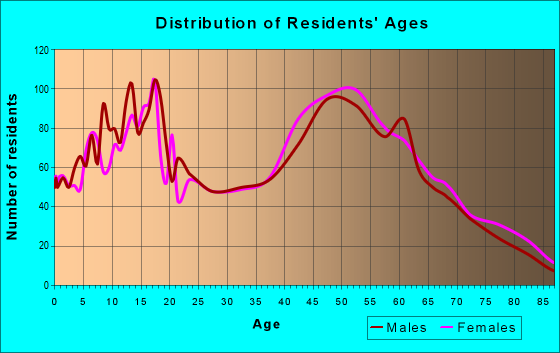
Median resident age:
This zip code:
47.4 years
Michigan median age:
40.3 years
Average household size:
This zip code:
2.4 people
Michigan:
2.4 people
Averages for the 2020 tax year for zip code 48065, filed in 2021:
Average Adjusted Gross Income (AGI) in 2020: $85,789 (Individual Income Tax Returns)
Here:
$85,789
State:
$68,945
Salary/wage: $69,972 (reported on 77.4% of returns)
Here:
$69,972
State:
$57,142
(% of AGI for various income ranges: 996.4% for AGIs below $25k, 3258.1% for AGIs $25k-50k, 6036.2% for AGIs $50k-75k, 9132.1% for AGIs $75k-100k, 17957.5% for AGIs $100k-200k, 68019.3% for AGIs over 200k)
Taxable interest for individuals: $2,232 (reported on 37.4% of returns)
This zip code:
$2,232
Michigan:
$1,630
(% of AGI for various income ranges: 16.0% for AGIs below $25k, 25.3% for AGIs $25k-50k, 55.8% for AGIs $50k-75k, 106.3% for AGIs $75k-100k, 210.7% for AGIs $100k-200k, 1742.9% for AGIs over 200k)
Ordinary dividends: $5,488 (reported on 26.1% of returns)
Here:
$5,488
State:
$6,972
(% of AGI for various income ranges: 34.4% for AGIs below $25k, 65.2% for AGIs $25k-50k, 93.2% for AGIs $50k-75k, 209.2% for AGIs $75k-100k, 340.6% for AGIs $100k-200k, 2855.7% for AGIs over 200k)
Net capital gain/loss in AGI: +$18,981 (reported on 25.5% of returns)
Here:
+$18,981
State:
+$20,064
(% of AGI for various income ranges: 9.1% for AGIs below $25k, 66.7% for AGIs $25k-50k, 128.2% for AGIs $50k-75k, 236.8% for AGIs $75k-100k, 549.7% for AGIs $100k-200k, 16317.1% for AGIs over 200k)
Profit/loss from business: +$13,798 (reported on 16.2% of returns)
Here:
+$13,798
State:
+$11,172
(% of AGI for various income ranges: 122.4% for AGIs below $25k, 186.7% for AGIs $25k-50k, 284.6% for AGIs $50k-75k, 251.6% for AGIs $75k-100k, 552.2% for AGIs $100k-200k, 2991.4% for AGIs over 200k)
Taxable individual retirement arrangement distribution: $20,945 (reported on 11.9% of returns)
48065:
$20,945
Michigan:
$19,803
(% of AGI for various income ranges: 70.3% for AGIs below $25k, 146.0% for AGIs $25k-50k, 359.6% for AGIs $50k-75k, 448.2% for AGIs $75k-100k, 848.8% for AGIs $100k-200k, 2469.3% for AGIs over 200k)
Self-employed (Keogh) retirement plans: $22,125 (reported on 0.7% of returns)
48065:
$22,125
Michigan:
$25,132
(% of AGI for various income ranges: 632.1% for AGIs over 200k)
Total itemized deductions: $30,412 (reported on 9.7% of returns)
Here:
$30,412
State:
$34,117
(% of AGI for various income ranges: 119.2% for AGIs below $25k, 122.7% for AGIs $25k-50k, 247.8% for AGIs $50k-75k, 491.3% for AGIs $75k-100k, 1035.7% for AGIs $100k-200k, 3543.6% for AGIs over 200k)
Charity contributions: $7,555 (reported on 8.2% of returns)
Here:
$7,555
State:
$13,548
(% of AGI for various income ranges: 4.2% for AGIs below $25k, 14.8% for AGIs $25k-50k, 29.0% for AGIs $50k-75k, 58.4% for AGIs $75k-100k, 233.5% for AGIs $100k-200k, 1106.4% for AGIs over 200k)
Taxes paid: $8,279 (reported on 9.7% of returns)
48065:
$8,279
State:
$7,972
(% of AGI for various income ranges: 12.8% for AGIs below $25k, 25.4% for AGIs $25k-50k, 69.8% for AGIs $50k-75k, 138.4% for AGIs $75k-100k, 317.8% for AGIs $100k-200k, 977.9% for AGIs over 200k)
Earned income credit: $1,821 (reported on 8.7% of returns)
Here:
$1,821
State:
$2,251
(% of AGI for various income ranges: 43.8% for AGIs below $25k, 51.6% for AGIs $25k-50k)
Percentage of individuals using paid preparers for their 2020 taxes: 93.1%
Here:
93%
State:
93%
(% for various income ranges: 91.3% for AGIs below $25k, 94.0% for AGIs $25k-50k, 94.7% for AGIs $50k-75k, 94.7% for AGIs $75k-100k, 93.4% for AGIs $100k-200k, 93.0% for AGIs over 200k)
Averages for the 2012 tax year for zip code 48065, filed in 2013:
Average Adjusted Gross Income (AGI) in 2012: $76,136 (Individual Income Tax Returns)
Here:
$76,136
State:
$55,609
Salary/wage: $57,473 (reported on 83.4% of returns)
Here:
$57,473
State:
$46,782
(% of AGI for various income ranges: 69.9% for AGIs below $25k, 68.1% for AGIs $25k-50k, 68.8% for AGIs $50k-75k, 68.3% for AGIs $75k-100k, 79.3% for AGIs $100k-200k, 42.4% for AGIs over 200k)
Taxable interest for individuals: $2,033 (reported on 40.1% of returns)
This zip code:
$2,033
Michigan:
$1,491
(% of AGI for various income ranges: 1.6% for AGIs below $25k, 1.1% for AGIs $25k-50k, 1.0% for AGIs $50k-75k, 0.7% for AGIs $75k-100k, 0.7% for AGIs $100k-200k, 1.5% for AGIs over 200k)
Ordinary dividends: $8,020 (reported on 26.7% of returns)
Here:
$8,020
State:
$6,225
(% of AGI for various income ranges: 1.7% for AGIs below $25k, 1.0% for AGIs $25k-50k, 1.4% for AGIs $50k-75k, 1.0% for AGIs $75k-100k, 1.1% for AGIs $100k-200k, 6.0% for AGIs over 200k)
Net capital gain/loss in AGI: +$8,034 (reported on 21.8% of returns)
Here:
+$8,034
State:
+$9,326
(% of AGI for various income ranges: 0.3% for AGIs $50k-75k, 0.1% for AGIs $75k-100k, 1.1% for AGIs $100k-200k, 5.7% for AGIs over 200k)
Profit/loss from business: +$10,917 (reported on 15.6% of returns)
Here:
+$10,917
State:
+$11,523
(% of AGI for various income ranges: 6.6% for AGIs below $25k, 4.0% for AGIs $25k-50k, 2.2% for AGIs $50k-75k, 2.9% for AGIs $75k-100k, 1.9% for AGIs $100k-200k, 1.2% for AGIs over 200k)
Taxable individual retirement arrangement distribution: $15,980 (reported on 13.2% of returns)
48065:
$15,980
Michigan:
$15,298
(% of AGI for various income ranges: 3.5% for AGIs below $25k, 2.9% for AGIs $25k-50k, 4.1% for AGIs $50k-75k, 4.1% for AGIs $75k-100k, 2.7% for AGIs $100k-200k, 1.9% for AGIs over 200k)
Total itemized deductions: $24,250 (17% of AGI, reported on 40.3% of returns)
Here:
$24,250
State:
$21,628
Here:
16.8% of AGI
State:
18.4% of AGI
(% of AGI for various income ranges: 12.4% for AGIs below $25k, 11.7% for AGIs $25k-50k, 12.9% for AGIs $50k-75k, 14.8% for AGIs $75k-100k, 15.7% for AGIs $100k-200k, 9.9% for AGIs over 200k)
Charity contributions: $3,367 (reported on 36.3% of returns)
Here:
$3,367
State:
$4,225
(% of AGI for various income ranges: 1.0% for AGIs below $25k, 1.2% for AGIs $25k-50k, 1.4% for AGIs $50k-75k, 2.0% for AGIs $75k-100k, 2.0% for AGIs $100k-200k, 1.4% for AGIs over 200k)
Taxes paid: $9,832 (reported on 40.3% of returns)
48065:
$9,832
State:
$8,327
(% of AGI for various income ranges: 2.8% for AGIs below $25k, 3.2% for AGIs $25k-50k, 4.3% for AGIs $50k-75k, 5.2% for AGIs $75k-100k, 6.4% for AGIs $100k-200k, 5.2% for AGIs over 200k)
Earned income credit: $1,995 (reported on 10.7% of returns)
Here:
$1,995
State:
$2,306
(% of AGI for various income ranges: 3.8% for AGIs below $25k, 0.8% for AGIs $25k-50k)
Percentage of individuals using paid preparers for their 2012 taxes: 59.5%
Here:
60%
State:
57%
(% for various income ranges: 53.2% for AGIs below $25k, 55.6% for AGIs $25k-50k, 67.7% for AGIs $50k-75k, 64.8% for AGIs $75k-100k, 64.1% for AGIs $100k-200k, 76.0% for AGIs over 200k)
Averages for the 2004 tax year for zip code 48065, filed in 2005:
Average Adjusted Gross Income (AGI) in 2004: $61,866 (Individual Income Tax Returns)
Here:
$61,866
State:
$48,204
Salary/wage: $52,937 (reported on 86.3% of returns)
Here:
$52,937
State:
$42,791
(% of AGI for various income ranges: 125.1% for AGIs below $10k, 66.3% for AGIs $10k-25k, 74.3% for AGIs $25k-50k, 78.4% for AGIs $50k-75k, 82.9% for AGIs $75k-100k, 69.2% for AGIs over 100k)
Taxable interest for individuals: $2,246 (reported on 56.8% of returns)
This zip code:
$2,246
Michigan:
$1,725
(% of AGI for various income ranges: 7.6% for AGIs below $10k, 3.6% for AGIs $10k-25k, 2.0% for AGIs $25k-50k, 2.1% for AGIs $50k-75k, 1.5% for AGIs $75k-100k, 2.0% for AGIs over 100k)
Taxable dividends: $2,284 (reported on 33.6% of returns)
Here:
$2,284
State:
$3,420
(% of AGI for various income ranges: 5.4% for AGIs below $10k, 2.0% for AGIs $10k-25k, 1.1% for AGIs $25k-50k, 1.1% for AGIs $50k-75k, 1.0% for AGIs $75k-100k, 1.2% for AGIs over 100k)
Net capital gain/loss: +$8,501 (reported on 26.1% of returns)
Here:
+$8,501
State:
+$8,532
(% of AGI for various income ranges: -3.8% for AGIs below $10k, -0.1% for AGIs $10k-25k, -0.4% for AGIs $25k-50k, 0.6% for AGIs $50k-75k, 1.1% for AGIs $75k-100k, 6.4% for AGIs over 100k)
Profit/loss from business: +$9,874 (reported on 13.7% of returns)
Here:
+$9,874
State:
+$9,547
(% of AGI for various income ranges: 4.2% for AGIs below $10k, 5.1% for AGIs $10k-25k, 3.3% for AGIs $25k-50k, 1.4% for AGIs $50k-75k, 2.6% for AGIs $75k-100k, 1.7% for AGIs over 100k)
IRA payment deduction: $3,217 (reported on 2.9% of returns)
48065:
$3,217
Michigan:
$2,875
(% of AGI for various income ranges: 0.3% for AGIs $10k-25k, 0.2% for AGIs $25k-50k, 0.3% for AGIs $50k-75k, 0.1% for AGIs $75k-100k, 0.1% for AGIs over 100k)
Self-employed pension: $12,893 (reported on 0.6% of returns)
Here:
$12,893
Michigan:
$13,826
Total itemized deductions: $20,886 (20% of AGI, reported on 47.2% of returns)
Here:
$20,886
State:
$18,509
Here:
20.0% of AGI
State:
20.7% of AGI
(% of AGI for various income ranges: 18.0% for AGIs below $10k, 12.3% for AGIs $10k-25k, 16.3% for AGIs $25k-50k, 19.4% for AGIs $50k-75k, 18.3% for AGIs $75k-100k, 14.5% for AGIs over 100k)
Charity contributions deductions: $2,952 (3% of AGI, reported on 44.0% of returns)
Here:
$2,952
State:
$3,365
Here:
2.7% of AGI
State:
3.6% of AGI
(% of AGI for various income ranges: 0.8% for AGIs below $10k, 1.3% for AGIs $10k-25k, 1.7% for AGIs $25k-50k, 2.2% for AGIs $50k-75k, 2.3% for AGIs $75k-100k, 2.2% for AGIs over 100k)
Total tax: $10,328 (reported on 78.6% of returns)
48065:
$10,328
State:
$7,691
(% of AGI for various income ranges: 3.5% for AGIs below $10k, 4.5% for AGIs $10k-25k, 7.2% for AGIs $25k-50k, 8.3% for AGIs $50k-75k, 9.7% for AGIs $75k-100k, 17.6% for AGIs over 100k)
Earned income credit: $1,572 (reported on 8.4% of returns)
Here:
$1,572
State:
$1,737
Percentage of individuals using paid preparers for their 2004 taxes: 60.5%
Here:
61%
State:
60%
(% for various income ranges: 49.7% for AGIs below $10k, 58.9% for AGIs $10k-25k, 63.0% for AGIs $25k-50k, 70.3% for AGIs $50k-75k, 59.9% for AGIs $75k-100k, 65.6% for AGIs over 100k)
Household received Food Stamps/SNAP in the past 12 months: 300 Household did not receive Food Stamps/SNAP in the past 12 months: 4,406
Women who had a birth in the past 12 months: 70 (54 now married, 16 unmarried) Women who did not have a birth in the past 12 months: 2,237 (1,041 now married, 1,192 unmarried)
Housing units in zip code 48065 with a mortgage: 2,498 (218 second mortgage, 204 both second mortgage and home equity loan) Houses without a mortgage: 119
Median monthly owner costs for units with a mortgage: $1,783 Median monthly owner costs for units without a mortgage: $669
Residents with income below the poverty level in 2022:
This zip code:
5.8%
Whole state:
13.4%
Residents with income below 50% of the poverty level in 2022:
This zip code:
2.8%
Whole state:
6.9%
Median number of rooms in houses and condos:
Here:
6.7
State:
6.5
Median number of rooms in apartments:
Here:
4.2
State:
4.3
Notable locations in this zip code not listed on our city pages
Notable locations in zip code 48065: Bruce Hills Golf Course (A), Heather Hills Golf Course (B), Simpson Park Campground (C), Romeo Nursing Center (D), Romeo District Library (E), Romeo Village Police Department (F), Romeo Historical Society Museum (G), Bancroft Museum (H), Bruce Township Fire Department Station 1 Headquarters (I), Saint Joseph's Mercy Macomb North (J), Bruce Township Fire Department Station 2 (K), Bruce Township Fire Department Station 3 (L). Display/hide their locations on the map
Churches in zip code 48065 include: Marantha Assembly of God Church (A), River of God Community Church (B), Harvest Fellowship of Romeo (C), Romeo Church of Christ (D), Jesus Baptist Detroit Church (E), Saint John Lutheran Church (F), Saint Clement Catholic Church (G), Second Baptist Church (H), Romeo First Church of God (I). Display/hide their locations on the map
Cemeteries: Goodrich Cemetery (1), Bruce and Armada Cemetery (2), Bruce Cemetery (3), Romeo Cemetery (4), McCafferty Cemetery (5), Cooley Cemetery (6). Display/hide their locations on the map
Parks in zip code 48065 include: Simpson Park Campground Historical Marker (1), Village of Romeo Historical Marker (2), Village Park (3). Display/hide their locations on the map
In group quarters: 118 (-1 institutionalized population)
Size of family households: 1,568 2-persons, 560 3-persons, 560 4-persons, 285 5-persons, 88 6-persons, 31 7-or-more-persons
Size of nonfamily households: 1,303 1-person, 307 2-persons, 23 3-persons
1,666 married couples with children.
373 single-parent households (147 men, 226 women).
92.6% of residents of 48065 zip code speak English at home.
4.9% of residents speak Spanish at home (51% very well, 13% well, 11% not well, 25% not at all).
2.5% of residents speak other Indo-European language at home (81% very well, 14% well, 5% not well).
0.3% of residents speak Asian or Pacific Island language at home (100% very well).
Foreign born population: 581 (5.2%) (60.9% of them are naturalized citizens)
This zip code:
5.2%
Whole state:
6.9%
33%Honduras
9%Poland
7%Greece
5%Sweden
5%France
5%United Kingdom, excluding England and Scotland
3%Japan
16%German
11%English
11%Italian
9%American
7%Irish
7%Polish
5%European
Year of entry for the foreign-born population
1092010 or later
1302000 to 2009
1171990 to 1999
229Before 1990
Major facilities with environmental interests located in this zip code:
FORD MOTOR COMPANY ROMEO ENGINE PLANT (701 E. 32 MILE RD. in ROMEO, MI)
AIR MAJOR (AIRS/AFS) (Integrated Compliance Information System) - ICIS-05-1986-0407, FORMAL ENFORCEMENT ACTION, ICIS-05-1984-0087, CRITERIA AND HAZARDOUS AIR POLLUTANT INVENTORY (Inventory of air pollution sources) HAZARDOUS WASTE BIENNIAL REPORTER (Resource Conservation and Recovery Act (tracking hazardous waste)) Large Quantity Generators, more that 1000 kg of hazardous waste/month (Resource Conservation and Recovery Act (tracking hazardous waste)) TSD (Resource Conservation and Recovery Act (tracking hazardous waste)) TRI REPORTER (Tracking of toxic chemicals releasing facilities) Business SIC classification: GENERAL CONTRACTORS-INDUSTRIAL BUILDINGS AND WAREHOUSES; MOTOR VEHICLE PARTS AND ACCESSORIES; REFUSE SYSTEMS Business NAICS classification: GASOLINE ENGINE AND ENGINE PARTS MANUFACTURING. Alternative names: ROMEO ENGINE PLT
AMANDA MOORE ELEMENTARY SCHOOL (209 DICKINSON STREET in ROMEO, MI)
(National Center for Education Statistics) - STATE ID-06119 Organizations: ROMEO COMMUNITY SCHOOLS (SCHOOL DISTRICT)
FORD-MICHIGAN PROVING GROUNDS (74240 FISHER ROAD in ROMEO, MI)
National Pollutant Discharge Elimination System NON-MAJOR (Tracking pollutant discharge elimination systems) - permit HAZARDOUS WASTE BIENNIAL REPORTER (Resource Conservation and Recovery Act (tracking hazardous waste)) Small Quantity Generators, between 100 kg and 1000 kg of hazardous waste/month (Resource Conservation and Recovery Act (tracking hazardous waste)) Business SIC classification: TESTING LABORATORIES Organizations: FORD MICHIGAN PROVING GROUNDS (CONTACT/OPERATOR)
, FORD MOTOR CO (CONTACT/OPERATOR)
Alternative names: FORD MICHIGAN PROVING GROUND, FORD MOTOR CO MICHIGAN PROVING GROUND
ENTERPRISE HIGH SCHOOL (297 PROSPECT in ROMEO, MI)
(National Center for Education Statistics) - STATE ID-09159 Organizations: ROMEO COMMUNITY SCHOOLS (SCHOOL DISTRICT)
AMOCO OIL CO (200 MAIN in ROMEO, MI)
(Resource Conservation and Recovery Act (tracking hazardous waste)) Organizations: AMOCO OIL COMPANY (CONTACT/OWNER)
, BP PRODUCTS NORTH AMERICA (CONTACT/OWNER)
Alternative names: AMOCO OIL CO 5178
GREAT LAKES OIL RECOVERY INC (167 S MAIN ST in ROMEO, MI)
Large Quantity Generators, more that 1000 kg of hazardous waste/month (Resource Conservation and Recovery Act (tracking hazardous waste)) USED OIL PROGRAM (Resource Conservation and Recovery Act (tracking hazardous waste)) Business NAICS classification: HAZARDOUS WASTE COLLECTION.; OTHER WASTE COLLECTION. Organizations: JOHN VICO (CONTACT/OWNER)
A A FURNITURE LTD (453 E ST CLAIR in ROMEO, MI)
(Resource Conservation and Recovery Act (tracking hazardous waste)) Organizations: TUCHOLSKI MARK AND SUSAN (CONTACT/OWNER)
BLUE WATER TRUCKING INC (64900 VAN DYKE in ROMEO, MI)
(Resource Conservation and Recovery Act (tracking hazardous waste))
AMERICAN AGGREGATES OF MICHIGAN INC (2101 INWOOD RD in ROMEO, MI)
AIR MINOR (AIRS/AFS) Business SIC classification: CONSTRUCTION SAND AND GRAVEL
ARMADA IND PARK (THIRTY TWO MILE EAST OF POWELL in ROMEO, MI)
National Pollutant Discharge Elimination System NON-MAJOR (Tracking pollutant discharge elimination systems) - permit Business SIC classification: SEWERAGE SYSTEMS
86.7%Utility gas
6.4%Electricity
4.0%Bottled, tank, or LP gas
1.8%Wood
0.6%Other fuel
Population in 1990: 13,552.
Place of birth for U.S.-born residents:
This state: 9,503
Northeast: 319
Midwest: 329
South: 380
West: 130
61% of the 48065 zip code residents lived in the same house 5 years ago. Out of people who lived in different houses, 69% lived in this county. Out of people who lived in different counties, 50% lived in Michigan.
88% of the 48065 zip code residents lived in the same house 1 year ago. Out of people who lived in different houses, 55% moved from this county. Out of people who lived in different houses, 32% moved from different county within same state. Out of people who lived in different houses, 3% moved from different state. Out of people who lived in different houses, 7% moved from abroad.
Private vs. public school enrollment:
Students in private schools in grades 1 to 8 (elementary and middle school): 184
Here:
18.0%
Michigan:
12.4%
Students in private schools in grades 9 to 12 (high school): 56
Here:
9.9%
Michigan:
9.8%
Students in private undergraduate colleges: 38
Here:
12.8%
Michigan:
14.9%
Occupation by median earnings in the past 12 months ($)
118,035Fire fighting and prevention, and other protective service workers including supervisors
113,763Computer and mathematical occupations
109,329Architecture and engineering occupations
104,975Management occupations
86,475Health diagnosing and treating practitioners and other technical occupations
78,033Legal occupations
Companies with federal contracts located in this zip code:
AUTOEXCELL LLC (214 E SAINT CLAIR ST in ROMEO, MI; small business) : $997,475 in 2 contractsfrom 2004 to 2005
$994,029 with Defense Logistics Agency for Vehicular Brake, Steering, Axle, Wheel, and Track Components. Signed on 2004-09-12. Completion date: 2005-04-04.
$3,446, same as above.Signed on 2005-10-27. Completion date: 2005-12-01.
ROMEO-RIM, INC (74000 VAN DYKE RD in ROMEO, MI) : $446,532 in 13 contractsfrom 2002 to 2005
Contracts for Marine Hardware and Hull Items by Defense Logistics Agency Signed by year:2000: $0; 2001: $0; 2002: $171,251; 2003: $92,328; 2004: $24,095; 2005: $158,858; 2006: $0.
Biggest contracts:
$171,251 with Defense Logistics Agency for Marine Hardware and Hull Items. Signed on 2002-05-15. Completion date: 2003-05-15.
$102,216, same as above.Signed on 2005-10-20. Completion date: 2005-12-06.
$47,947, same as above.Signed on 2003-12-11. Completion date: 2004-01-10.
$44,381, same as above.Signed on 2003-12-11. Completion date: 2004-02-10.
Top industries in this zip code by the number of employees in 2005:
Administrative and Support and Waste Management and Remediation Services: Professional Employer Organizations (100-249 employees: 2 establishments, 50-99 employees: 1 establishment)
Wholesale Trade: Other Chemical and Allied Products Merchant Wholesalers (100-249: 1, 5-9: 1)
Administrative and Support and Waste Management and Remediation Services: Packaging and Labeling Services (100-249: 1)
Professional, Scientific, and Technical Services: Research and Development in the Physical, Engineering, and Life Sciences (100-249: 1)
People in group quarters in 2010:
56 people in nursing facilities/skilled-nursing facilities
27 people in group homes intended for adults
6 people in residential treatment centers for adults
People in group quarters in 2000:
61 people in nursing homes
11 people in homes for the mentally retarded
11 people in other group homes
6 people in homes for the mentally ill
5 people in agriculture workers' dormitories on farms
Fatal accident statistics in 2014:
Fatal accident count: 2
Vehicles involved in fatal accidents: 4
Fatal accidents caused by drunken drivers: 0
Fatalities: 3
Persons involved in fatal accidents: 6
Pedestrians involved in fatal accidents: 0
Fatal accident statistics in 2012:
Fatal accident count: 2
Vehicles involved in fatal accidents: 5
Fatal accidents caused by drunken drivers: 0
Fatalities: 2
Persons involved in fatal accidents: 6
Pedestrians involved in fatal accidents: 0
Home Mortgage Disclosure Act Aggregated Statistics For Year 2009 (Based on 4 full and 2 partial tracts)
A) FHA, FSA/RHS & VA Home Purchase Loans
B) Conventional Home Purchase Loans
C) Refinancings
D) Home Improvement Loans
E) Loans on Dwellings For 5+ Families
F) Non-occupant Loans on < 5 Family Dwellings (A B C & D)
G) Loans On Manufactured Home Dwelling (A B C & D)
Number
Average Value
Number
Average Value
Number
Average Value
Number
Average Value
Number
Average Value
Number
Average Value
Number
Average Value
LOANS ORIGINATED
57
$131,070
76
$165,555
350
$184,500
8
$52,850
2
$249,480
14
$85,791
15
$35,292
APPLICATIONS APPROVED, NOT ACCEPTED
0
$0
15
$107,359
45
$199,522
2
$24,555
0
$0
2
$168,355
9
$29,722
APPLICATIONS DENIED
31
$145,914
22
$168,101
147
$223,621
12
$27,475
0
$0
12
$116,958
4
$30,408
APPLICATIONS WITHDRAWN
6
$156,492
16
$208,476
61
$202,064
0
$0
0
$0
2
$82,505
0
$0
FILES CLOSED FOR INCOMPLETENESS
2
$40,270
2
$220,730
24
$234,108
0
$0
0
$0
0
$0
0
$0
Aggregated Statistics For Year 2008 (Based on 4 full and 2 partial tracts)
A) FHA, FSA/RHS & VA Home Purchase Loans
B) Conventional Home Purchase Loans
C) Refinancings
D) Home Improvement Loans
F) Non-occupant Loans on < 5 Family Dwellings (A B C & D)
G) Loans On Manufactured Home Dwelling (A B C & D)
Number
Average Value
Number
Average Value
Number
Average Value
Number
Average Value
Number
Average Value
Number
Average Value
LOANS ORIGINATED
31
$168,222
105
$159,868
196
$194,646
16
$15,661
18
$114,576
23
$41,995
APPLICATIONS APPROVED, NOT ACCEPTED
2
$203,980
36
$100,788
47
$223,616
8
$13,226
4
$107,280
20
$33,944
APPLICATIONS DENIED
10
$115,114
25
$144,962
175
$201,504
10
$41,760
10
$90,488
12
$47,132
APPLICATIONS WITHDRAWN
2
$134,685
16
$133,359
63
$253,978
2
$220,730
2
$308,970
6
$37,997
FILES CLOSED FOR INCOMPLETENESS
2
$118,845
0
$0
12
$361,096
0
$0
0
$0
0
$0
Aggregated Statistics For Year 2007 (Based on 4 full and 2 partial tracts)
A) FHA, FSA/RHS & VA Home Purchase Loans
B) Conventional Home Purchase Loans
C) Refinancings
D) Home Improvement Loans
E) Loans on Dwellings For 5+ Families
F) Non-occupant Loans on < 5 Family Dwellings (A B C & D)
G) Loans On Manufactured Home Dwelling (A B C & D)
Number
Average Value
Number
Average Value
Number
Average Value
Number
Average Value
Number
Average Value
Number
Average Value
Number
Average Value
LOANS ORIGINATED
6
$127,032
199
$157,771
401
$208,150
39
$58,603
4
$898,222
20
$193,886
24
$39,828
APPLICATIONS APPROVED, NOT ACCEPTED
2
$130,635
38
$201,560
102
$244,545
19
$29,069
0
$0
6
$133,653
8
$30,748
APPLICATIONS DENIED
2
$78,565
63
$170,747
294
$249,623
22
$72,599
0
$0
22
$247,901
21
$27,965
APPLICATIONS WITHDRAWN
0
$0
16
$138,750
90
$225,290
2
$19,645
0
$0
4
$238,975
2
$40,995
FILES CLOSED FOR INCOMPLETENESS
0
$0
10
$218,489
45
$294,019
0
$0
0
$0
4
$309,970
0
$0
Aggregated Statistics For Year 2006 (Based on 4 full and 2 partial tracts)
A) FHA, FSA/RHS & VA Home Purchase Loans
B) Conventional Home Purchase Loans
C) Refinancings
D) Home Improvement Loans
F) Non-occupant Loans on < 5 Family Dwellings (A B C & D)
G) Loans On Manufactured Home Dwelling (A B C & D)
Number
Average Value
Number
Average Value
Number
Average Value
Number
Average Value
Number
Average Value
Number
Average Value
LOANS ORIGINATED
8
$184,004
313
$199,781
548
$197,365
51
$43,888
45
$168,786
8
$21,819
APPLICATIONS APPROVED, NOT ACCEPTED
0
$0
19
$141,706
102
$161,899
28
$54,638
0
$0
4
$17,770
APPLICATIONS DENIED
0
$0
62
$187,029
282
$221,961
30
$57,408
12
$173,714
23
$29,952
APPLICATIONS WITHDRAWN
0
$0
55
$194,666
130
$177,763
6
$100,512
2
$123,990
0
$0
FILES CLOSED FOR INCOMPLETENESS
0
$0
2
$127,685
57
$190,362
0
$0
2
$296,970
0
$0
Aggregated Statistics For Year 2005 (Based on 4 full and 2 partial tracts)
A) FHA, FSA/RHS & VA Home Purchase Loans
B) Conventional Home Purchase Loans
C) Refinancings
D) Home Improvement Loans
F) Non-occupant Loans on < 5 Family Dwellings (A B C & D)
G) Loans On Manufactured Home Dwelling (A B C & D)
Number
Average Value
Number
Average Value
Number
Average Value
Number
Average Value
Number
Average Value
Number
Average Value
LOANS ORIGINATED
14
$135,404
344
$179,880
676
$205,785
53
$141,009
34
$174,534
30
$58,746
APPLICATIONS APPROVED, NOT ACCEPTED
2
$67,995
39
$216,944
122
$223,263
4
$362,462
6
$159,308
8
$28,904
APPLICATIONS DENIED
2
$32,735
81
$139,084
316
$232,563
41
$72,710
28
$170,612
44
$31,703
APPLICATIONS WITHDRAWN
0
$0
41
$158,503
169
$198,976
12
$121,957
8
$121,730
0
$0
FILES CLOSED FOR INCOMPLETENESS
0
$0
13
$118,581
85
$221,696
4
$180,755
4
$320,468
7
$42,490
Aggregated Statistics For Year 2004 (Based on 4 full and 2 partial tracts)
A) FHA, FSA/RHS & VA Home Purchase Loans
B) Conventional Home Purchase Loans
C) Refinancings
D) Home Improvement Loans
F) Non-occupant Loans on < 5 Family Dwellings (A B C & D)
G) Loans On Manufactured Home Dwelling (A B C & D)
Number
Average Value
Number
Average Value
Number
Average Value
Number
Average Value
Number
Average Value
Number
Average Value
LOANS ORIGINATED
20
$155,478
383
$164,794
813
$196,414
37
$104,059
26
$134,475
72
$39,317
APPLICATIONS APPROVED, NOT ACCEPTED
0
$0
138
$95,967
159
$156,360
22
$77,255
6
$132,872
122
$47,019
APPLICATIONS DENIED
4
$153,428
266
$53,573
254
$201,270
27
$65,708
4
$209,350
240
$37,048
APPLICATIONS WITHDRAWN
0
$0
55
$190,949
157
$168,618
15
$57,293
2
$167,985
0
$0
FILES CLOSED FOR INCOMPLETENESS
0
$0
14
$41,566
66
$211,837
6
$169,033
4
$338,325
12
$26,829
Aggregated Statistics For Year 2003 (Based on 4 full and 2 partial tracts)
A) FHA, FSA/RHS & VA Home Purchase Loans
B) Conventional Home Purchase Loans
C) Refinancings
D) Home Improvement Loans
F) Non-occupant Loans on < 5 Family Dwellings (A B C & D)
Number
Average Value
Number
Average Value
Number
Average Value
Number
Average Value
Number
Average Value
LOANS ORIGINATED
16
$142,463
344
$216,697
2,208
$183,838
39
$35,723
43
$149,063
APPLICATIONS APPROVED, NOT ACCEPTED
0
$0
35
$257,303
225
$171,593
8
$14,352
8
$97,484
APPLICATIONS DENIED
2
$150,985
58
$111,215
511
$170,613
27
$14,629
12
$130,782
APPLICATIONS WITHDRAWN
0
$0
35
$137,699
302
$173,795
4
$161,262
8
$115,002
FILES CLOSED FOR INCOMPLETENESS
2
$209,980
2
$60,895
187
$161,562
4
$82,492
0
$0
Aggregated Statistics For Year 2002 (Based on 2 full tracts)
A) FHA, FSA/RHS & VA Home Purchase Loans
B) Conventional Home Purchase Loans
C) Refinancings
D) Home Improvement Loans
F) Non-occupant Loans on < 5 Family Dwellings (A B C & D)
Number
Average Value
Number
Average Value
Number
Average Value
Number
Average Value
Number
Average Value
LOANS ORIGINATED
2
$184,655
14
$149,154
65
$132,642
2
$2,945
4
$100,675
APPLICATIONS APPROVED, NOT ACCEPTED
0
$0
0
$0
8
$106,814
0
$0
0
$0
APPLICATIONS DENIED
0
$0
0
$0
20
$160,884
0
$0
0
$0
APPLICATIONS WITHDRAWN
0
$0
2
$125,720
24
$157,561
4
$14,732
0
$0
FILES CLOSED FOR INCOMPLETENESS
0
$0
0
$0
41
$184,366
0
$0
0
$0
Aggregated Statistics For Year 2001 (Based on 2 full tracts)
A) FHA, FSA/RHS & VA Home Purchase Loans
B) Conventional Home Purchase Loans
C) Refinancings
D) Home Improvement Loans
Number
Average Value
Number
Average Value
Number
Average Value
Number
Average Value
LOANS ORIGINATED
2
$119,830
12
$118,682
61
$133,289
6
$24,882
APPLICATIONS APPROVED, NOT ACCEPTED
0
$0
0
$0
10
$142,615
6
$33,722
APPLICATIONS DENIED
0
$0
2
$172,865
10
$38,699
0
$0
APPLICATIONS WITHDRAWN
0
$0
2
$275,015
6
$132,925
0
$0
FILES CLOSED FOR INCOMPLETENESS
0
$0
0
$0
0
$0
0
$0
Aggregated Statistics For Year 2000 (Based on 2 full tracts)
A) FHA, FSA/RHS & VA Home Purchase Loans
B) Conventional Home Purchase Loans
C) Refinancings
D) Home Improvement Loans
F) Non-occupant Loans on < 5 Family Dwellings (A B C & D)
Number
Average Value
Number
Average Value
Number
Average Value
Number
Average Value
Number
Average Value
LOANS ORIGINATED
6
$118,847
45
$116,118
20
$125,918
4
$36,342
0
$0
APPLICATIONS APPROVED, NOT ACCEPTED
0
$0
79
$42,197
14
$118,986
0
$0
0
$0
APPLICATIONS DENIED
0
$0
568
$39,869
12
$128,341
2
$2,945
2
$93,310
APPLICATIONS WITHDRAWN
0
$0
8
$71,455
6
$88,725
2
$49,110
0
$0
FILES CLOSED FOR INCOMPLETENESS
0
$0
2
$105,095
8
$120,074
0
$0
0
$0
Aggregated Statistics For Year 1999 (Based on 1 full and 1 partial tracts)
A) FHA, FSA/RHS & VA Home Purchase Loans
B) Conventional Home Purchase Loans
C) Refinancings
D) Home Improvement Loans
F) Non-occupant Loans on < 5 Family Dwellings (A B C & D)
2002 - 2018 National Fire Incident Reporting System (NFIRS) incidents
Based on the data from the years 2002 - 2018 the average number of fire incidents per year is 20. The highest number of fires - 44 took place in 2015, and the least - 10 in 2011. The data has a rising trend.
When looking into fire subcategories, the most reports belonged to: Structure Fires (45.5%), and Outside Fires (31.3%).
Fire incident types reported to NFIRS in Zip Code 48065


 Nearest zip codes: 48095, 48003, 48367, 48094, 48005, 48363.


 Based on the data from the years 2002 - 2018 the average number of fire incidents per year is 20. The highest number of fires - 44 took place in 2015, and the least - 10 in 2011. The data has a rising trend.
 When looking into fire subcategories, the most reports belonged to: Structure Fires (45.5%), and Outside Fires (31.3%).