Estimated zip code population in 2022: 5,304 Zip code population in 2010: 5,379 Zip code population in 2000: 5,252
Houses and condos: 1,858 Renter-occupied apartments: 163
% of renters here:
9%
State:
27%
March 2022 cost of living index in zip code 48005: 91.0 (less than average, U.S. average is 100)
Land area: 36.5 sq. mi. Water area: 0.1 sq. mi.
Population density: 145 people per square mile
(very low).
OSM Map
General Map
Google Map
MSN Map
OSM Map
General Map
Google Map
MSN Map
OSM Map
General Map
Google Map
MSN Map
OSM Map
General Map
Google Map
MSN Map
Please wait while loading the map...
Real estate property taxes paid for housing units in 2022:
This zip code:
1.1% ($3,419)
Michigan:
1.2% ($2,746)
Median real estate property taxes paid for housing units with mortgages in 2022: $3,476 (1.1%) Median real estate property taxes paid for housing units with no mortgage in 2022: $3,290 (1.1%)
Estimated median house/condo value in 2022: $323,042
48005:
$323,042
Michigan:
$224,400
According to our research of Michigan and other state lists, there were 4 registered sex offenders living in 48005 zip code as of May 23, 2024. The ratio of all residents to sex offenders in zip code 48005 is 1,387 to 1. The ratio of registered sex offenders to all residents in this zip code is much lower than the state average.
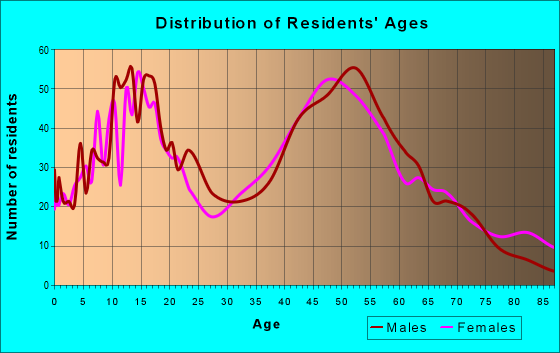
Median resident age:
This zip code:
45.0 years
Michigan median age:
40.3 years
Average household size:
This zip code:
2.8 people
Michigan:
2.4 people
Averages for the 2020 tax year for zip code 48005, filed in 2021:
Average Adjusted Gross Income (AGI) in 2020: $79,141 (Individual Income Tax Returns)
Here:
$79,141
State:
$68,945
Salary/wage: $64,444 (reported on 76.7% of returns)
Here:
$64,444
State:
$57,142
(% of AGI for various income ranges: 911.2% for AGIs below $25k, 3001.6% for AGIs $25k-50k, 5891.1% for AGIs $50k-75k, 9025.7% for AGIs $75k-100k, 16810.0% for AGIs $100k-200k, 55537.5% for AGIs over 200k)
Taxable interest for individuals: $1,364 (reported on 35.6% of returns)
This zip code:
$1,364
Michigan:
$1,630
(% of AGI for various income ranges: 33.7% for AGIs below $25k, 31.6% for AGIs $25k-50k, 40.7% for AGIs $50k-75k, 53.9% for AGIs $75k-100k, 109.4% for AGIs $100k-200k, 1030.0% for AGIs over 200k)
Ordinary dividends: $3,538 (reported on 23.3% of returns)
Here:
$3,538
State:
$6,972
(% of AGI for various income ranges: 36.7% for AGIs below $25k, 55.9% for AGIs $25k-50k, 77.1% for AGIs $50k-75k, 157.4% for AGIs $75k-100k, 96.0% for AGIs $100k-200k, 2310.0% for AGIs over 200k)
Net capital gain/loss in AGI: +$5,742 (reported on 21.5% of returns)
Here:
+$5,742
State:
+$20,064
(% of AGI for various income ranges: 5.1% for AGIs below $25k, 48.0% for AGIs $25k-50k, 81.8% for AGIs $50k-75k, 97.0% for AGIs $75k-100k, 360.6% for AGIs $100k-200k, 3595.0% for AGIs over 200k)
Profit/loss from business: +$8,405 (reported on 16.0% of returns)
Here:
+$8,405
State:
+$11,172
(% of AGI for various income ranges: 91.2% for AGIs below $25k, 130.2% for AGIs $25k-50k, 186.4% for AGIs $50k-75k, 113.9% for AGIs $75k-100k, 463.1% for AGIs $100k-200k, 682.5% for AGIs over 200k)
Taxable individual retirement arrangement distribution: $14,764 (reported on 13.1% of returns)
48005:
$14,764
Michigan:
$19,803
(% of AGI for various income ranges: 79.6% for AGIs below $25k, 185.2% for AGIs $25k-50k, 218.9% for AGIs $50k-75k, 370.4% for AGIs $75k-100k, 755.7% for AGIs $100k-200k)
Total itemized deductions: $31,158 (reported on 6.9% of returns)
Here:
$31,158
State:
$34,117
(% of AGI for various income ranges: 161.4% for AGIs $25k-50k, 274.6% for AGIs $50k-75k, 465.2% for AGIs $75k-100k, 637.1% for AGIs $100k-200k, 2852.5% for AGIs over 200k)
Charity contributions: $5,588 (reported on 5.8% of returns)
Here:
$5,588
State:
$13,548
(% of AGI for various income ranges: 85.7% for AGIs $50k-75k, 42.2% for AGIs $75k-100k, 159.1% for AGIs $100k-200k)
Taxes paid: $7,842 (reported on 6.9% of returns)
48005:
$7,842
State:
$7,972
(% of AGI for various income ranges: 30.5% for AGIs $25k-50k, 77.1% for AGIs $50k-75k, 120.0% for AGIs $75k-100k, 184.0% for AGIs $100k-200k, 550.0% for AGIs over 200k)
Earned income credit: $1,794 (reported on 6.5% of returns)
Here:
$1,794
State:
$2,251
(% of AGI for various income ranges: 33.3% for AGIs below $25k, 36.4% for AGIs $25k-50k)
Percentage of individuals using paid preparers for their 2020 taxes: 93.1%
Here:
93%
State:
93%
(% for various income ranges: 90.9% for AGIs below $25k, 93.1% for AGIs $25k-50k, 95.0% for AGIs $50k-75k, 93.9% for AGIs $75k-100k, 94.5% for AGIs $100k-200k, 91.7% for AGIs over 200k)
Averages for the 2012 tax year for zip code 48005, filed in 2013:
Average Adjusted Gross Income (AGI) in 2012: $58,110 (Individual Income Tax Returns)
Here:
$58,110
State:
$55,609
Salary/wage: $50,707 (reported on 84.3% of returns)
Here:
$50,707
State:
$46,782
(% of AGI for various income ranges: 66.6% for AGIs below $25k, 70.3% for AGIs $25k-50k, 72.9% for AGIs $50k-75k, 76.5% for AGIs $75k-100k, 82.2% for AGIs $100k-200k, 48.3% for AGIs over 200k)
Taxable interest for individuals: $908 (reported on 40.2% of returns)
This zip code:
$908
Michigan:
$1,491
(% of AGI for various income ranges: 1.5% for AGIs below $25k, 1.2% for AGIs $25k-50k, 0.5% for AGIs $50k-75k, 0.5% for AGIs $75k-100k, 0.4% for AGIs $100k-200k, 0.5% for AGIs over 200k)
Ordinary dividends: $3,253 (reported on 23.0% of returns)
Here:
$3,253
State:
$6,225
(% of AGI for various income ranges: 2.1% for AGIs below $25k, 1.4% for AGIs $25k-50k, 0.6% for AGIs $50k-75k, 0.5% for AGIs $75k-100k, 0.6% for AGIs $100k-200k, 5.4% for AGIs over 200k)
Net capital gain/loss in AGI: +$669 (reported on 17.2% of returns)
Here:
+$669
State:
+$9,326
(% of AGI for various income ranges: 0.1% for AGIs $25k-50k, 0.3% for AGIs $75k-100k, 0.3% for AGIs $100k-200k, 0.7% for AGIs over 200k)
Profit/loss from business: +$8,195 (reported on 14.9% of returns)
Here:
+$8,195
State:
+$11,523
(% of AGI for various income ranges: 6.1% for AGIs below $25k, 4.1% for AGIs $25k-50k, 1.9% for AGIs $50k-75k, 1.3% for AGIs $75k-100k, 1.8% for AGIs $100k-200k)
Taxable individual retirement arrangement distribution: $12,116 (reported on 11.9% of returns)
48005:
$12,116
Michigan:
$15,298
(% of AGI for various income ranges: 3.8% for AGIs below $25k, 2.8% for AGIs $25k-50k, 2.1% for AGIs $50k-75k, 3.2% for AGIs $75k-100k, 2.6% for AGIs $100k-200k)
Total itemized deductions: $18,859 (20% of AGI, reported on 38.7% of returns)
Here:
$18,859
State:
$21,628
Here:
19.9% of AGI
State:
18.4% of AGI
(% of AGI for various income ranges: 10.6% for AGIs below $25k, 11.0% for AGIs $25k-50k, 14.0% for AGIs $50k-75k, 14.1% for AGIs $75k-100k, 12.7% for AGIs $100k-200k, 10.0% for AGIs over 200k)
Charity contributions: $2,351 (reported on 33.3% of returns)
Here:
$2,351
State:
$4,225
(% of AGI for various income ranges: 1.0% for AGIs below $25k, 1.0% for AGIs $25k-50k, 1.5% for AGIs $50k-75k, 1.6% for AGIs $75k-100k, 1.3% for AGIs $100k-200k, 1.4% for AGIs over 200k)
Taxes paid: $7,067 (reported on 38.3% of returns)
48005:
$7,067
State:
$8,327
(% of AGI for various income ranges: 2.8% for AGIs below $25k, 3.1% for AGIs $25k-50k, 4.3% for AGIs $50k-75k, 5.2% for AGIs $75k-100k, 5.3% for AGIs $100k-200k, 5.3% for AGIs over 200k)
Earned income credit: $2,068 (reported on 9.6% of returns)
Here:
$2,068
State:
$2,306
(% of AGI for various income ranges: 3.2% for AGIs below $25k, 1.0% for AGIs $25k-50k)
Percentage of individuals using paid preparers for their 2012 taxes: 64.4%
Here:
64%
State:
57%
(% for various income ranges: 56.0% for AGIs below $25k, 66.7% for AGIs $25k-50k, 70.0% for AGIs $50k-75k, 70.6% for AGIs $75k-100k, 67.5% for AGIs $100k-200k, 80.0% for AGIs over 200k)
Averages for the 2004 tax year for zip code 48005, filed in 2005:
Average Adjusted Gross Income (AGI) in 2004: $58,871 (Individual Income Tax Returns)
Here:
$58,871
State:
$48,204
Salary/wage: $51,521 (reported on 87.1% of returns)
Here:
$51,521
State:
$42,791
(% of AGI for various income ranges: 127.9% for AGIs below $10k, 66.0% for AGIs $10k-25k, 72.7% for AGIs $25k-50k, 82.6% for AGIs $50k-75k, 90.5% for AGIs $75k-100k, 67.2% for AGIs over 100k)
Taxable interest for individuals: $1,477 (reported on 59.9% of returns)
This zip code:
$1,477
Michigan:
$1,725
(% of AGI for various income ranges: 9.6% for AGIs below $10k, 4.3% for AGIs $10k-25k, 2.5% for AGIs $25k-50k, 1.6% for AGIs $50k-75k, 0.8% for AGIs $75k-100k, 1.1% for AGIs over 100k)
Taxable dividends: $1,730 (reported on 29.5% of returns)
Here:
$1,730
State:
$3,420
(% of AGI for various income ranges: 4.4% for AGIs below $10k, 2.2% for AGIs $10k-25k, 1.3% for AGIs $25k-50k, 0.5% for AGIs $50k-75k, 0.4% for AGIs $75k-100k, 0.9% for AGIs over 100k)
Net capital gain/loss: +$4,780 (reported on 19.9% of returns)
Here:
+$4,780
State:
+$8,532
(% of AGI for various income ranges: -2.1% for AGIs below $10k, 1.0% for AGIs $10k-25k, 0.0% for AGIs $25k-50k, 0.6% for AGIs $50k-75k, 0.2% for AGIs $75k-100k, 3.4% for AGIs over 100k)
Profit/loss from business: +$7,217 (reported on 14.6% of returns)
Here:
+$7,217
State:
+$9,547
(% of AGI for various income ranges: 13.7% for AGIs below $10k, 5.6% for AGIs $10k-25k, 3.0% for AGIs $25k-50k, 2.0% for AGIs $50k-75k, 1.3% for AGIs $75k-100k, 1.0% for AGIs over 100k)
Profit/loss from farming: +$136 (reported on 2.3% of returns)
Here:
+$136
State:
-$4,492
(% of AGI for various income ranges: -5.0% for AGIs below $10k, 0.2% for AGIs $25k-50k, 0.2% for AGIs $50k-75k, -0.1% for AGIs $75k-100k)
IRA payment deduction: $2,779 (reported on 2.7% of returns)
48005:
$2,779
Michigan:
$2,875
(% of AGI for various income ranges: 0.5% for AGIs $25k-50k, 0.2% for AGIs $50k-75k, 0.1% for AGIs $75k-100k, 0.0% for AGIs over 100k)
Total itemized deductions: $18,783 (20% of AGI, reported on 49.4% of returns)
Here:
$18,783
State:
$18,509
Here:
20.0% of AGI
State:
20.7% of AGI
(% of AGI for various income ranges: 17.3% for AGIs below $10k, 13.9% for AGIs $10k-25k, 14.4% for AGIs $25k-50k, 18.7% for AGIs $50k-75k, 18.2% for AGIs $75k-100k, 13.8% for AGIs over 100k)
Charity contributions deductions: $3,023 (3% of AGI, reported on 45.7% of returns)
Here:
$3,023
State:
$3,365
Here:
3.1% of AGI
State:
3.6% of AGI
(% of AGI for various income ranges: 0.9% for AGIs below $10k, 1.8% for AGIs $10k-25k, 1.5% for AGIs $25k-50k, 2.1% for AGIs $50k-75k, 1.9% for AGIs $75k-100k, 3.0% for AGIs over 100k)
Total tax: $8,084 (reported on 82.1% of returns)
48005:
$8,084
State:
$7,691
(% of AGI for various income ranges: 5.0% for AGIs below $10k, 4.9% for AGIs $10k-25k, 7.2% for AGIs $25k-50k, 8.2% for AGIs $50k-75k, 9.1% for AGIs $75k-100k, 15.6% for AGIs over 100k)
Earned income credit: $1,423 (reported on 6.2% of returns)
Here:
$1,423
State:
$1,737
Percentage of individuals using paid preparers for their 2004 taxes: 63.4%
Here:
63%
State:
60%
(% for various income ranges: 54.3% for AGIs below $10k, 56.6% for AGIs $10k-25k, 67.2% for AGIs $25k-50k, 70.4% for AGIs $50k-75k, 62.1% for AGIs $75k-100k, 72.3% for AGIs over 100k)
Household received Food Stamps/SNAP in the past 12 months: 89 Household did not receive Food Stamps/SNAP in the past 12 months: 1,742
Women who had a birth in the past 12 months: 15 (9 now married, 5 unmarried) Women who did not have a birth in the past 12 months: 1,016 (529 now married, 484 unmarried)
Housing units in zip code 48005 with a mortgage: 1,166 (159 second mortgage, 166 both second mortgage and home equity loan) Houses without a mortgage: 20
Median monthly owner costs for units with a mortgage: $1,692 Median monthly owner costs for units without a mortgage: $662
Residents with income below the poverty level in 2022:
This zip code:
7.7%
Whole state:
13.4%
Residents with income below 50% of the poverty level in 2022:
This zip code:
6.0%
Whole state:
6.9%
Median number of rooms in houses and condos:
Here:
6.7
State:
6.5
Median number of rooms in apartments:
Here:
4.7
State:
4.3
Notable locations in this zip code not listed on our city pages
Notable locations in zip code 48005: Armada Police Department (A), Armada Free Public Library (B), Armada Fire Department (C), Armada Emergency Medical Services (D), Armada Township Fire Department (E). Display/hide their locations on the map
Churches in zip code 48005 include: Saint Mary Church (A), Our Saviour's Lutheran Church (B), Congregational United Church (C), Calvary Baptist Church (D), Armada United Methodist Church (E), Armada Community Church (F). Display/hide their locations on the map
In group quarters: 109 (-1 institutionalized population)
Size of family households: 599 2-persons, 275 3-persons, 324 4-persons, 129 5-persons, 107 6-persons, 4 7-or-more-persons
Size of nonfamily households: 325 1-person, 61 2-persons, 3 3-persons
676 married couples with children.
144 single-parent households (86 men, 58 women).
97.0% of residents of 48005 zip code speak English at home.
0.2% of residents speak Spanish at home (100% very well).
2.4% of residents speak other Indo-European language at home (95% very well, 5% well).
0.2% of residents speak other language at home (100% very well).
Foreign born population: 64 (1.2%) (89.4% of them are naturalized citizens)
This zip code:
1.2%
Whole state:
6.9%
43%Saudi Arabia
13%North Macedonia (Macedonia)
11%Germany
11%Greece
11%Serbia
8%Georgia
33%English
17%German
15%Polish
10%American
9%Irish
5%Italian
2%European
Year of entry for the foreign-born population
72010 or later
02000 to 2009
151990 to 1999
46Before 1990
Facilities with environmental interests located in this zip code:
ARMADA AREA HIGH SCHOOL (23655 ARMADA CENTER ROAD in ARMADA, MI)
(National Center for Education Statistics) - STATE ID-00119 Organizations: ARMADA AREA SCHOOLS (SCHOOL DISTRICT)
ARMADA EARLY ELEMENTARY SCHOOL (23900 ARMADA CENTER ROAD in ARMADA, MI)
(National Center for Education Statistics) - STATE ID-00120 Organizations: ARMADA AREA SCHOOLS (SCHOOL DISTRICT)
ARMADA LATER ELEMENTARY SCHOOL (23900 ARMADA CENTER ROAD in ARMADA, MI)
(National Center for Education Statistics) - STATE ID-08904 Organizations: ARMADA AREA SCHOOLS (SCHOOL DISTRICT)
ARMADA MIDDLE SCHOOL (23550 ARMADA CENTER ROAD in ARMADA, MI)
(National Center for Education Statistics) - STATE ID-06493 Organizations: ARMADA AREA SCHOOLS (SCHOOL DISTRICT)
ARMADA WWTP (73175 SOUTH FULTON STREET in ARMADA, MI)
National Pollutant Discharge Elimination System NON-MAJOR (Tracking pollutant discharge elimination systems) - permit National Pollutant Discharge Elimination System NON-MAJOR (Tracking pollutant discharge elimination systems) - permit Business SIC classification: SEWERAGE SYSTEMS Organizations: ARMADA, VILLAGE OF (CONTACT/OWNER)
ARMADA RUBBER MANUFACTURING CO (24586 ARMADA RIDGE ROAD in ARMADA, MI)
AIR MINOR (AIRS/AFS) CRITERIA AND HAZARDOUS AIR POLLUTANT INVENTORY (Inventory of air pollution sources) TRI REPORTER (Tracking of toxic chemicals releasing facilities) Business SIC classification: MOLDED, EXTRUDED, AND LATHE-CUT MECHANICAL RUBBER GOODS; FABRICATED RUBBER PRODUCTS
ARMADA TIMES (74230 FULTON STREET in ARMADA, MI)
(Resource Conservation and Recovery Act (tracking hazardous waste))
ARMADA AREA SCHOOLS (23550 CENTER ROAD in ARMADA, MI)
Conditionally Exempt Small Quantity Generators, less than 100 kg/month of hazardous waste (Resource Conservation and Recovery Act (tracking hazardous waste))
ARMADA TOWNSHIP FIRE DEPT (23175 ARMADA CENTER ROAD in ARMADA, MI)
Conditionally Exempt Small Quantity Generators, less than 100 kg/month of hazardous waste (Resource Conservation and Recovery Act (tracking hazardous waste))
AUTOMOTIVE SYSTEMS LABORATORY INC (69700 POWELL RD in ARMADA, MI)
Conditionally Exempt Small Quantity Generators, less than 100 kg/month of hazardous waste (Resource Conservation and Recovery Act (tracking hazardous waste))
BLAKE'S ORCHARD, INC. (17985 ARMADA CENTER ROAD in ARMADA, MI)
ENFORCEMENT/COMPLIANCE ACTIVITY (Integrated Compliance Information System)
Housing units lacking complete kitchen facilities: 3.0%
68.0%Utility gas
21.4%Bottled, tank, or LP gas
6.9%Electricity
2.5%Wood
0.8%Fuel oil, kerosene, etc.
0.6%Other fuel
Population in 1990: 4,819. Population change in the 1990s: +433 (+9.0%).
Place of birth for U.S.-born residents:
This state: 4,443
Northeast: 414
Midwest: 115
South: 210
West: 51
69% of the 48005 zip code residents lived in the same house 5 years ago. Out of people who lived in different houses, 60% lived in this county. Out of people who lived in different counties, 50% lived in Michigan.
94% of the 48005 zip code residents lived in the same house 1 year ago. Out of people who lived in different houses, 51% moved from this county. Out of people who lived in different houses, 23% moved from different county within same state. Out of people who lived in different houses, 29% moved from different state.
Private vs. public school enrollment:
Students in private schools in grades 1 to 8 (elementary and middle school): 52
Here:
7.5%
Michigan:
12.4%
Students in private schools in grades 9 to 12 (high school):
Here:
0.0%
Michigan:
9.8%
Students in private undergraduate colleges: 14
Here:
7.9%
Michigan:
14.9%
Occupation by median earnings in the past 12 months ($)
109,232Architecture and engineering occupations
105,117Business and financial operations occupations
93,003Management occupations
87,043Fire fighting and prevention, and other protective service workers including supervisors
65,683Arts, design, entertainment, sports, and media occupations
64,924Community and social service occupations
Companies with federal contracts located in this zip code:
BRC ENGINEERING INC (73225 FULTON ST in ARMADA, MI)
$8,673 with Navy for Office Type Sound Recording and Reproducing Machines. Taking place in CA. Signed on 2003-06-20. Completion date: 2003-07-18.
Top industries in this zip code by the number of employees in 2005:
Health Care and Social Assistance: Nursing Care Facilities (50-99 employees: 1 establishment)
Accommodation and Food Services: Caterers (50-99: 1)
Professional, Scientific, and Technical Services: Research and Development in the Physical, Engineering, and Life Sciences (50-99: 1)
Health Care and Social Assistance: Residential Mental Retardation Facilities (20-49: 1, 10-19: 2)
Accommodation and Food Services: Full-Service Restaurants (20-49: 1, 1-4: 2)
Health Care and Social Assistance: Continuing Care Retirement Communities (20-49: 1)
Mining: Crude Petroleum and Natural Gas Extraction (20-49: 1)
Construction: Land Subdivision (20-49: 1)
People in group quarters in 2010:
64 people in nursing facilities/skilled-nursing facilities
27 people in group homes intended for adults
People in group quarters in 2000:
48 people in nursing homes
18 people in homes for the mentally retarded
9 people in agriculture workers' dormitories on farms
6 people in other group homes
4 people in other noninstitutional group quarters
Fatal accident statistics in 2013:
Fatal accident count: 3
Vehicles involved in fatal accidents: 5
Fatal accidents caused by drunken drivers: 1
Fatalities: 3
Persons involved in fatal accidents: 5
Pedestrians involved in fatal accidents: 0
Fatal accident statistics in 2010:
Fatal accident count: 2
Vehicles involved in fatal accidents: 3
Fatal accidents caused by drunken drivers: 1
Fatalities: 2
Persons involved in fatal accidents: 5
Pedestrians involved in fatal accidents: 0
Home Mortgage Disclosure Act Aggregated Statistics For Year 2009 (Based on 2 full tracts)
A) FHA, FSA/RHS & VA Home Purchase Loans
B) Conventional Home Purchase Loans
C) Refinancings
D) Home Improvement Loans
E) Loans on Dwellings For 5+ Families
F) Non-occupant Loans on < 5 Family Dwellings (A B C & D)
G) Loans On Manufactured Home Dwelling (A B C & D)
Number
Average Value
Number
Average Value
Number
Average Value
Number
Average Value
Number
Average Value
Number
Average Value
Number
Average Value
LOANS ORIGINATED
49
$126,053
16
$145,795
223
$142,199
14
$97,806
2
$112,300
4
$129,540
2
$60,090
APPLICATIONS APPROVED, NOT ACCEPTED
4
$71,912
0
$0
18
$177,975
0
$0
0
$0
0
$0
0
$0
APPLICATIONS DENIED
8
$80,532
2
$109,345
85
$177,666
10
$38,813
0
$0
0
$0
4
$125,108
APPLICATIONS WITHDRAWN
10
$85,113
8
$151,705
18
$190,234
2
$34,480
0
$0
4
$113,288
0
$0
FILES CLOSED FOR INCOMPLETENESS
2
$83,735
0
$0
4
$193,080
0
$0
0
$0
0
$0
0
$0
Aggregated Statistics For Year 2008 (Based on 2 full tracts)
A) FHA, FSA/RHS & VA Home Purchase Loans
B) Conventional Home Purchase Loans
C) Refinancings
D) Home Improvement Loans
E) Loans on Dwellings For 5+ Families
F) Non-occupant Loans on < 5 Family Dwellings (A B C & D)
G) Loans On Manufactured Home Dwelling (A B C & D)
Number
Average Value
Number
Average Value
Number
Average Value
Number
Average Value
Number
Average Value
Number
Average Value
Number
Average Value
LOANS ORIGINATED
53
$137,096
30
$115,191
89
$164,656
10
$92,796
0
$0
8
$81,518
2
$11,820
APPLICATIONS APPROVED, NOT ACCEPTED
4
$140,870
6
$190,782
16
$161,310
4
$68,958
0
$0
2
$198,005
0
$0
APPLICATIONS DENIED
14
$154,942
10
$105,209
79
$173,477
10
$115,848
0
$0
6
$115,585
0
$0
APPLICATIONS WITHDRAWN
2
$98,510
6
$112,630
20
$217,313
2
$98,510
2
$615,690
2
$86,690
0
$0
FILES CLOSED FOR INCOMPLETENESS
0
$0
2
$116,240
8
$159,094
0
$0
0
$0
0
$0
0
$0
Aggregated Statistics For Year 2007 (Based on 2 full tracts)
A) FHA, FSA/RHS & VA Home Purchase Loans
B) Conventional Home Purchase Loans
C) Refinancings
D) Home Improvement Loans
F) Non-occupant Loans on < 5 Family Dwellings (A B C & D)
G) Loans On Manufactured Home Dwelling (A B C & D)
Number
Average Value
Number
Average Value
Number
Average Value
Number
Average Value
Number
Average Value
Number
Average Value
LOANS ORIGINATED
6
$147,765
85
$154,394
201
$168,898
18
$31,961
16
$131,880
0
$0
APPLICATIONS APPROVED, NOT ACCEPTED
0
$0
8
$148,258
32
$251,447
0
$0
2
$128,065
0
$0
APPLICATIONS DENIED
0
$0
26
$136,929
144
$163,691
12
$44,822
12
$107,212
4
$28,075
APPLICATIONS WITHDRAWN
0
$0
2
$295,530
49
$246,356
6
$34,478
0
$0
0
$0
FILES CLOSED FOR INCOMPLETENESS
0
$0
2
$183,230
10
$251,201
4
$47,285
0
$0
0
$0
Aggregated Statistics For Year 2006 (Based on 2 full tracts)
A) FHA, FSA/RHS & VA Home Purchase Loans
B) Conventional Home Purchase Loans
C) Refinancings
D) Home Improvement Loans
E) Loans on Dwellings For 5+ Families
F) Non-occupant Loans on < 5 Family Dwellings (A B C & D)
G) Loans On Manufactured Home Dwelling (A B C & D)
Number
Average Value
Number
Average Value
Number
Average Value
Number
Average Value
Number
Average Value
Number
Average Value
Number
Average Value
LOANS ORIGINATED
4
$154,168
114
$144,879
299
$127,424
51
$53,041
2
$128,065
24
$139,802
4
$62,062
APPLICATIONS APPROVED, NOT ACCEPTED
0
$0
28
$145,232
43
$196,379
10
$24,233
0
$0
6
$120,182
2
$61,075
APPLICATIONS DENIED
4
$161,065
22
$69,315
183
$169,620
18
$33,822
0
$0
10
$125,305
0
$0
APPLICATIONS WITHDRAWN
0
$0
8
$94,324
77
$175,297
4
$219,185
0
$0
4
$91,122
0
$0
FILES CLOSED FOR INCOMPLETENESS
0
$0
8
$73,882
39
$185,098
0
$0
0
$0
0
$0
0
$0
Aggregated Statistics For Year 2005 (Based on 2 full tracts)
A) FHA, FSA/RHS & VA Home Purchase Loans
B) Conventional Home Purchase Loans
C) Refinancings
D) Home Improvement Loans
F) Non-occupant Loans on < 5 Family Dwellings (A B C & D)
G) Loans On Manufactured Home Dwelling (A B C & D)
Number
Average Value
Number
Average Value
Number
Average Value
Number
Average Value
Number
Average Value
Number
Average Value
LOANS ORIGINATED
4
$177,810
142
$162,181
388
$164,324
33
$94,032
12
$147,765
0
$0
APPLICATIONS APPROVED, NOT ACCEPTED
0
$0
14
$142,839
69
$186,684
6
$61,077
0
$0
2
$24,630
APPLICATIONS DENIED
0
$0
37
$154,155
169
$183,718
16
$28,076
4
$88,660
4
$92,108
APPLICATIONS WITHDRAWN
0
$0
20
$138,800
110
$153,980
14
$69,239
4
$117,228
0
$0
FILES CLOSED FOR INCOMPLETENESS
0
$0
6
$112,302
24
$206,707
4
$108,360
6
$112,302
0
$0
Aggregated Statistics For Year 2004 (Based on 2 full tracts)
A) FHA, FSA/RHS & VA Home Purchase Loans
B) Conventional Home Purchase Loans
C) Refinancings
D) Home Improvement Loans
F) Non-occupant Loans on < 5 Family Dwellings (A B C & D)
G) Loans On Manufactured Home Dwelling (A B C & D)
Number
Average Value
Number
Average Value
Number
Average Value
Number
Average Value
Number
Average Value
Number
Average Value
LOANS ORIGINATED
2
$168,450
140
$170,690
433
$166,056
37
$139,405
10
$133,186
6
$132,003
APPLICATIONS APPROVED, NOT ACCEPTED
0
$0
10
$195,247
55
$176,602
0
$0
4
$146,780
0
$0
APPLICATIONS DENIED
0
$0
14
$149,031
156
$174,514
16
$125,723
10
$108,164
0
$0
APPLICATIONS WITHDRAWN
0
$0
4
$145,302
93
$177,636
4
$29,552
18
$120,729
0
$0
FILES CLOSED FOR INCOMPLETENESS
0
$0
2
$221,650
51
$172,875
0
$0
0
$0
0
$0
Aggregated Statistics For Year 2003 (Based on 2 full tracts)
A) FHA, FSA/RHS & VA Home Purchase Loans
B) Conventional Home Purchase Loans
C) Refinancings
D) Home Improvement Loans
F) Non-occupant Loans on < 5 Family Dwellings (A B C & D)
Number
Average Value
Number
Average Value
Number
Average Value
Number
Average Value
Number
Average Value
LOANS ORIGINATED
8
$164,758
97
$170,656
1,038
$149,991
20
$33,494
4
$106,882
APPLICATIONS APPROVED, NOT ACCEPTED
0
$0
18
$164,293
104
$167,524
12
$13,956
0
$0
APPLICATIONS DENIED
0
$0
12
$164,840
203
$158,577
8
$94,570
4
$72,898
APPLICATIONS WITHDRAWN
0
$0
14
$150,016
124
$163,066
6
$15,105
2
$147,765
FILES CLOSED FOR INCOMPLETENESS
0
$0
4
$134,958
18
$145,467
2
$26,600
0
$0
Aggregated Statistics For Year 2002 (Based on 2 full tracts)
A) FHA, FSA/RHS & VA Home Purchase Loans
B) Conventional Home Purchase Loans
C) Refinancings
D) Home Improvement Loans
F) Non-occupant Loans on < 5 Family Dwellings (A B C & D)
Number
Average Value
Number
Average Value
Number
Average Value
Number
Average Value
Number
Average Value
LOANS ORIGINATED
12
$141,197
118
$173,895
688
$148,295
22
$31,792
6
$136,272
APPLICATIONS APPROVED, NOT ACCEPTED
0
$0
10
$204,310
87
$174,850
8
$7,142
4
$25,120
APPLICATIONS DENIED
0
$0
22
$105,137
89
$136,586
18
$18,607
0
$0
APPLICATIONS WITHDRAWN
0
$0
2
$122,150
79
$158,239
8
$58,614
0
$0
FILES CLOSED FOR INCOMPLETENESS
0
$0
4
$225,588
37
$411,239
2
$1,970
0
$0
Aggregated Statistics For Year 2001 (Based on 2 full tracts)
A) FHA, FSA/RHS & VA Home Purchase Loans
B) Conventional Home Purchase Loans
C) Refinancings
D) Home Improvement Loans
F) Non-occupant Loans on < 5 Family Dwellings (A B C & D)
Number
Average Value
Number
Average Value
Number
Average Value
Number
Average Value
Number
Average Value
LOANS ORIGINATED
14
$130,878
134
$163,291
565
$139,152
32
$28,691
4
$69,450
APPLICATIONS APPROVED, NOT ACCEPTED
0
$0
16
$123,876
45
$131,128
16
$12,560
0
$0
APPLICATIONS DENIED
0
$0
20
$135,550
148
$122,419
12
$28,568
2
$344,785
APPLICATIONS WITHDRAWN
0
$0
12
$158,929
87
$149,486
8
$7,389
2
$193,080
FILES CLOSED FOR INCOMPLETENESS
0
$0
4
$103,435
22
$144,093
4
$51,718
2
$197,020
Aggregated Statistics For Year 2000 (Based on 2 full tracts)
A) FHA, FSA/RHS & VA Home Purchase Loans
B) Conventional Home Purchase Loans
C) Refinancings
D) Home Improvement Loans
F) Non-occupant Loans on < 5 Family Dwellings (A B C & D)
Number
Average Value
Number
Average Value
Number
Average Value
Number
Average Value
Number
Average Value
LOANS ORIGINATED
22
$138,004
132
$144,317
140
$118,282
43
$23,826
10
$85,310
APPLICATIONS APPROVED, NOT ACCEPTED
0
$0
12
$76,673
24
$102,040
18
$15,214
4
$46,300
APPLICATIONS DENIED
6
$102,122
30
$100,283
69
$120,496
16
$15,516
8
$84,226
APPLICATIONS WITHDRAWN
2
$112,300
6
$117,883
33
$113,913
8
$18,224
2
$29,555
FILES CLOSED FOR INCOMPLETENESS
0
$0
4
$132,002
12
$145,959
0
$0
0
$0
Aggregated Statistics For Year 1999 (Based on 1 full and 1 partial tracts)
A) FHA, FSA/RHS & VA Home Purchase Loans
B) Conventional Home Purchase Loans
C) Refinancings
D) Home Improvement Loans
F) Non-occupant Loans on < 5 Family Dwellings (A B C & D)
Detailed PMIC statistics for the following Tracts:2120.00
2002 - 2018 National Fire Incident Reporting System (NFIRS) incidents
Based on the data from the years 2002 - 2018 the average number of fires per year is 22. The highest number of fires - 34 took place in 2002, and the least - 11 in 2006. The data has a dropping trend.
When looking into fire subcategories, the most reports belonged to: Structure Fires (51.2%), and Outside Fires (27.3%).
Fire incident types reported to NFIRS in Zip Code 48005


+$136
-$4,492
(% of AGI for various income ranges: -5.0% for AGIs below $10k, 0.2% for AGIs $25k-50k, 0.2% for AGIs $50k-75k, -0.1% for AGIs $75k-100k) Nearest zip codes: 48002, 48096, 48065, 48062, 48050, 48003.


 Based on the data from the years 2002 - 2018 the average number of fires per year is 22. The highest number of fires - 34 took place in 2002, and the least - 11 in 2006. The data has a dropping trend.
 When looking into fire subcategories, the most reports belonged to: Structure Fires (51.2%), and Outside Fires (27.3%).