Estimated zip code population in 2022: 2,344 Zip code population in 2010: 2,139 Zip code population in 2000: 2,192
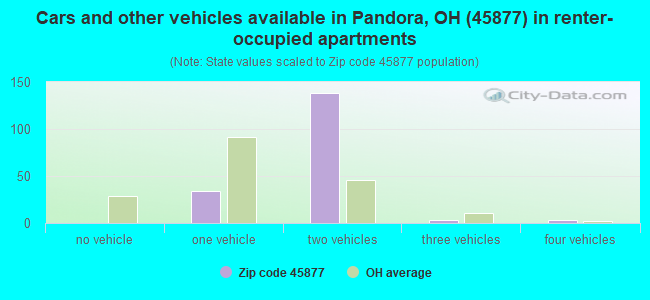
Houses and condos: 974 Renter-occupied apartments: 182
% of renters here:
19%
State:
33%
March 2022 cost of living index in zip code 45877: 83.2 (low, U.S. average is 100)
Land area: 27.8 sq. mi. Water area: 0.1 sq. mi.
Population density: 84 people per square mile
(very low).
OSM Map
General Map
Google Map
MSN Map
OSM Map
General Map
Google Map
MSN Map
OSM Map
General Map
Google Map
MSN Map
OSM Map
General Map
Google Map
MSN Map
Please wait while loading the map...
Real estate property taxes paid for housing units in 2022:
This zip code:
0.8% ($1,477)
Ohio:
1.3% ($2,639)
Median real estate property taxes paid for housing units with mortgages in 2022: $1,417 (0.8%) Median real estate property taxes paid for housing units with no mortgage in 2022: $1,604 (0.9%)
Business Search- 14 Million verified businesses
Males: 1,199
(51.1%)
Females: 1,145
(48.9%)
For population 25 years and over in 45877:
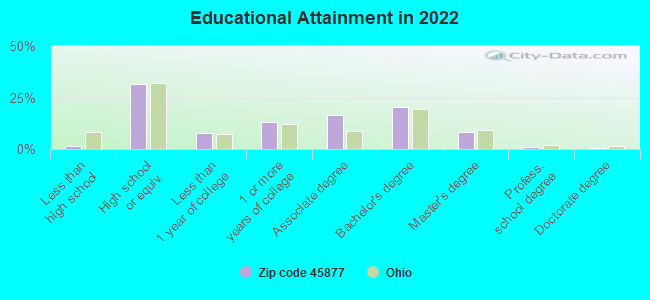
High school or higher: 98.5%
Bachelor's degree or higher: 30.0%
Graduate or professional degree: 9.9%
Unemployed: 1.5%
Mean travel time to work (commute): 19.6 minutes
For population 15 years and over in 45877:
Never married: 27.5%
Now married: 59.5%
Separated: 0.5%
Widowed: 4.4%
Divorced: 8.1%
Zip code 45877 compared to state average:
Unemployed percentage below state average.
Black race population percentage significantly below state average.
Foreign-born population percentage significantly below state average.
Renting percentage below state average.
Length of stay since moving in significantly above state average.
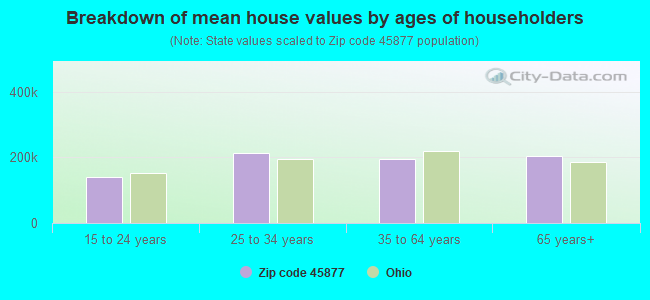
Estimated median house/condo value in 2022: $177,488
45877:
$177,488
Ohio:
$204,100
According to our research of Ohio and other state lists, there were 4 registered sex offenders living in 45877 zip code as of May 23, 2024. The ratio of all residents to sex offenders in zip code 45877 is 580 to 1. The ratio of registered sex offenders to all residents in this zip code is near the state average.
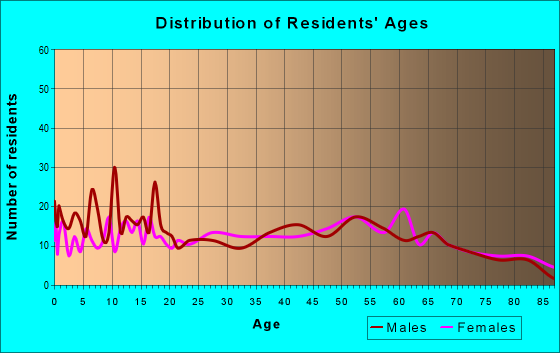
Median resident age:
This zip code:
43.5 years
Ohio median age:
39.9 years
Average household size:
This zip code:
2.4 people
Ohio:
2.4 people
Averages for the 2020 tax year for zip code 45877, filed in 2021:
Average Adjusted Gross Income (AGI) in 2020: $60,593 (Individual Income Tax Returns)
Here:
$60,593
State:
$67,288
Salary/wage: $51,587 (reported on 82.7% of returns)
Here:
$51,587
State:
$55,628
(% of AGI for various income ranges: 1187.1% for AGIs below $25k, 3560.4% for AGIs $25k-50k, 7124.6% for AGIs $50k-75k, 9991.1% for AGIs $75k-100k, 15874.4% for AGIs $100k-200k)
Taxable interest for individuals: $640 (reported on 38.2% of returns)
This zip code:
$640
Ohio:
$1,518
(% of AGI for various income ranges: 21.8% for AGIs below $25k, 28.3% for AGIs $25k-50k, 26.2% for AGIs $50k-75k, 23.3% for AGIs $75k-100k, 97.8% for AGIs $100k-200k)
Ordinary dividends: $2,046 (reported on 23.6% of returns)
Here:
$2,046
State:
$7,167
(% of AGI for various income ranges: 27.6% for AGIs below $25k, 36.1% for AGIs $25k-50k, 96.2% for AGIs $50k-75k, 62.2% for AGIs $75k-100k, 245.6% for AGIs $100k-200k)
Net capital gain/loss in AGI: +$5,335 (reported on 18.2% of returns)
Here:
+$5,335
State:
+$18,919
(% of AGI for various income ranges: 6.5% for AGIs below $25k, 32.6% for AGIs $25k-50k, 49.2% for AGIs $50k-75k, 45.6% for AGIs $75k-100k, 973.3% for AGIs $100k-200k)
Profit/loss from business: +$11,333 (reported on 13.6% of returns)
Here:
+$11,333
State:
+$13,744
(% of AGI for various income ranges: 100.0% for AGIs below $25k, 107.0% for AGIs $25k-50k, 87.7% for AGIs $50k-75k, 222.2% for AGIs $75k-100k, 1077.8% for AGIs $100k-200k)
Taxable individual retirement arrangement distribution: $16,377 (reported on 11.8% of returns)
45877:
$16,377
Ohio:
$18,876
(% of AGI for various income ranges: 110.6% for AGIs below $25k, 186.5% for AGIs $25k-50k, 518.5% for AGIs $50k-75k, 931.1% for AGIs $100k-200k)
Total itemized deductions: $23,033 (reported on 2.7% of returns)
Here:
$23,033
State:
$33,869
(% of AGI for various income ranges: 531.5% for AGIs $50k-75k)
Taxes paid: $5,533 (reported on 2.7% of returns)
45877:
$5,533
State:
$7,681
(% of AGI for various income ranges: 184.4% for AGIs $75k-100k)
Earned income credit: $1,864 (reported on 10.0% of returns)
Here:
$1,864
State:
$2,304
(% of AGI for various income ranges: 58.8% for AGIs below $25k, 45.7% for AGIs $25k-50k)
Percentage of individuals using paid preparers for their 2020 taxes: 95.5%
Here:
95%
State:
94%
(% for various income ranges: 92.9% for AGIs below $25k, 93.5% for AGIs $25k-50k, 100.0% for AGIs $50k-75k, 92.9% for AGIs $75k-100k, 100.0% for AGIs $100k-200k, 100.0% for AGIs over 200k)
Averages for the 2012 tax year for zip code 45877, filed in 2013:
Average Adjusted Gross Income (AGI) in 2012: $50,268 (Individual Income Tax Returns)
Here:
$50,268
State:
$54,926
Salary/wage: $42,084 (reported on 84.5% of returns)
Here:
$42,084
State:
$45,869
(% of AGI for various income ranges: 63.1% for AGIs below $25k, 76.3% for AGIs $25k-50k, 79.4% for AGIs $50k-75k, 77.0% for AGIs $75k-100k, 60.3% for AGIs $100k-200k)
Taxable interest for individuals: $733 (reported on 41.7% of returns)
This zip code:
$733
Ohio:
$1,297
(% of AGI for various income ranges: 2.7% for AGIs below $25k, 0.7% for AGIs $25k-50k, 0.6% for AGIs $50k-75k, 0.2% for AGIs $75k-100k, 0.3% for AGIs $100k-200k)
Ordinary dividends: $1,293 (reported on 27.2% of returns)
Here:
$1,293
State:
$5,821
(% of AGI for various income ranges: 2.7% for AGIs below $25k, 0.9% for AGIs $25k-50k, 0.3% for AGIs $50k-75k, 0.3% for AGIs $75k-100k, 0.5% for AGIs $100k-200k)
Net capital gain/loss in AGI: +$1,616 (reported on 18.4% of returns)
Here:
+$1,616
State:
+$11,232
(% of AGI for various income ranges: 0.6% for AGIs $50k-75k, 1.4% for AGIs $75k-100k, 0.8% for AGIs $100k-200k)
Profit/loss from business: +$12,356 (reported on 15.5% of returns)
Here:
+$12,356
State:
+$12,773
(% of AGI for various income ranges: 3.5% for AGIs below $25k, 3.4% for AGIs $25k-50k, 3.5% for AGIs $50k-75k, 2.0% for AGIs $75k-100k, 5.5% for AGIs $100k-200k)
Taxable individual retirement arrangement distribution: $8,177 (reported on 12.6% of returns)
45877:
$8,177
Ohio:
$14,511
(% of AGI for various income ranges: 5.0% for AGIs below $25k, 4.3% for AGIs $25k-50k, 3.7% for AGIs $75k-100k)
Total itemized deductions: $19,019 (22% of AGI, reported on 26.2% of returns)
Here:
$19,019
State:
$21,278
Here:
21.6% of AGI
State:
18.8% of AGI
(% of AGI for various income ranges: 13.8% for AGIs below $25k, 7.1% for AGIs $25k-50k, 6.6% for AGIs $50k-75k, 9.7% for AGIs $75k-100k, 12.7% for AGIs $100k-200k)
Charity contributions: $4,782 (reported on 21.4% of returns)
Here:
$4,782
State:
$3,943
(% of AGI for various income ranges: 1.5% for AGIs below $25k, 0.9% for AGIs $25k-50k, 1.3% for AGIs $50k-75k, 2.4% for AGIs $75k-100k, 3.1% for AGIs $100k-200k)
Taxes paid: $6,874 (reported on 26.2% of returns)
45877:
$6,874
State:
$9,568
(% of AGI for various income ranges: 1.0% for AGIs below $25k, 2.1% for AGIs $25k-50k, 2.2% for AGIs $50k-75k, 3.6% for AGIs $75k-100k, 5.9% for AGIs $100k-200k)
Earned income credit: $1,782 (reported on 10.7% of returns)
Here:
$1,782
State:
$2,285
(% of AGI for various income ranges: 3.1% for AGIs below $25k, 0.6% for AGIs $25k-50k)
Percentage of individuals using paid preparers for their 2012 taxes: 63.1%
Here:
63%
State:
51%
(% for various income ranges: 54.1% for AGIs below $25k, 66.7% for AGIs $25k-50k, 66.7% for AGIs $50k-75k, 69.2% for AGIs $75k-100k, 72.7% for AGIs $100k-200k)
Averages for the 2004 tax year for zip code 45877, filed in 2005:
Average Adjusted Gross Income (AGI) in 2004: $37,863 (Individual Income Tax Returns)
Here:
$37,863
State:
$44,480
Salary/wage: $35,302 (reported on 84.4% of returns)
Here:
$35,302
State:
$39,198
(% of AGI for various income ranges: 198.5% for AGIs below $10k, 61.8% for AGIs $10k-25k, 77.9% for AGIs $25k-50k, 82.8% for AGIs $50k-75k, 79.3% for AGIs $75k-100k, 74.6% for AGIs over 100k)
Taxable interest for individuals: $1,107 (reported on 52.8% of returns)
This zip code:
$1,107
Ohio:
$1,532
(% of AGI for various income ranges: 11.7% for AGIs below $10k, 5.6% for AGIs $10k-25k, 1.4% for AGIs $25k-50k, 1.2% for AGIs $50k-75k, 0.3% for AGIs $75k-100k, 0.2% for AGIs over 100k)
Taxable dividends: $1,239 (reported on 29.0% of returns)
Here:
$1,239
State:
$3,496
(% of AGI for various income ranges: 5.4% for AGIs below $10k, 1.7% for AGIs $10k-25k, 0.9% for AGIs $25k-50k, 1.3% for AGIs $50k-75k, 0.3% for AGIs $75k-100k, 0.2% for AGIs over 100k)
Net capital gain/loss: +$1,995 (reported on 19.6% of returns)
Here:
+$1,995
State:
+$8,582
(% of AGI for various income ranges: -5.1% for AGIs below $10k, 0.2% for AGIs $10k-25k, -0.3% for AGIs $25k-50k, 0.2% for AGIs $50k-75k, 3.1% for AGIs $75k-100k, 4.2% for AGIs over 100k)
Profit/loss from business: +$8,699 (reported on 16.4% of returns)
Here:
+$8,699
State:
+$10,813
(% of AGI for various income ranges: 2.2% for AGIs below $10k, 3.7% for AGIs $10k-25k, 4.2% for AGIs $25k-50k, 3.5% for AGIs $50k-75k, 5.2% for AGIs $75k-100k, 1.7% for AGIs over 100k)
IRA payment deduction: $3,100 (reported on 3.0% of returns)
45877:
$3,100
Ohio:
$2,794
Total itemized deductions: $13,542 (22% of AGI, reported on 30.9% of returns)
Here:
$13,542
State:
$17,503
Here:
22.2% of AGI
State:
20.8% of AGI
(% of AGI for various income ranges: 13.5% for AGIs $10k-25k, 9.0% for AGIs $25k-50k, 8.7% for AGIs $50k-75k, 14.1% for AGIs $75k-100k, 15.5% for AGIs over 100k)
Charity contributions deductions: $3,663 (6% of AGI, reported on 24.1% of returns)
Here:
$3,663
State:
$3,087
Here:
5.7% of AGI
State:
3.4% of AGI
(% of AGI for various income ranges: 2.0% for AGIs $10k-25k, 1.4% for AGIs $25k-50k, 1.7% for AGIs $50k-75k, 3.6% for AGIs $75k-100k, 4.4% for AGIs over 100k)
Total tax: $4,022 (reported on 82.0% of returns)
45877:
$4,022
State:
$6,781
(% of AGI for various income ranges: 5.4% for AGIs below $10k, 4.6% for AGIs $10k-25k, 7.1% for AGIs $25k-50k, 8.6% for AGIs $50k-75k, 10.1% for AGIs $75k-100k, 14.2% for AGIs over 100k)
Earned income credit: $1,125 (reported on 7.9% of returns)
Here:
$1,125
State:
$1,696
Percentage of individuals using paid preparers for their 2004 taxes: 64.6%
Here:
65%
State:
55%
(% for various income ranges: 54.9% for AGIs below $10k, 67.4% for AGIs $10k-25k, 72.0% for AGIs $25k-50k, 59.9% for AGIs $50k-75k, 62.8% for AGIs $75k-100k, 57.5% for AGIs over 100k)
Household received Food Stamps/SNAP in the past 12 months: 27 Household did not receive Food Stamps/SNAP in the past 12 months: 935
Women who had a birth in the past 12 months: 23 (24 now married, 0 unmarried) Women who did not have a birth in the past 12 months: 490 (266 now married, 223 unmarried)
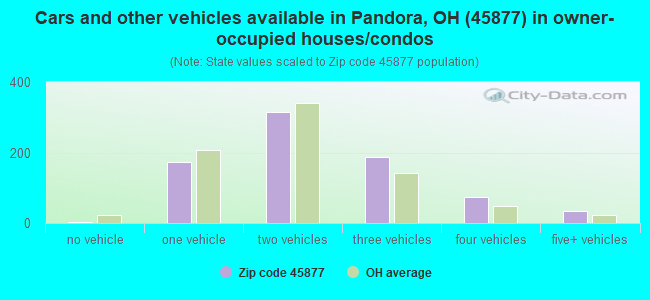
Housing units in zip code 45877 with a mortgage: 412 (40 second mortgage, 41 both second mortgage and home equity loan) Houses without a mortgage: 9
Median monthly owner costs for units with a mortgage: $1,081 Median monthly owner costs for units without a mortgage: $467
Residents with income below the poverty level in 2022:
This zip code:
2.0%
Whole state:
13.4%
Residents with income below 50% of the poverty level in 2022:
This zip code:
0.2%
Whole state:
7.0%
Median number of rooms in houses and condos:
Here:
7.2
State:
6.7
Median number of rooms in apartments:
Here:
5.2
State:
4.4
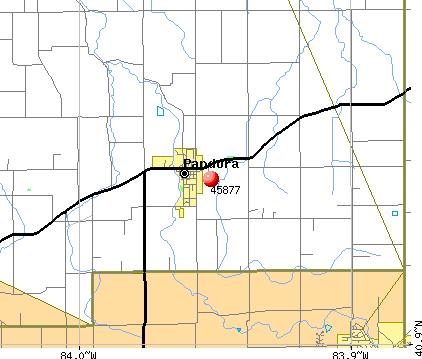
Notable locations in this zip code not listed on our city pages
Notable locations in zip code 45877: Luginbill Swine Farms (A), Schulte Farms (B), Augsburger Farms (C), Pandora Emergency Medical Services (D), Riley Township Fire Department (E). Display/hide their locations on the map
In group quarters: 64 (-1 institutionalized population)
Size of family households: 339 2-persons, 186 3-persons, 108 4-persons, 46 5-persons, 23 6-persons
Size of nonfamily households: 224 1-person, 33 2-persons
350 married couples with children.
43 single-parent households (43 women).
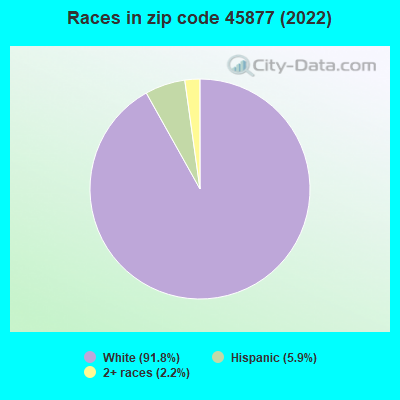
95.0% of residents of 45877 zip code speak English at home.
1.5% of residents speak Spanish at home (52% very well, 48% not well).
3.2% of residents speak other Indo-European language at home (35% very well, 24% well, 42% not well).
0.2% of residents speak Asian or Pacific Island language at home (100% very well).
Foreign born population: 20 (0.9%) (10.2% of them are naturalized citizens)
This zip code:
0.9%
Whole state:
5.0%
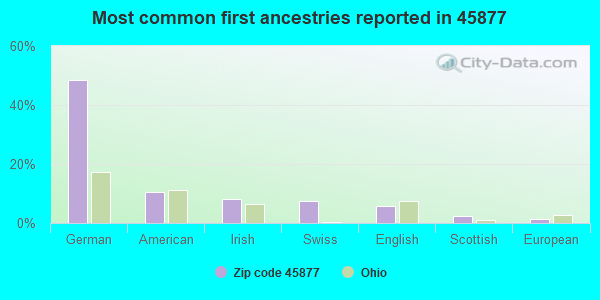
60%Saudi Arabia
49%German
11%American
8%Irish
7%Swiss
6%English
2%Scottish
1%European
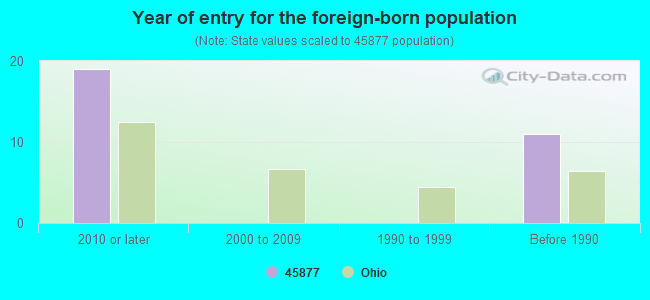
Year of entry for the foreign-born population
192010 or later
02000 to 2009
01990 to 1999
11Before 1990
Facilities with environmental interests located in this zip code:
BELLMAN FORD BODY SHOP (108 S JEFFERSON ST in PANDORA, OH)
Small Quantity Generators, between 100 kg and 1000 kg of hazardous waste/month (Resource Conservation and Recovery Act (tracking hazardous waste)) - notification Organizations: BELLMAN EUGENE V (CONTACT/OWNER)
Housing units lacking complete plumbing facilities: 0.3% Housing units lacking complete kitchen facilities: 0.2%
46.2%Utility gas
35.0%Electricity
13.5%Bottled, tank, or LP gas
4.3%Wood
1.2%Fuel oil, kerosene, etc.
Population in 1990: 2,026. Population change in the 1990s: +166 (+8.2%).
Place of birth for U.S.-born residents:
This state: 2,098
Northeast: 43
Midwest: 51
South: 75
West: 42
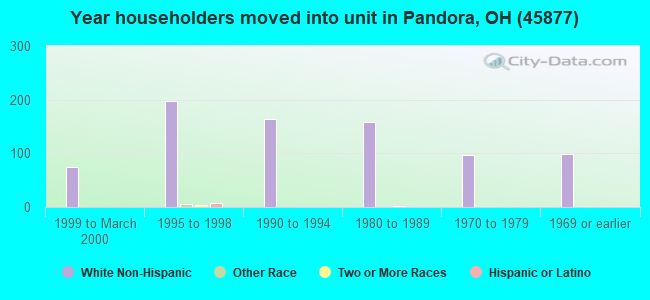
69% of the 45877 zip code residents lived in the same house 5 years ago. Out of people who lived in different houses, 63% lived in this county. Out of people who lived in different counties, 50% lived in Ohio.
91% of the 45877 zip code residents lived in the same house 1 year ago. Out of people who lived in different houses, 30% moved from this county. Out of people who lived in different houses, 71% moved from different county within same state. Out of people who lived in different houses, 2% moved from different state.
Private vs. public school enrollment:
Students in private schools in grades 1 to 8 (elementary and middle school): 13
Here:
6.6%
Ohio:
16.0%
Students in private schools in grades 9 to 12 (high school):
Here:
0.0%
Ohio:
13.1%
Students in private undergraduate colleges: 44
Here:
46.9%
Ohio:
22.3%
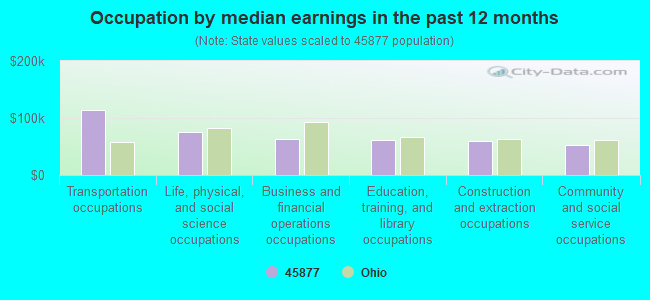
Occupation by median earnings in the past 12 months ($)
113,620Transportation occupations
75,663Life, physical, and social science occupations
62,350Business and financial operations occupations
61,215Education, training, and library occupations
60,057Construction and extraction occupations
51,945Community and social service occupations
Top industries in this zip code by the number of employees in 2005:
Health Care and Social Assistance: Continuing Care Retirement Communities (100-249 employees: 1 establishment)
Administrative and Support and Waste Management and Remediation Services: Packaging and Labeling Services (50-99: 1)
Health Care and Social Assistance: Offices of Physicians (except Mental Health Specialists) (20-49: 1)
Finance and Insurance: Commercial Banking (20-49: 1)
Other Services (except Public Administration): Religious Organizations (5-9: 2, 1-4: 3)
Health Care and Social Assistance: Child Day Care Services (10-19: 1, 1-4: 1)
Wholesale Trade: Grain and Field Bean Merchant Wholesalers (10-19: 1)
Accommodation and Food Services: Caterers (10-19: 1)
People in group quarters in 2010:
46 people in nursing facilities/skilled-nursing facilities
7 people in group homes intended for adults
People in group quarters in 2000:
71 people in nursing homes
9 people in homes for the mentally retarded
2002 - 2018 National Fire Incident Reporting System (NFIRS) incidents
According to the data from the years 2002 - 2018 the average number of fire incidents per year is 8. The highest number of fire incidents - 24 took place in 2006, and the least - 2 in 2002. The data has an increasing trend.
When looking into fire subcategories, the most incidents belonged to: Structure Fires (63.2%), and Outside Fires (30.9%).
Fire incident types reported to NFIRS in Zip Code 45877
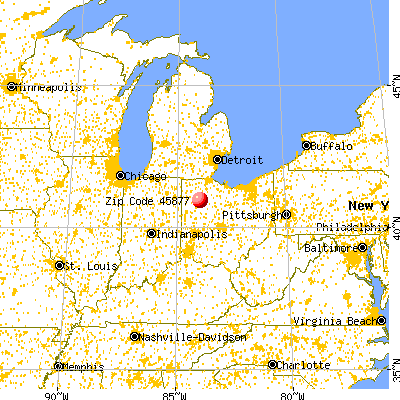


 Nearest zip codes: 45868, 45817, 45808, 45875, 45816, 45881.


 According to the data from the years 2002 - 2018 the average number of fire incidents per year is 8. The highest number of fire incidents - 24 took place in 2006, and the least - 2 in 2002. The data has an increasing trend.
 When looking into fire subcategories, the most incidents belonged to: Structure Fires (63.2%), and Outside Fires (30.9%).