Estimated zip code population in 2022: 6,204 Zip code population in 2010: 6,736 Zip code population in 2000: 6,503
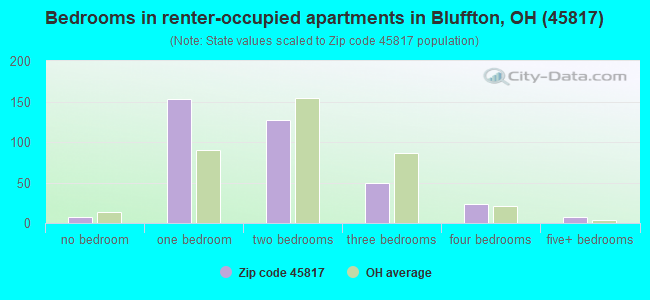
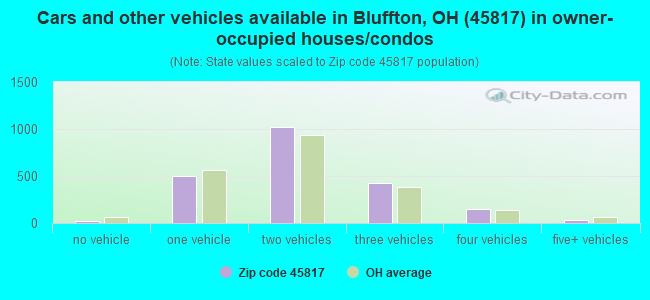
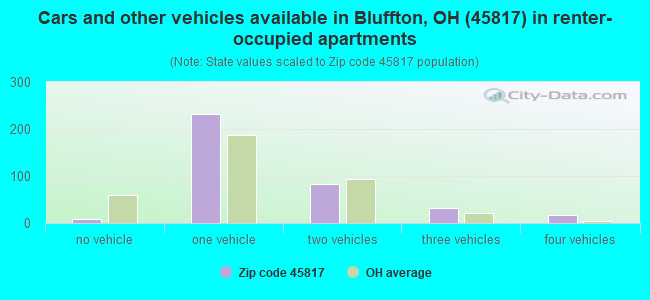
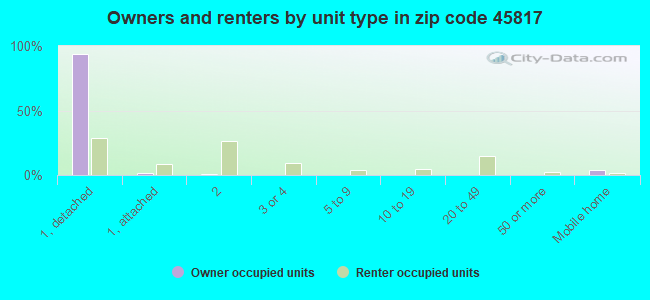
Houses and condos: 2,618 Renter-occupied apartments: 366
% of renters here:
15%
State:
33%
March 2022 cost of living index in zip code 45817: 89.9 (less than average, U.S. average is 100)
Land area: 64.6 sq. mi. Water area: 0.3 sq. mi.
Population density: 96 people per square mile
(very low).
OSM Map
General Map
Google Map
MSN Map
OSM Map
General Map
Google Map
MSN Map
OSM Map
General Map
Google Map
MSN Map
OSM Map
General Map
Google Map
MSN Map
Please wait while loading the map...
Real estate property taxes paid for housing units in 2022:
This zip code:
0.9% ($1,947)
Ohio:
1.3% ($2,639)
Median real estate property taxes paid for housing units with mortgages in 2022: $1,969 (0.9%) Median real estate property taxes paid for housing units with no mortgage in 2022: $1,923 (1.1%)
Business Search- 14 Million verified businesses
Males: 2,954
(47.6%)
Females: 3,249
(52.4%)
For population 25 years and over in 45817:
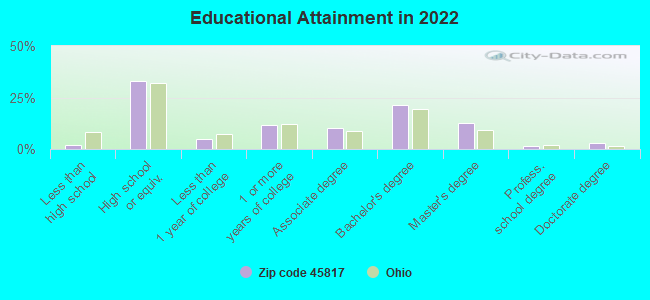
High school or higher: 98.7%
Bachelor's degree or higher: 38.6%
Graduate or professional degree: 17.1%
Unemployed: 3.1%
Mean travel time to work (commute): 17.7 minutes
For population 15 years and over in 45817:
Never married: 22.0%
Now married: 58.7%
Separated: 1.3%
Widowed: 8.7%
Divorced: 9.4%
Zip code 45817 compared to state average:
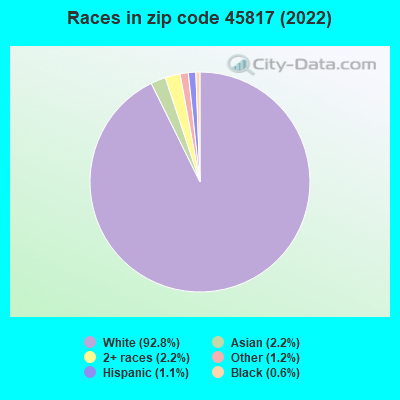
Black race population percentage significantly below state average.
Hispanic race population percentage significantly below state average.
Median age above state average.
Foreign-born population percentage below state average.
Renting percentage below state average.
Length of stay since moving in significantly above state average.
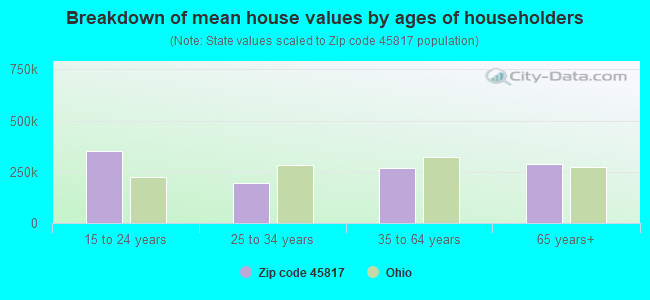
Estimated median house/condo value in 2022: $206,216
45817:
$206,216
Ohio:
$204,100
According to our research of Ohio and other state lists, there were 3 registered sex offenders living in 45817 zip code as of May 23, 2024. The ratio of all residents to sex offenders in zip code 45817 is 2,361 to 1. The ratio of registered sex offenders to all residents in this zip code is much lower than the state average.
Median resident age:
This zip code:
44.0 years
Ohio median age:
39.9 years
Average household size:
This zip code:
2.3 people
Ohio:
2.4 people
Averages for the 2020 tax year for zip code 45817, filed in 2021:
Average Adjusted Gross Income (AGI) in 2020: $74,233 (Individual Income Tax Returns)
Here:
$74,233
State:
$67,288
Salary/wage: $59,607 (reported on 78.6% of returns)
Here:
$59,607
State:
$55,628
(% of AGI for various income ranges: 1143.9% for AGIs below $25k, 3433.8% for AGIs $25k-50k, 6036.6% for AGIs $50k-75k, 8905.2% for AGIs $75k-100k, 15232.4% for AGIs $100k-200k, 51252.5% for AGIs over 200k)
Taxable interest for individuals: $1,099 (reported on 39.3% of returns)
This zip code:
$1,099
Ohio:
$1,518
(% of AGI for various income ranges: 19.0% for AGIs below $25k, 26.6% for AGIs $25k-50k, 52.9% for AGIs $50k-75k, 49.2% for AGIs $75k-100k, 93.6% for AGIs $100k-200k, 1045.0% for AGIs over 200k)
Ordinary dividends: $4,797 (reported on 30.0% of returns)
Here:
$4,797
State:
$7,167
(% of AGI for various income ranges: 37.1% for AGIs below $25k, 68.3% for AGIs $25k-50k, 119.4% for AGIs $50k-75k, 171.2% for AGIs $75k-100k, 390.3% for AGIs $100k-200k, 3840.0% for AGIs over 200k)
Net capital gain/loss in AGI: +$14,167 (reported on 26.2% of returns)
Here:
+$14,167
State:
+$18,919
(% of AGI for various income ranges: 13.3% for AGIs below $25k, 64.0% for AGIs $25k-50k, 130.9% for AGIs $50k-75k, 386.0% for AGIs $75k-100k, 565.5% for AGIs $100k-200k, 17780.0% for AGIs over 200k)
Profit/loss from business: +$13,395 (reported on 14.5% of returns)
Here:
+$13,395
State:
+$13,744
(% of AGI for various income ranges: 58.2% for AGIs below $25k, 158.3% for AGIs $25k-50k, 247.4% for AGIs $50k-75k, 366.8% for AGIs $75k-100k, 348.2% for AGIs $100k-200k, 4162.5% for AGIs over 200k)
Taxable individual retirement arrangement distribution: $19,738 (reported on 14.5% of returns)
45817:
$19,738
Ohio:
$18,876
(% of AGI for various income ranges: 87.6% for AGIs below $25k, 191.9% for AGIs $25k-50k, 304.6% for AGIs $50k-75k, 380.4% for AGIs $75k-100k, 950.6% for AGIs $100k-200k, 4512.5% for AGIs over 200k)
Total itemized deductions: $32,011 (reported on 6.2% of returns)
Here:
$32,011
State:
$33,869
(% of AGI for various income ranges: 154.3% for AGIs below $25k, 353.1% for AGIs $50k-75k, 674.8% for AGIs $100k-200k, 3857.5% for AGIs over 200k)
Charity contributions: $15,440 (reported on 5.2% of returns)
Here:
$15,440
State:
$14,577
(% of AGI for various income ranges: 157.7% for AGIs $50k-75k, 261.2% for AGIs $100k-200k, 2255.0% for AGIs over 200k)
Taxes paid: $6,267 (reported on 6.2% of returns)
45817:
$6,267
State:
$7,681
(% of AGI for various income ranges: 15.3% for AGIs below $25k, 40.0% for AGIs $50k-75k, 161.5% for AGIs $100k-200k, 950.0% for AGIs over 200k)
Earned income credit: $1,932 (reported on 7.6% of returns)
Here:
$1,932
State:
$2,304
(% of AGI for various income ranges: 40.6% for AGIs below $25k, 48.1% for AGIs $25k-50k)
Percentage of individuals using paid preparers for their 2020 taxes: 93.8%
Here:
94%
State:
94%
(% for various income ranges: 91.8% for AGIs below $25k, 95.2% for AGIs $25k-50k, 94.1% for AGIs $50k-75k, 91.9% for AGIs $75k-100k, 94.4% for AGIs $100k-200k, 100.0% for AGIs over 200k)
Averages for the 2012 tax year for zip code 45817, filed in 2013:
Average Adjusted Gross Income (AGI) in 2012: $58,203 (Individual Income Tax Returns)
Here:
$58,203
State:
$54,926
Salary/wage: $48,158 (reported on 82.2% of returns)
Here:
$48,158
State:
$45,869
(% of AGI for various income ranges: 70.1% for AGIs below $25k, 72.0% for AGIs $25k-50k, 73.1% for AGIs $50k-75k, 74.1% for AGIs $75k-100k, 69.7% for AGIs $100k-200k, 48.0% for AGIs over 200k)
Taxable interest for individuals: $1,021 (reported on 42.4% of returns)
This zip code:
$1,021
Ohio:
$1,297
(% of AGI for various income ranges: 1.7% for AGIs below $25k, 0.7% for AGIs $25k-50k, 0.8% for AGIs $50k-75k, 0.6% for AGIs $75k-100k, 0.5% for AGIs $100k-200k, 0.8% for AGIs over 200k)
Ordinary dividends: $3,465 (reported on 28.3% of returns)
Here:
$3,465
State:
$5,821
(% of AGI for various income ranges: 2.6% for AGIs below $25k, 1.4% for AGIs $25k-50k, 1.3% for AGIs $50k-75k, 1.6% for AGIs $75k-100k, 1.7% for AGIs $100k-200k, 2.1% for AGIs over 200k)
Net capital gain/loss in AGI: +$5,938 (reported on 20.5% of returns)
Here:
+$5,938
State:
+$11,232
(% of AGI for various income ranges: 0.7% for AGIs $50k-75k, 1.0% for AGIs $75k-100k, 1.4% for AGIs $100k-200k, 9.0% for AGIs over 200k)
Profit/loss from business: +$10,013 (reported on 15.2% of returns)
Here:
+$10,013
State:
+$12,773
(% of AGI for various income ranges: 5.2% for AGIs below $25k, 1.7% for AGIs $25k-50k, 1.5% for AGIs $50k-75k, 2.5% for AGIs $75k-100k, 4.9% for AGIs $100k-200k)
Taxable individual retirement arrangement distribution: $11,142 (reported on 15.2% of returns)
45817:
$11,142
Ohio:
$14,511
(% of AGI for various income ranges: 4.5% for AGIs below $25k, 2.6% for AGIs $25k-50k, 2.2% for AGIs $50k-75k, 2.4% for AGIs $75k-100k, 5.3% for AGIs $100k-200k)
Self-employment retirement plans: $14,650 (reported on 0.7% of returns)
45817:
$14,650
Ohio:
$20,257
(% of AGI for various income ranges: 0.9% for AGIs $50k-75k)
Total itemized deductions: $19,431 (19% of AGI, reported on 32.7% of returns)
Here:
$19,431
State:
$21,278
Here:
18.9% of AGI
State:
18.8% of AGI
(% of AGI for various income ranges: 8.6% for AGIs below $25k, 8.9% for AGIs $25k-50k, 9.2% for AGIs $50k-75k, 10.8% for AGIs $75k-100k, 13.1% for AGIs $100k-200k, 12.2% for AGIs over 200k)
Charity contributions: $6,382 (reported on 25.9% of returns)
Here:
$6,382
State:
$3,943
(% of AGI for various income ranges: 0.9% for AGIs below $25k, 1.7% for AGIs $25k-50k, 2.1% for AGIs $50k-75k, 2.6% for AGIs $75k-100k, 3.6% for AGIs $100k-200k, 4.6% for AGIs over 200k)
Taxes paid: $7,209 (reported on 32.3% of returns)
45817:
$7,209
State:
$9,568
(% of AGI for various income ranges: 1.5% for AGIs below $25k, 1.6% for AGIs $25k-50k, 2.7% for AGIs $50k-75k, 3.9% for AGIs $75k-100k, 5.6% for AGIs $100k-200k, 6.2% for AGIs over 200k)
Earned income credit: $1,948 (reported on 9.8% of returns)
Here:
$1,948
State:
$2,285
(% of AGI for various income ranges: 3.9% for AGIs below $25k, 0.6% for AGIs $25k-50k)
Percentage of individuals using paid preparers for their 2012 taxes: 59.6%
Here:
60%
State:
51%
(% for various income ranges: 49.5% for AGIs below $25k, 62.9% for AGIs $25k-50k, 65.4% for AGIs $50k-75k, 60.0% for AGIs $75k-100k, 65.7% for AGIs $100k-200k, 87.5% for AGIs over 200k)
Averages for the 2004 tax year for zip code 45817, filed in 2005:
Average Adjusted Gross Income (AGI) in 2004: $43,701 (Individual Income Tax Returns)
Here:
$43,701
State:
$44,480
Salary/wage: $39,769 (reported on 83.9% of returns)
Here:
$39,769
State:
$39,198
(% of AGI for various income ranges: 99.3% for AGIs below $10k, 68.3% for AGIs $10k-25k, 77.4% for AGIs $25k-50k, 81.1% for AGIs $50k-75k, 81.8% for AGIs $75k-100k, 68.8% for AGIs over 100k)
Taxable interest for individuals: $1,422 (reported on 54.6% of returns)
This zip code:
$1,422
Ohio:
$1,532
(% of AGI for various income ranges: 6.2% for AGIs below $10k, 3.9% for AGIs $10k-25k, 1.7% for AGIs $25k-50k, 1.2% for AGIs $50k-75k, 1.4% for AGIs $75k-100k, 1.7% for AGIs over 100k)
Taxable dividends: $3,651 (reported on 33.2% of returns)
Here:
$3,651
State:
$3,496
(% of AGI for various income ranges: 3.9% for AGIs below $10k, 2.9% for AGIs $10k-25k, 1.9% for AGIs $25k-50k, 1.6% for AGIs $50k-75k, 1.9% for AGIs $75k-100k, 4.9% for AGIs over 100k)
Net capital gain/loss: +$3,772 (reported on 25.1% of returns)
Here:
+$3,772
State:
+$8,582
(% of AGI for various income ranges: -1.3% for AGIs below $10k, 0.9% for AGIs $10k-25k, 0.8% for AGIs $25k-50k, 0.7% for AGIs $50k-75k, 1.5% for AGIs $75k-100k, 5.5% for AGIs over 100k)
Profit/loss from business: +$10,876 (reported on 14.6% of returns)
Here:
+$10,876
State:
+$10,813
(% of AGI for various income ranges: 7.8% for AGIs below $10k, 2.8% for AGIs $10k-25k, 3.1% for AGIs $25k-50k, 2.5% for AGIs $50k-75k, 1.4% for AGIs $75k-100k, 6.3% for AGIs over 100k)
IRA payment deduction: $3,241 (reported on 2.7% of returns)
45817:
$3,241
Ohio:
$2,794
(% of AGI for various income ranges: 0.3% for AGIs $10k-25k, 0.2% for AGIs $25k-50k, 0.2% for AGIs $50k-75k, 0.3% for AGIs over 100k)
Self-employed pension: $14,217 (reported on 0.8% of returns)
Here:
$14,217
Ohio:
$13,981
Total itemized deductions: $15,495 (21% of AGI, reported on 35.5% of returns)
Here:
$15,495
State:
$17,503
Here:
20.9% of AGI
State:
20.8% of AGI
(% of AGI for various income ranges: 15.4% for AGIs below $10k, 10.4% for AGIs $10k-25k, 10.5% for AGIs $25k-50k, 11.8% for AGIs $50k-75k, 14.5% for AGIs $75k-100k, 14.3% for AGIs over 100k)
Charity contributions deductions: $4,399 (6% of AGI, reported on 28.4% of returns)
Here:
$4,399
State:
$3,087
Here:
5.7% of AGI
State:
3.4% of AGI
(% of AGI for various income ranges: 0.7% for AGIs below $10k, 1.7% for AGIs $10k-25k, 2.1% for AGIs $25k-50k, 2.6% for AGIs $50k-75k, 3.5% for AGIs $75k-100k, 3.8% for AGIs over 100k)
Total tax: $5,705 (reported on 79.1% of returns)
45817:
$5,705
State:
$6,781
(% of AGI for various income ranges: 3.5% for AGIs below $10k, 4.3% for AGIs $10k-25k, 7.4% for AGIs $25k-50k, 8.5% for AGIs $50k-75k, 9.9% for AGIs $75k-100k, 16.6% for AGIs over 100k)
Earned income credit: $1,414 (reported on 7.2% of returns)
Here:
$1,414
State:
$1,696
Percentage of individuals using paid preparers for their 2004 taxes: 59.5%
Here:
59%
State:
55%
(% for various income ranges: 45.2% for AGIs below $10k, 62.5% for AGIs $10k-25k, 65.3% for AGIs $25k-50k, 59.9% for AGIs $50k-75k, 60.1% for AGIs $75k-100k, 67.0% for AGIs over 100k)
Household received Food Stamps/SNAP in the past 12 months: 38 Household did not receive Food Stamps/SNAP in the past 12 months: 2,455
Women who had a birth in the past 12 months: 65 (58 now married, 7 unmarried) Women who did not have a birth in the past 12 months: 1,056 (540 now married, 514 unmarried)
Housing units in zip code 45817 with a mortgage: 1,130 (168 second mortgage, 154 both second mortgage and home equity loan) Houses without a mortgage: 93
Median monthly owner costs for units with a mortgage: $1,258 Median monthly owner costs for units without a mortgage: $505
Residents with income below the poverty level in 2022:
This zip code:
1.5%
Whole state:
13.4%
Residents with income below 50% of the poverty level in 2022:
This zip code:
0.5%
Whole state:
7.0%
Median number of rooms in houses and condos:
Here:
6.8
State:
6.7
Median number of rooms in apartments:
Here:
4.1
State:
4.4
Notable locations in this zip code not listed on our city pages
Notable locations in zip code 45817: Stratton Greenhouses (A), Bluffton Emergency Medical Services (B), Bluffton Fire Department (C), Ropp Hall (D), Musselman Library (E), Lincoln Hall (F), College Hall (G), Bluffton Town Hall (H), Bluffton-Richland Public Library (I). Display/hide their locations on the map
Churches in zip code 45817 include: Bethesda Church (A), Ebenezer Church (B), Emmanuel Church (C), Saint Marys Roman Catholic Church (D), Saint Johns Reformed Church (E), First Presbyterian Church (F), First Methodist Episcopal Church (G), First Mennonite Church (H), First Evangelical Lutheran Church (I). Display/hide their locations on the map
Cemeteries: Thompson Cemetery (1), Gratz Cemetery (2), Schellbas Cemetery (3), Clymer Cemetery (4), Woodlawn Cemetery (5), Zion Cemetery (6), Shannon Cemetery (7). Display/hide their locations on the map
In group quarters: 348 (-1 institutionalized population)
Size of family households: 841 2-persons, 249 3-persons, 227 4-persons, 112 5-persons, 98 6-persons, 44 7-or-more-persons
Size of nonfamily households: 844 1-person, 60 2-persons, 21 3-persons
1,223 married couples with children.
198 single-parent households (39 men, 159 women).
98.2% of residents of 45817 zip code speak English at home.
1.3% of residents speak Spanish at home (4% very well, 96% not well).
1.2% of residents speak other Indo-European language at home (55% very well, 27% well, 18% not well).
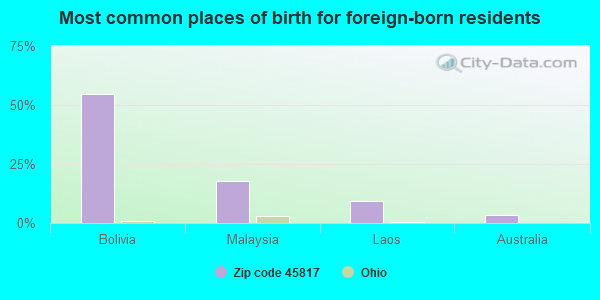
Foreign born population: 150 (2.4%) (50.1% of them are naturalized citizens)
This zip code:
2.4%
Whole state:
5.0%
55%Bolivia
18%Malaysia
9%Laos
3%Australia
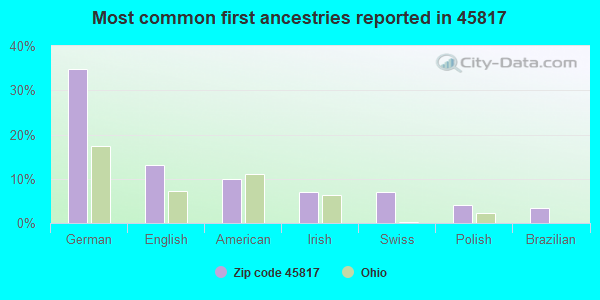
35%German
13%English
10%American
7%Irish
7%Swiss
4%Polish
3%Brazilian
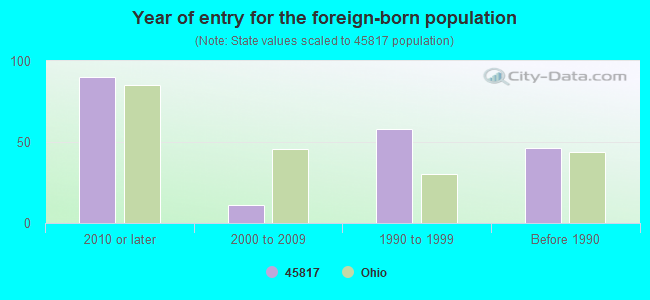
Year of entry for the foreign-born population
902010 or later
112000 to 2009
581990 to 1999
46Before 1990
Major facilities with environmental interests located in this zip code:
BLUFFTON PLANT NO 3 * (310 QUARRY in BLUFFTON, OH)
STATE MASTER (Ohio general info) - -02-2951-987-1, EPCRA National Pollutant Discharge Elimination System NON-MAJOR (Tracking pollutant discharge elimination systems) - permit Business SIC classification: CRUSHED AND BROKEN LIMESTONE Organizations: BLUFFTON STONE COMPANY (CONTACT/OWNER)
Alternative names: BLUFFTON STONE COMPANY
BLUFFTON STONE COMPANY BLUFFTON FACILITY * (26 EAST KIBLER STREET in BLUFFTON, OH)
AIR MINOR (AIRS/AFS) (Integrated Compliance Information System) - ICIS-05-2003-0234, FORMAL ENFORCEMENT ACTION, ENFORCEMENT/COMPLIANCE ACTIVITY STATE MASTER (Ohio general info) - PCS-OH0003565, National Pollutant Discharge Elimination System Permit, AIR MAJOR, EPCRA Business SIC classification: CRUSHED AND BROKEN LIMESTONE
AMOCO FERTILIZER PLANT (COUNTY LINE RD & RAILROAD ST in BLUFFTON, OH)
STATE MASTER (Ohio general info) - RCRA-OHD000721969, HAZARDOUS WASTE PROGRAM (Resource Conservation and Recovery Act (tracking hazardous waste))
AT&T LONG LINES BLUFFTON OH (15821 COUNTY RD 15 ROUTE 2 in BLUFFTON, OH)
STATE MASTER (Ohio general info) - RCRA-OHD099975187, HAZARDOUS WASTE PROGRAM (Resource Conservation and Recovery Act (tracking hazardous waste)) Organizations: AMERICAN TELEPHONE AND TELEGRAPH (CONTACT/OWNER)
STATE MASTER (Ohio general info) - RCRA-OHR000027532, HAZARDOUS WASTE PROGRAM Small Quantity Generators, between 100 kg and 1000 kg of hazardous waste/month (Resource Conservation and Recovery Act (tracking hazardous waste)) - notification Organizations: CALVIN E ROEDER (CONTACT/OWNER)
ANDERSON TRACTOR SUPPLY INC (20968 TR 51 in BLUFFTON, OH)
STATE MASTER (Ohio general info) - RCRA-OHD987021649, HAZARDOUS WASTE PROGRAM Small Quantity Generators, between 100 kg and 1000 kg of hazardous waste/month (Resource Conservation and Recovery Act (tracking hazardous waste)) - notification Organizations: ANDERSON RANDAL (CONTACT/OWNER)
BLUFFTON ELEMENTARY SCHOOL (102 S JACKSON ST in BLUFFTON, OH)
(Geographic Names Information System) (National Center for Education Statistics) - STATE ID-003020 Organizations: BLUFFTON EX VILL SD (SCHOOL DISTRICT)
BLUFFTON HIGH SCHOOL (106 W COLLEGE AVE in BLUFFTON, OH)
(Geographic Names Information System) (National Center for Education Statistics) - STATE ID-003038 Organizations: BLUFFTON EX VILL SD (SCHOOL DISTRICT)
BLUFFTON MIDDLE SCHOOL (116 S JACKSON ST in BLUFFTON, OH)
(National Center for Education Statistics) - STATE ID-127639 Organizations: BLUFFTON EX VILL SD (SCHOOL DISTRICT)
BLUFFTON VILLAGE OF WW TREATMENT (8BLKS FM MAIN ST ON SNIDER RD in BLUFFTON, OH)
(Resource Conservation and Recovery Act (tracking hazardous waste))
A TO Z PORTION MEATS (201 N MAIN in BLUFFTON, OH)
AIR MINOR (AIRS/AFS) Business SIC classification: MEAT PACKING PLANTS
BLUFFTON NEWS PUBLISHING AND PRINTING CO (101 N MAIN ST in BLUFFTON, OH)
Small Quantity Generators, between 100 kg and 1000 kg of hazardous waste/month (Resource Conservation and Recovery Act (tracking hazardous waste)) Organizations: TOM EDWARDS / BLUFFTON NEWS (CONTACT/OPERATOR)
, TOM EDWARDS (CONTACT/OWNER)
Housing units lacking complete kitchen facilities: 0.2%
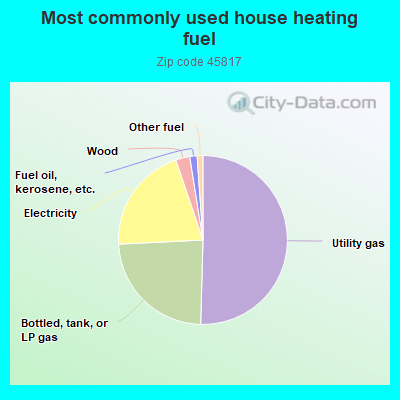
50.5%Utility gas
23.8%Bottled, tank, or LP gas
20.6%Electricity
2.7%Wood
1.4%Fuel oil, kerosene, etc.
1.1%Other fuel
Population in 1990: 6,055. Population change in the 1990s: +448 (+7.4%).
Place of birth for U.S.-born residents:
This state: 5,132
Northeast: 192
Midwest: 306
South: 285
West: 76
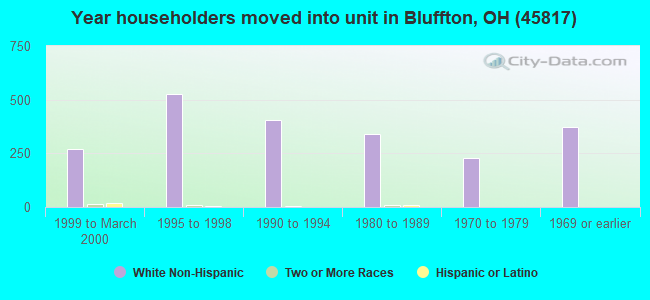
59% of the 45817 zip code residents lived in the same house 5 years ago. Out of people who lived in different houses, 55% lived in this county. Out of people who lived in different counties, 50% lived in Ohio.
93% of the 45817 zip code residents lived in the same house 1 year ago. Out of people who lived in different houses, 64% moved from this county. Out of people who lived in different houses, 9% moved from different county within same state. Out of people who lived in different houses, 28% moved from different state.
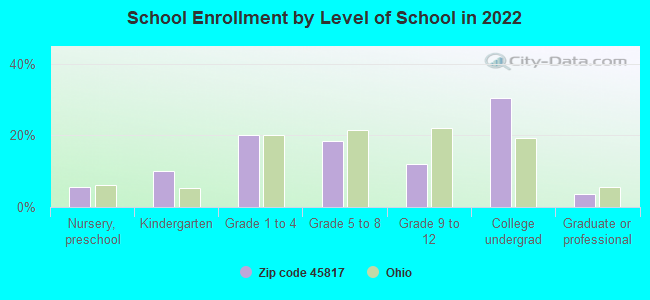
Private vs. public school enrollment:
Students in private schools in grades 1 to 8 (elementary and middle school): 92
Here:
15.0%
Ohio:
16.0%
Students in private schools in grades 9 to 12 (high school): 20
Here:
10.6%
Ohio:
13.1%
Students in private undergraduate colleges: 229
Here:
47.1%
Ohio:
22.3%
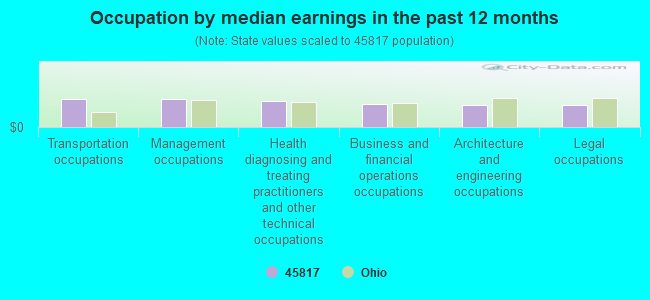
Occupation by median earnings in the past 12 months ($)
83,494Transportation occupations
82,163Management occupations
75,320Health diagnosing and treating practitioners and other technical occupations
67,740Business and financial operations occupations
65,865Architecture and engineering occupations
65,652Legal occupations
Top industries in this zip code by the number of employees in 2005:
Educational Services: Colleges, Universities, and Professional Schools (500-999 employees: 1 establishment)
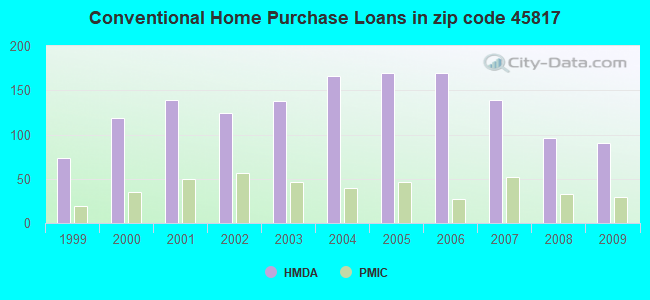
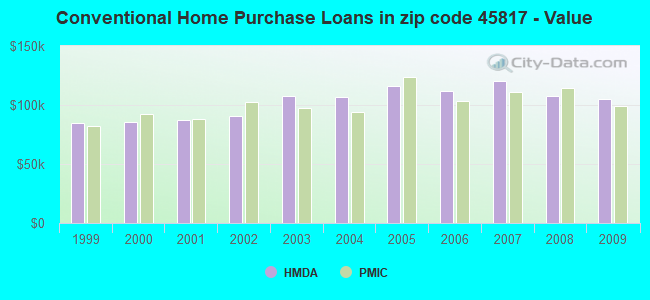
Detailed PMIC statistics for the following Tracts:0101.00
, 0102.00
2002 - 2018 National Fire Incident Reporting System (NFIRS) incidents
According to the data from the years 2002 - 2018 the average number of fire incidents per year is 23. The highest number of fire incidents - 42 took place in 2014, and the least - 11 in 2003. The data has a rising trend.
When looking into fire subcategories, the most incidents belonged to: Outside Fires (37.9%), and Structure Fires (33.6%).
Fire incident types reported to NFIRS in Zip Code 45817

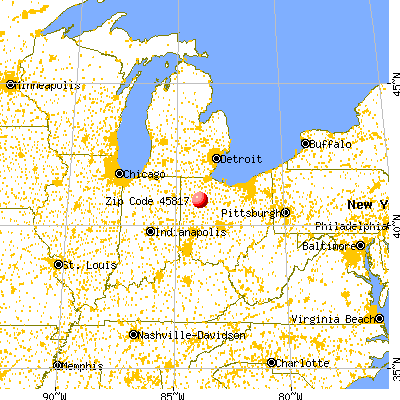


 Nearest zip codes: 45868, 45877, 45808, 45810, 45881, 45854.


 According to the data from the years 2002 - 2018 the average number of fire incidents per year is 23. The highest number of fire incidents - 42 took place in 2014, and the least - 11 in 2003. The data has a rising trend.
 When looking into fire subcategories, the most incidents belonged to: Outside Fires (37.9%), and Structure Fires (33.6%).