Estimated zip code population in 2022: 3,474 Zip code population in 2010: 3,494 Zip code population in 2000: 3,734
Houses and condos: 1,455 Renter-occupied apartments: 171
% of renters here:
14%
State:
33%
March 2022 cost of living index in zip code 45623: 83.3 (low, U.S. average is 100)
Land area: 72.3 sq. mi. Water area: 0.5 sq. mi.
Population density: 48 people per square mile
(very low).
OSM Map
General Map
Google Map
MSN Map
OSM Map
General Map
Google Map
MSN Map
OSM Map
General Map
Google Map
MSN Map
OSM Map
General Map
Google Map
MSN Map
Please wait while loading the map...
Real estate property taxes paid for housing units in 2022:
This zip code:
0.8% ($1,212)
Ohio:
1.3% ($2,639)
Median real estate property taxes paid for housing units with mortgages in 2022: $1,757 (0.9%) Median real estate property taxes paid for housing units with no mortgage in 2022: $899 (0.9%)
Business Search- 14 Million verified businesses
Males: 1,812
(52.2%)
Females: 1,662
(47.8%)
For population 25 years and over in 45623:
High school or higher: 80.3%
Bachelor's degree or higher: 13.5%
Graduate or professional degree: 6.3%
Unemployed: 3.6%
Mean travel time to work (commute): 23.4 minutes
For population 15 years and over in 45623:
Never married: 20.3%
Now married: 59.0%
Separated: 0.5%
Widowed: 5.6%
Divorced: 14.6%
Zip code 45623 compared to state average:
Black race population percentage significantly below state average.
Hispanic race population percentage below state average.
Foreign-born population percentage significantly below state average.
Renting percentage significantly below state average.
Length of stay since moving in significantly above state average.
House age below state average.
Percentage of population with a bachelor's degree or higher significantly below state average.
Estimated median house/condo value in 2022: $148,204
45623:
$148,204
Ohio:
$204,100
According to our research of Ohio and other state lists, there were 3 registered sex offenders living in 45623 zip code as of May 29, 2024. The ratio of all residents to sex offenders in zip code 45623 is 1,030 to 1. The ratio of registered sex offenders to all residents in this zip code is lower than the state average.
Median resident age:
This zip code:
41.3 years
Ohio median age:
39.9 years
Average household size:
This zip code:
2.8 people
Ohio:
2.4 people
Averages for the 2020 tax year for zip code 45623, filed in 2021:
Average Adjusted Gross Income (AGI) in 2020: $50,976 (Individual Income Tax Returns)
Here:
$50,976
State:
$67,288
Salary/wage: $48,917 (reported on 81.4% of returns)
Here:
$48,917
State:
$55,628
(% of AGI for various income ranges: 1211.1% for AGIs below $25k, 3468.9% for AGIs $25k-50k, 6186.7% for AGIs $50k-75k, 8506.4% for AGIs $75k-100k, 18774.0% for AGIs $100k-200k)
Taxable interest for individuals: $717 (reported on 17.8% of returns)
This zip code:
$717
Ohio:
$1,518
(% of AGI for various income ranges: 4.6% for AGIs below $25k, 7.9% for AGIs $25k-50k, 32.0% for AGIs $50k-75k, 14.5% for AGIs $75k-100k, 63.0% for AGIs $100k-200k)
Ordinary dividends: $1,700 (reported on 10.1% of returns)
Here:
$1,700
State:
$7,167
(% of AGI for various income ranges: 6.0% for AGIs below $25k, 13.9% for AGIs $25k-50k, 34.7% for AGIs $50k-75k, 109.0% for AGIs $100k-200k)
Net capital gain/loss in AGI: +$4,022 (reported on 7.0% of returns)
Here:
+$4,022
State:
+$18,919
(% of AGI for various income ranges: 9.7% for AGIs below $25k, 10.0% for AGIs $50k-75k, 313.0% for AGIs $100k-200k)
Profit/loss from business: +$8,753 (reported on 13.2% of returns)
Here:
+$8,753
State:
+$13,744
(% of AGI for various income ranges: 100.0% for AGIs below $25k, 123.9% for AGIs $25k-50k, 475.3% for AGIs $50k-75k, 78.0% for AGIs $100k-200k)
Taxable individual retirement arrangement distribution: $13,240 (reported on 3.9% of returns)
45623:
$13,240
Ohio:
$18,876
(% of AGI for various income ranges: 77.7% for AGIs below $25k, 260.0% for AGIs $50k-75k)
Earned income credit: $2,530 (reported on 20.9% of returns)
Here:
$2,530
State:
$2,304
(% of AGI for various income ranges: 127.4% for AGIs below $25k, 84.6% for AGIs $25k-50k)
Percentage of individuals using paid preparers for their 2020 taxes: 93.8%
Here:
94%
State:
94%
(% for various income ranges: 93.5% for AGIs below $25k, 94.3% for AGIs $25k-50k, 94.7% for AGIs $50k-75k, 92.9% for AGIs $75k-100k, 93.3% for AGIs $100k-200k)
Averages for the 2012 tax year for zip code 45623, filed in 2013:
Average Adjusted Gross Income (AGI) in 2012: $38,796 (Individual Income Tax Returns)
Here:
$38,796
State:
$54,926
Salary/wage: $37,393 (reported on 81.8% of returns)
Here:
$37,393
State:
$45,869
(% of AGI for various income ranges: 66.7% for AGIs below $25k, 77.8% for AGIs $25k-50k, 83.2% for AGIs $50k-75k, 82.1% for AGIs $75k-100k, 81.2% for AGIs $100k-200k)
Taxable interest for individuals: $528 (reported on 24.2% of returns)
This zip code:
$528
Ohio:
$1,297
(% of AGI for various income ranges: 0.6% for AGIs below $25k, 0.3% for AGIs $25k-50k, 0.3% for AGIs $50k-75k, 0.4% for AGIs $75k-100k, 0.1% for AGIs $100k-200k)
Ordinary dividends: $1,175 (reported on 9.1% of returns)
Here:
$1,175
State:
$5,821
(% of AGI for various income ranges: 0.4% for AGIs below $25k, 0.3% for AGIs $25k-50k, 0.4% for AGIs $50k-75k, 0.4% for AGIs $75k-100k)
Net capital gain/loss in AGI: +$1,200 (reported on 6.8% of returns)
Here:
+$1,200
State:
+$11,232
(% of AGI for various income ranges: 0.1% for AGIs below $25k, 1.0% for AGIs $75k-100k)
Profit/loss from business: +$6,904 (reported on 17.4% of returns)
Here:
+$6,904
State:
+$12,773
(% of AGI for various income ranges: 11.5% for AGIs below $25k, 3.8% for AGIs $25k-50k, 0.2% for AGIs $50k-75k, 2.7% for AGIs $75k-100k)
Taxable individual retirement arrangement distribution: $8,225 (reported on 6.1% of returns)
45623:
$8,225
Ohio:
$14,511
(% of AGI for various income ranges: 3.6% for AGIs below $25k, 3.5% for AGIs $50k-75k)
Total itemized deductions: $18,312 (22% of AGI, reported on 12.9% of returns)
Here:
$18,312
State:
$21,278
Here:
21.9% of AGI
State:
18.8% of AGI
(% of AGI for various income ranges: 5.0% for AGIs $25k-50k, 6.7% for AGIs $50k-75k, 6.3% for AGIs $75k-100k, 10.6% for AGIs $100k-200k)
Charity contributions: $3,227 (reported on 8.3% of returns)
Here:
$3,227
State:
$3,943
(% of AGI for various income ranges: 0.6% for AGIs $25k-50k, 0.3% for AGIs $50k-75k, 1.2% for AGIs $75k-100k, 1.3% for AGIs $100k-200k)
Taxes paid: $4,471 (reported on 12.9% of returns)
45623:
$4,471
State:
$9,568
(% of AGI for various income ranges: 0.8% for AGIs $25k-50k, 1.3% for AGIs $50k-75k, 1.7% for AGIs $75k-100k, 3.4% for AGIs $100k-200k)
Earned income credit: $2,576 (reported on 25.8% of returns)
Here:
$2,576
State:
$2,285
(% of AGI for various income ranges: 9.7% for AGIs below $25k, 1.3% for AGIs $25k-50k)
Percentage of individuals using paid preparers for their 2012 taxes: 63.6%
Here:
64%
State:
51%
(% for various income ranges: 61.0% for AGIs below $25k, 64.9% for AGIs $25k-50k, 66.7% for AGIs $50k-75k, 70.0% for AGIs $75k-100k, 62.5% for AGIs $100k-200k)
Averages for the 2004 tax year for zip code 45623, filed in 2005:
Average Adjusted Gross Income (AGI) in 2004: $29,207 (Individual Income Tax Returns)
Here:
$29,207
State:
$44,480
Salary/wage: $29,081 (reported on 84.2% of returns)
Here:
$29,081
State:
$39,198
(% of AGI for various income ranges: 77.4% for AGIs below $10k, 78.2% for AGIs $10k-25k, 86.5% for AGIs $25k-50k, 89.0% for AGIs $50k-75k, 92.1% for AGIs $75k-100k, 68.6% for AGIs over 100k)
Taxable interest for individuals: $985 (reported on 30.4% of returns)
This zip code:
$985
Ohio:
$1,532
(% of AGI for various income ranges: 3.4% for AGIs below $10k, 1.7% for AGIs $10k-25k, 1.1% for AGIs $25k-50k, 0.7% for AGIs $50k-75k, 0.2% for AGIs $75k-100k, 0.4% for AGIs over 100k)
Taxable dividends: $878 (reported on 10.6% of returns)
Here:
$878
State:
$3,496
(% of AGI for various income ranges: 0.4% for AGIs below $10k, 0.3% for AGIs $10k-25k, 0.4% for AGIs $25k-50k, 0.5% for AGIs $50k-75k, 0.3% for AGIs over 100k)
Net capital gain/loss: +$1,096 (reported on 6.4% of returns)
Here:
+$1,096
State:
+$8,582
Profit/loss from business: +$4,608 (reported on 15.6% of returns)
Here:
+$4,608
State:
+$10,813
(% of AGI for various income ranges: 20.7% for AGIs below $10k, 7.5% for AGIs $10k-25k, 0.6% for AGIs $25k-50k, 0.3% for AGIs $50k-75k)
IRA payment deduction: $2,250 (reported on 1.8% of returns)
45623:
$2,250
Ohio:
$2,794
Total itemized deductions: $13,800 (23% of AGI, reported on 14.9% of returns)
Here:
$13,800
State:
$17,503
Here:
22.8% of AGI
State:
20.8% of AGI
(% of AGI for various income ranges: 3.9% for AGIs $10k-25k, 5.4% for AGIs $25k-50k, 11.2% for AGIs $50k-75k, 9.4% for AGIs $75k-100k, 8.8% for AGIs over 100k)
Charity contributions deductions: $2,072 (3% of AGI, reported on 10.6% of returns)
Here:
$2,072
State:
$3,087
Here:
3.3% of AGI
State:
3.4% of AGI
(% of AGI for various income ranges: 0.6% for AGIs $10k-25k, 0.5% for AGIs $25k-50k, 1.1% for AGIs $50k-75k, 0.8% for AGIs $75k-100k, 1.4% for AGIs over 100k)
Total tax: $3,154 (reported on 66.7% of returns)
45623:
$3,154
State:
$6,781
(% of AGI for various income ranges: 3.4% for AGIs below $10k, 3.7% for AGIs $10k-25k, 5.7% for AGIs $25k-50k, 8.0% for AGIs $50k-75k, 9.6% for AGIs $75k-100k, 15.0% for AGIs over 100k)
Earned income credit: $1,876 (reported on 25.9% of returns)
Here:
$1,876
State:
$1,696
Percentage of individuals using paid preparers for their 2004 taxes: 68.1%
Here:
68%
State:
55%
(% for various income ranges: 58.3% for AGIs below $10k, 71.1% for AGIs $10k-25k, 72.8% for AGIs $25k-50k, 70.9% for AGIs $50k-75k, 68.1% for AGIs $75k-100k, 66.7% for AGIs over 100k)
Household received Food Stamps/SNAP in the past 12 months: 206 Household did not receive Food Stamps/SNAP in the past 12 months: 1,042
Women who had a birth in the past 12 months: 1 (0 now married, 1 unmarried) Women who did not have a birth in the past 12 months: 730 (444 now married, 285 unmarried)
Housing units in zip code 45623 with a mortgage: 467 (31 second mortgage, 31 both second mortgage and home equity loan) Houses without a mortgage: 21
Median monthly owner costs for units with a mortgage: $1,170 Median monthly owner costs for units without a mortgage: $379
Residents with income below the poverty level in 2022:
This zip code:
10.8%
Whole state:
13.4%
Residents with income below 50% of the poverty level in 2022:
This zip code:
6.4%
Whole state:
7.0%
Median number of rooms in houses and condos:
Here:
6.1
State:
6.7
Median number of rooms in apartments:
Here:
5.1
State:
4.4
Notable locations in this zip code not listed on our city pages
Notable locations in zip code 45623: Smalls Landing (A), McFanns Landing (B), Hannon Landing (C), Cottonwood Landing (D), Barkers Landing (E), Waughs Landing (F), Crown City Fire Department (G), Gallia County District Two Volunteer Fire Department (H), Rome Volunteer Fire Department Station 2 (I). Display/hide their locations on the map
Churches in zip code 45623 include: Crown City Methodist Church (A), Mount Zion Baptist Church (B), Liberty Chapel (C), Kings Chapel (D), Providence Church (E), Swan Creek Church (F), Good Hope Church (G), Forest Glen Church (H), Elizabeth Chapel (I). Display/hide their locations on the map
Cemeteries: Bethel Methodist Episcopal Cemetery (1), Bethlehem Cemetery (2), Big Four Cemetery (3), Calloway Cemetery (4), Crown City Cemetery (5), Dickey Cemetery (6), Halley Cemetery (7). Display/hide their locations on the map
Streams, rivers, and creeks: Georges Creek (A), Federal Creek (B), Drake Fork Indian Guyan Creek (C), Double Creek (D), Dirty Fork (E), Clean Fork (F), Big Creek (G), Shoal Creek (H), Stillhouse Branch (I). Display/hide their locations on the map
Size of family households: 392 2-persons, 173 3-persons, 180 4-persons, 78 5-persons, 43 6-persons, 5 7-or-more-persons
Size of nonfamily households: 276 1-person, 92 2-persons
575 married couples with children.
84 single-parent households (42 men, 42 women).
99.2% of residents of 45623 zip code speak English at home.
0.7% of residents speak Spanish at home (100% very well).
Foreign born population: 51 (1.5%) (100.0% of them are naturalized citizens)
This zip code:
1.5%
Whole state:
5.0%
67%Iran
33%Honduras
10%Saudi Arabia
34%English
20%American
14%Irish
6%European
5%German
3%Scotch-Irish
2%French
Year of entry for the foreign-born population
02010 or later
262000 to 2009
61990 to 1999
14Before 1990
Facilities with environmental interests located in this zip code:
BARRICK GOLD ELPLORATION (3405 ROCKY FORK ROAD in CROWN CITY, OH)
COMPLIANCE ACTIVITY (Tracking inspections of insecticide, fungicide, and rodenticide, and toxic substances)
Housing units lacking complete plumbing facilities: 7.2% Housing units lacking complete kitchen facilities: 5.8%
51.0%Electricity
34.1%Bottled, tank, or LP gas
11.9%Wood
1.8%Utility gas
1.1%Fuel oil, kerosene, etc.
Population in 1990: 2,677. Population change in the 1990s: +1,057 (+39.5%).
Place of birth for U.S.-born residents:
This state: 1,817
Northeast: 21
Midwest: 92
South: 1,436
West: 17
60% of the 45623 zip code residents lived in the same house 5 years ago. Out of people who lived in different houses, 56% lived in this county. Out of people who lived in different counties, 50% lived in Ohio.
97% of the 45623 zip code residents lived in the same house 1 year ago. Out of people who lived in different houses, 99% moved from this county. Out of people who lived in different houses, 5% moved from different county within same state. Out of people who lived in different houses, 5% moved from different state.
Private vs. public school enrollment:
Students in private schools in grades 1 to 8 (elementary and middle school): 61
Here:
16.6%
Ohio:
16.0%
Students in private schools in grades 9 to 12 (high school):
Here:
0.0%
Ohio:
13.1%
Students in private undergraduate colleges:
Here:
0.0%
Ohio:
22.3%
Occupation by median earnings in the past 12 months ($)
101,882Health diagnosing and treating practitioners and other technical occupations
65,602Business and financial operations occupations
58,241Management occupations
50,526Education, training, and library occupations
49,626Production occupations
48,312Transportation occupations
Top industries in this zip code by the number of employees in 2005:
Other Services (except Public Administration): Religious Organizations (1-4 employees: 2 establishments)
Administrative and Support and Waste Management and Remediation Services: Landscaping Services (1-4: 1)
Construction: Site Preparation Contractors (1-4: 1)
Construction: Highway, Street, and Bridge Construction (1-4: 1)
Accommodation and Food Services: Drinking Places (Alcoholic Beverages) (1-4: 1)
Construction: Poured Concrete Foundation and Structure Contractors (1-4: 1)
Construction: All Other Specialty Trade Contractors (1-4: 1)
Fatal accident statistics in 2014:
Fatal accident count: 1
Vehicles involved in fatal accidents: 1
Fatal accidents caused by drunken drivers: 1
Fatalities: 1
Persons involved in fatal accidents: 1
Pedestrians involved in fatal accidents: 0
Fatal accident statistics in 2013:
Fatal accident count: 1
Vehicles involved in fatal accidents: 1
Fatal accidents caused by drunken drivers: 1
Fatalities: 1
Persons involved in fatal accidents: 1
Pedestrians involved in fatal accidents: 0
Home Mortgage Disclosure Act Aggregated Statistics For Year 2009 (Based on 2 partial tracts)
A) FHA, FSA/RHS & VA Home Purchase Loans
B) Conventional Home Purchase Loans
C) Refinancings
D) Home Improvement Loans
F) Non-occupant Loans on < 5 Family Dwellings (A B C & D)
G) Loans On Manufactured Home Dwelling (A B C & D)
Number
Average Value
Number
Average Value
Number
Average Value
Number
Average Value
Number
Average Value
Number
Average Value
LOANS ORIGINATED
21
$155,953
31
$137,705
132
$139,194
17
$32,961
4
$97,968
3
$89,160
APPLICATIONS APPROVED, NOT ACCEPTED
0
$0
2
$141,590
8
$103,854
2
$40,755
0
$0
0
$0
APPLICATIONS DENIED
6
$165,038
9
$128,944
40
$151,614
16
$24,454
1
$68,230
2
$85,135
APPLICATIONS WITHDRAWN
4
$107,022
4
$141,138
21
$124,124
1
$187,780
1
$41,060
2
$58,870
FILES CLOSED FOR INCOMPLETENESS
0
$0
1
$28,980
8
$145,591
0
$0
0
$0
0
$0
Aggregated Statistics For Year 2008 (Based on 2 partial tracts)
A) FHA, FSA/RHS & VA Home Purchase Loans
B) Conventional Home Purchase Loans
C) Refinancings
D) Home Improvement Loans
E) Loans on Dwellings For 5+ Families
F) Non-occupant Loans on < 5 Family Dwellings (A B C & D)
G) Loans On Manufactured Home Dwelling (A B C & D)
Number
Average Value
Number
Average Value
Number
Average Value
Number
Average Value
Number
Average Value
Number
Average Value
Number
Average Value
LOANS ORIGINATED
14
$123,003
44
$132,589
82
$123,705
24
$65,663
1
$317,000
13
$86,204
3
$82,720
APPLICATIONS APPROVED, NOT ACCEPTED
1
$70,040
4
$53,588
8
$81,438
1
$7,850
0
$0
1
$36,830
0
$0
APPLICATIONS DENIED
3
$127,603
8
$91,476
48
$125,125
21
$73,865
0
$0
2
$54,945
4
$60,380
APPLICATIONS WITHDRAWN
2
$182,350
8
$145,365
22
$112,773
3
$169,870
0
$0
1
$52,530
2
$78,795
FILES CLOSED FOR INCOMPLETENESS
1
$69,440
0
$0
3
$158,397
0
$0
0
$0
0
$0
0
$0
Aggregated Statistics For Year 2007 (Based on 2 partial tracts)
A) FHA, FSA/RHS & VA Home Purchase Loans
B) Conventional Home Purchase Loans
C) Refinancings
D) Home Improvement Loans
E) Loans on Dwellings For 5+ Families
F) Non-occupant Loans on < 5 Family Dwellings (A B C & D)
G) Loans On Manufactured Home Dwelling (A B C & D)
Number
Average Value
Number
Average Value
Number
Average Value
Number
Average Value
Number
Average Value
Number
Average Value
Number
Average Value
LOANS ORIGINATED
5
$114,602
75
$124,922
82
$108,920
35
$47,769
1
$422,660
15
$90,731
8
$58,266
APPLICATIONS APPROVED, NOT ACCEPTED
1
$77,290
5
$81,876
16
$92,306
7
$51,669
0
$0
2
$124,685
3
$63,197
APPLICATIONS DENIED
2
$134,045
11
$90,570
67
$115,182
20
$49,692
0
$0
5
$59,656
6
$66,720
APPLICATIONS WITHDRAWN
0
$0
5
$109,168
22
$123,669
2
$168,760
0
$0
1
$22,340
0
$0
FILES CLOSED FOR INCOMPLETENESS
0
$0
0
$0
4
$114,872
1
$72,460
0
$0
0
$0
1
$51,930
Aggregated Statistics For Year 2006 (Based on 2 partial tracts)
A) FHA, FSA/RHS & VA Home Purchase Loans
B) Conventional Home Purchase Loans
C) Refinancings
D) Home Improvement Loans
F) Non-occupant Loans on < 5 Family Dwellings (A B C & D)
G) Loans On Manufactured Home Dwelling (A B C & D)
Number
Average Value
Number
Average Value
Number
Average Value
Number
Average Value
Number
Average Value
Number
Average Value
LOANS ORIGINATED
4
$139,930
76
$121,443
101
$87,963
21
$39,362
14
$96,306
8
$51,851
APPLICATIONS APPROVED, NOT ACCEPTED
1
$84,530
8
$104,458
22
$82,748
5
$64,606
1
$78,490
2
$66,720
APPLICATIONS DENIED
2
$70,345
27
$84,174
89
$108,338
13
$35,949
6
$69,437
18
$59,441
APPLICATIONS WITHDRAWN
1
$44,680
7
$146,810
35
$126,971
2
$131,630
4
$74,870
2
$61,590
FILES CLOSED FOR INCOMPLETENESS
0
$0
2
$101,440
10
$136,640
1
$6,640
1
$26,570
0
$0
Aggregated Statistics For Year 2005 (Based on 2 partial tracts)
A) FHA, FSA/RHS & VA Home Purchase Loans
B) Conventional Home Purchase Loans
C) Refinancings
D) Home Improvement Loans
F) Non-occupant Loans on < 5 Family Dwellings (A B C & D)
G) Loans On Manufactured Home Dwelling (A B C & D)
Number
Average Value
Number
Average Value
Number
Average Value
Number
Average Value
Number
Average Value
Number
Average Value
LOANS ORIGINATED
5
$101,800
85
$114,537
106
$111,025
14
$38,514
15
$80,426
10
$35,805
APPLICATIONS APPROVED, NOT ACCEPTED
2
$59,775
9
$82,452
21
$74,670
4
$29,132
1
$96,610
5
$48,908
APPLICATIONS DENIED
3
$65,210
33
$82,391
80
$107,914
16
$32,153
2
$74,570
22
$62,411
APPLICATIONS WITHDRAWN
0
$0
12
$129,314
34
$154,040
5
$141,290
1
$105,670
1
$29,590
FILES CLOSED FOR INCOMPLETENESS
0
$0
3
$108,280
4
$146,722
1
$62,800
1
$74,270
0
$0
Aggregated Statistics For Year 2004 (Based on 2 partial tracts)
A) FHA, FSA/RHS & VA Home Purchase Loans
B) Conventional Home Purchase Loans
C) Refinancings
D) Home Improvement Loans
E) Loans on Dwellings For 5+ Families
F) Non-occupant Loans on < 5 Family Dwellings (A B C & D)
G) Loans On Manufactured Home Dwelling (A B C & D)
Number
Average Value
Number
Average Value
Number
Average Value
Number
Average Value
Number
Average Value
Number
Average Value
Number
Average Value
LOANS ORIGINATED
8
$90,192
97
$106,686
89
$105,970
20
$31,096
0
$0
14
$101,826
7
$40,713
APPLICATIONS APPROVED, NOT ACCEPTED
1
$89,360
11
$105,116
18
$94,025
2
$38,945
0
$0
1
$12,080
4
$36,078
APPLICATIONS DENIED
4
$64,455
33
$59,776
95
$101,292
18
$23,481
1
$13,280
6
$66,720
24
$42,216
APPLICATIONS WITHDRAWN
1
$89,360
8
$179,178
68
$106,198
5
$32,968
0
$0
1
$21,740
4
$76,080
FILES CLOSED FOR INCOMPLETENESS
0
$0
2
$207,705
14
$101,654
1
$10,870
0
$0
1
$53,740
0
$0
Aggregated Statistics For Year 2003 (Based on 2 partial tracts)
A) FHA, FSA/RHS & VA Home Purchase Loans
B) Conventional Home Purchase Loans
C) Refinancings
D) Home Improvement Loans
F) Non-occupant Loans on < 5 Family Dwellings (A B C & D)
Number
Average Value
Number
Average Value
Number
Average Value
Number
Average Value
Number
Average Value
LOANS ORIGINATED
7
$97,039
92
$114,971
205
$96,794
11
$21,353
19
$63,622
APPLICATIONS APPROVED, NOT ACCEPTED
1
$38,640
7
$63,744
31
$92,167
2
$43,170
2
$81,815
APPLICATIONS DENIED
3
$71,650
32
$45,738
89
$98,284
13
$24,616
5
$109,168
APPLICATIONS WITHDRAWN
1
$112,310
7
$131,370
48
$97,828
0
$0
3
$97,413
FILES CLOSED FOR INCOMPLETENESS
0
$0
1
$71,850
5
$119,914
1
$18,110
0
$0
Aggregated Statistics For Year 2002 (Based on 2 partial tracts)
A) FHA, FSA/RHS & VA Home Purchase Loans
B) Conventional Home Purchase Loans
C) Refinancings
D) Home Improvement Loans
E) Loans on Dwellings For 5+ Families
F) Non-occupant Loans on < 5 Family Dwellings (A B C & D)
Number
Average Value
Number
Average Value
Number
Average Value
Number
Average Value
Number
Average Value
Number
Average Value
LOANS ORIGINATED
9
$87,216
74
$97,367
130
$84,332
19
$22,086
1
$173,290
8
$100,231
APPLICATIONS APPROVED, NOT ACCEPTED
0
$0
14
$82,979
37
$69,159
5
$23,306
0
$0
1
$22,940
APPLICATIONS DENIED
1
$90,570
23
$48,278
55
$81,733
14
$20,356
0
$0
2
$92,380
APPLICATIONS WITHDRAWN
1
$38,040
4
$74,720
28
$91,497
2
$29,285
0
$0
0
$0
FILES CLOSED FOR INCOMPLETENESS
0
$0
2
$185,970
8
$104,835
1
$12,080
0
$0
0
$0
Aggregated Statistics For Year 2001 (Based on 2 partial tracts)
A) FHA, FSA/RHS & VA Home Purchase Loans
B) Conventional Home Purchase Loans
C) Refinancings
D) Home Improvement Loans
F) Non-occupant Loans on < 5 Family Dwellings (A B C & D)
Number
Average Value
Number
Average Value
Number
Average Value
Number
Average Value
Number
Average Value
LOANS ORIGINATED
6
$115,325
58
$91,778
134
$88,705
18
$23,146
5
$67,868
APPLICATIONS APPROVED, NOT ACCEPTED
3
$80,307
9
$67,760
18
$73,261
4
$26,568
1
$19,930
APPLICATIONS DENIED
1
$76,080
32
$45,776
57
$80,094
11
$26,128
4
$56,908
APPLICATIONS WITHDRAWN
2
$90,870
5
$67,868
36
$74,217
7
$14,404
0
$0
FILES CLOSED FOR INCOMPLETENESS
0
$0
1
$51,930
6
$103,652
0
$0
0
$0
Aggregated Statistics For Year 2000 (Based on 2 partial tracts)
A) FHA, FSA/RHS & VA Home Purchase Loans
B) Conventional Home Purchase Loans
C) Refinancings
D) Home Improvement Loans
E) Loans on Dwellings For 5+ Families
F) Non-occupant Loans on < 5 Family Dwellings (A B C & D)
Number
Average Value
Number
Average Value
Number
Average Value
Number
Average Value
Number
Average Value
Number
Average Value
LOANS ORIGINATED
4
$56,758
71
$81,028
47
$54,650
21
$24,871
1
$169,060
11
$60,600
APPLICATIONS APPROVED, NOT ACCEPTED
4
$52,832
15
$49,673
18
$57,462
3
$20,127
0
$0
1
$30,190
APPLICATIONS DENIED
4
$64,305
43
$46,787
37
$56,643
9
$18,651
0
$0
4
$22,038
APPLICATIONS WITHDRAWN
1
$62,800
8
$70,569
32
$64,286
4
$40,152
0
$0
1
$30,190
FILES CLOSED FOR INCOMPLETENESS
0
$0
0
$0
1
$101,440
0
$0
0
$0
0
$0
Aggregated Statistics For Year 1999 (Based on 1 partial tract)
A) FHA, FSA/RHS & VA Home Purchase Loans
B) Conventional Home Purchase Loans
C) Refinancings
D) Home Improvement Loans
F) Non-occupant Loans on < 5 Family Dwellings (A B C & D)
Detailed PMIC statistics for the following Tracts:0514.00
2002 - 2018 National Fire Incident Reporting System (NFIRS) incidents
According to the data from the years 2002 - 2018 the average number of fire incidents per year is 32. The highest number of fires - 51 took place in 2006, and the least - 9 in 2005. The data has a declining trend.
When looking into fire subcategories, the most reports belonged to: Outside Fires (45.5%), and Structure Fires (40.3%).
Fire incident types reported to NFIRS in Zip Code 45623

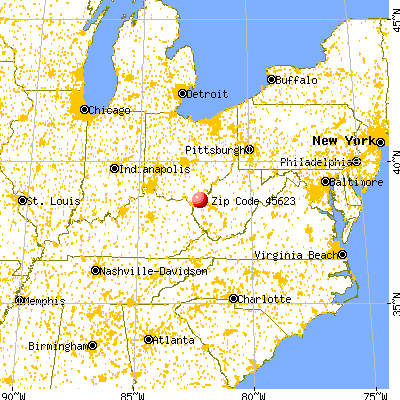


 Nearest zip codes: 25537, 45678, 25520, 25503, 25502, 25515.


 According to the data from the years 2002 - 2018 the average number of fire incidents per year is 32. The highest number of fires - 51 took place in 2006, and the least - 9 in 2005. The data has a declining trend.
 When looking into fire subcategories, the most reports belonged to: Outside Fires (45.5%), and Structure Fires (40.3%).