Estimated zip code population in 2022: 1,478 Zip code population in 2010: 1,993 Zip code population in 2000: 2,223
Houses and condos: 953 Renter-occupied apartments: 294
% of renters here:
40%
State:
26%
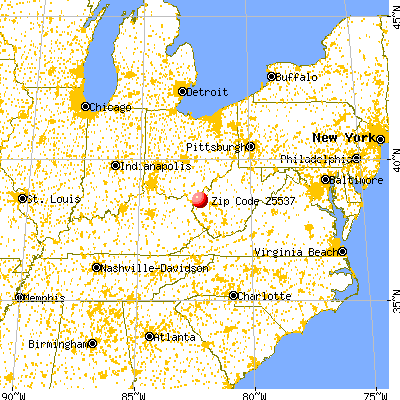
March 2022 cost of living index in zip code 25537: 84.5 (less than average, U.S. average is 100)
Land area: 21.2 sq. mi. Water area: 2.8 sq. mi.
Population density: 70 people per square mile
(very low).
OSM Map
General Map
Google Map
MSN Map
OSM Map
General Map
Google Map
MSN Map
OSM Map
General Map
Google Map
MSN Map
OSM Map
General Map
Google Map
MSN Map
Please wait while loading the map...
Real estate property taxes paid for housing units in 2022:
This zip code:
0.6% ($943)
West Virginia:
0.5% ($821)
Median real estate property taxes paid for housing units with mortgages in 2022: $1,189 (0.6%) Median real estate property taxes paid for housing units with no mortgage in 2022: $861 (0.7%)
Business Search- 14 Million verified businesses
Males: 586
(39.6%)
Females: 892
(60.4%)
For population 25 years and over in 25537:
High school or higher: 92.4%
Bachelor's degree or higher: 16.4%
Graduate or professional degree: 5.7%
Mean travel time to work (commute): 27.9 minutes
For population 15 years and over in 25537:
Never married: 31.9%
Now married: 32.0%
Separated: 3.0%
Widowed: 4.1%
Divorced: 29.0%
Zip code 25537 compared to state average:
Unemployed percentage significantly below state average.
Black race population percentage significantly below state average.
Hispanic race population percentage significantly below state average.
Median age significantly above state average.
Foreign-born population percentage significantly below state average.
Renting percentage above state average.
Length of stay since moving in significantly above state average.
Estimated median house/condo value in 2022: $153,611
25537:
$153,611
West Virginia:
$155,100
According to our research of West Virginia and other state lists, there were 5 registered sex offenders living in 25537 zip code as of May 25, 2024. The ratio of all residents to sex offenders in zip code 25537 is 310 to 1. The ratio of registered sex offenders to all residents in this zip code is near the state average.
Median resident age:
This zip code:
51.8 years
West Virginia median age:
42.9 years
Average household size:
This zip code:
2.0 people
West Virginia:
2.3 people
Averages for the 2020 tax year for zip code 25537, filed in 2021:
Average Adjusted Gross Income (AGI) in 2020: $49,848 (Individual Income Tax Returns)
Here:
$49,848
State:
$56,292
Salary/wage: $47,140 (reported on 78.7% of returns)
Here:
$47,140
State:
$49,093
(% of AGI for various income ranges: 1204.6% for AGIs below $25k, 3328.0% for AGIs $25k-50k, 5655.6% for AGIs $50k-75k, 10230.0% for AGIs $75k-100k, 22076.7% for AGIs $100k-200k)
Taxable interest for individuals: $730 (reported on 22.5% of returns)
This zip code:
$730
West Virginia:
$1,141
(% of AGI for various income ranges: 12.5% for AGIs below $25k, 38.5% for AGIs $25k-50k, 17.8% for AGIs $50k-75k, 38.3% for AGIs $100k-200k)
Ordinary dividends: $1,100 (reported on 6.7% of returns)
Here:
$1,100
State:
$5,456
(% of AGI for various income ranges: 15.0% for AGIs $25k-50k, 60.0% for AGIs $100k-200k)
Net capital gain/loss in AGI: +$2,940 (reported on 5.6% of returns)
Here:
+$2,940
State:
+$11,656
(% of AGI for various income ranges: 16.2% for AGIs below $25k, 216.0% for AGIs $75k-100k)
Profit/loss from business: +$7,675 (reported on 9.0% of returns)
Here:
+$7,675
State:
+$12,084
(% of AGI for various income ranges: 43.3% for AGIs below $25k, 107.5% for AGIs $25k-50k, 590.0% for AGIs $75k-100k)
Taxable individual retirement arrangement distribution: $11,114 (reported on 7.9% of returns)
25537:
$11,114
West Virginia:
$15,311
(% of AGI for various income ranges: 130.4% for AGIs below $25k, 516.7% for AGIs $50k-75k)
Earned income credit: $2,133 (reported on 16.9% of returns)
Here:
$2,133
State:
$2,258
(% of AGI for various income ranges: 87.9% for AGIs below $25k, 54.5% for AGIs $25k-50k)
Percentage of individuals using paid preparers for their 2020 taxes: 97.8%
Here:
98%
State:
93%
(% for various income ranges: 97.1% for AGIs below $25k, 95.8% for AGIs $25k-50k, 100.0% for AGIs $50k-75k, 100.0% for AGIs $75k-100k, 100.0% for AGIs $100k-200k)
Averages for the 2012 tax year for zip code 25537, filed in 2013:
Average Adjusted Gross Income (AGI) in 2012: $40,128 (Individual Income Tax Returns)
Here:
$40,128
State:
$48,628
Salary/wage: $36,079 (reported on 83.3% of returns)
Here:
$36,079
State:
$42,328
(% of AGI for various income ranges: 70.4% for AGIs below $25k, 81.0% for AGIs $25k-50k, 81.3% for AGIs $50k-75k, 78.8% for AGIs $75k-100k, 63.7% for AGIs $100k-200k)
Taxable interest for individuals: $1,270 (reported on 24.0% of returns)
This zip code:
$1,270
West Virginia:
$1,211
(% of AGI for various income ranges: 1.3% for AGIs below $25k, 0.6% for AGIs $25k-50k, 0.1% for AGIs $50k-75k, 1.4% for AGIs $75k-100k, 0.6% for AGIs $100k-200k)
Ordinary dividends: $850 (reported on 8.3% of returns)
Here:
$850
State:
$4,262
Net capital gain/loss in AGI: +$1,671 (reported on 7.3% of returns)
Here:
+$1,671
State:
+$8,875
Profit/loss from business: +$6,811 (reported on 9.4% of returns)
Here:
+$6,811
State:
+$13,636
(% of AGI for various income ranges: 4.7% for AGIs below $25k, 2.2% for AGIs $25k-50k, 2.1% for AGIs $50k-75k)
Taxable individual retirement arrangement distribution: $7,371 (reported on 7.3% of returns)
25537:
$7,371
West Virginia:
$11,787
(% of AGI for various income ranges: 1.6% for AGIs below $25k, 2.4% for AGIs $25k-50k, 2.8% for AGIs $50k-75k)
Total itemized deductions: $16,908 (18% of AGI, reported on 13.5% of returns)
Here:
$16,908
State:
$21,148
Here:
18.3% of AGI
State:
18.1% of AGI
(% of AGI for various income ranges: 5.0% for AGIs below $25k, 4.1% for AGIs $50k-75k, 8.1% for AGIs $75k-100k, 11.0% for AGIs $100k-200k)
Charity contributions: $3,525 (reported on 8.3% of returns)
Here:
$3,525
State:
$4,508
(% of AGI for various income ranges: 0.9% for AGIs below $25k, 0.8% for AGIs $75k-100k, 1.8% for AGIs $100k-200k)
Taxes paid: $6,750 (reported on 12.5% of returns)
25537:
$6,750
State:
$8,103
(% of AGI for various income ranges: 1.0% for AGIs below $25k, 1.0% for AGIs $50k-75k, 2.5% for AGIs $75k-100k, 5.3% for AGIs $100k-200k)
Earned income credit: $2,096 (reported on 25.0% of returns)
Here:
$2,096
State:
$2,140
(% of AGI for various income ranges: 6.9% for AGIs below $25k, 1.4% for AGIs $25k-50k)
Percentage of individuals using paid preparers for their 2012 taxes: 64.6%
Here:
65%
State:
49%
(% for various income ranges: 62.2% for AGIs below $25k, 62.5% for AGIs $25k-50k, 69.2% for AGIs $50k-75k, 75.0% for AGIs $75k-100k, 66.7% for AGIs $100k-200k)
Averages for the 2004 tax year for zip code 25537, filed in 2005:
Average Adjusted Gross Income (AGI) in 2004: $32,491 (Individual Income Tax Returns)
Here:
$32,491
State:
$37,498
Salary/wage: $29,230 (reported on 86.9% of returns)
Here:
$29,230
State:
$33,645
(% of AGI for various income ranges: 86.3% for AGIs below $10k, 74.4% for AGIs $10k-25k, 87.9% for AGIs $25k-50k, 86.6% for AGIs $50k-75k, 74.8% for AGIs $75k-100k, 45.9% for AGIs over 100k)
Taxable interest for individuals: $1,788 (reported on 35.2% of returns)
This zip code:
$1,788
West Virginia:
$1,465
(% of AGI for various income ranges: 1.9% for AGIs below $10k, 3.3% for AGIs $10k-25k, 1.8% for AGIs $25k-50k, 1.3% for AGIs $50k-75k, 0.9% for AGIs $75k-100k, 2.7% for AGIs over 100k)
Taxable dividends: $409 (reported on 9.4% of returns)
Here:
$409
State:
$2,913
(% of AGI for various income ranges: 0.1% for AGIs $10k-25k, 0.2% for AGIs $25k-50k, 0.0% for AGIs $50k-75k, 0.1% for AGIs $75k-100k, 0.2% for AGIs over 100k)
Net capital gain/loss: +$4,677 (reported on 6.6% of returns)
Here:
+$4,677
State:
+$6,331
(% of AGI for various income ranges: 0.2% for AGIs $10k-25k, 0.6% for AGIs $25k-50k, 0.0% for AGIs $50k-75k, 5.4% for AGIs over 100k)
Profit/loss from business: +$3,640 (reported on 10.7% of returns)
Here:
+$3,640
State:
+$11,074
(% of AGI for various income ranges: 2.2% for AGIs below $10k, 5.6% for AGIs $10k-25k, 0.5% for AGIs $25k-50k, 0.3% for AGIs $50k-75k)
IRA payment deduction: $1,417 (reported on 1.3% of returns)
25537:
$1,417
West Virginia:
$2,796
Total itemized deductions: $14,891 (20% of AGI, reported on 12.7% of returns)
Here:
$14,891
State:
$16,976
Here:
20.4% of AGI
State:
19.0% of AGI
(% of AGI for various income ranges: 3.4% for AGIs $10k-25k, 4.8% for AGIs $25k-50k, 5.5% for AGIs $50k-75k, 8.5% for AGIs $75k-100k, 10.7% for AGIs over 100k)
Charity contributions deductions: $1,566 (2% of AGI, reported on 8.9% of returns)
Here:
$1,566
State:
$3,529
Here:
1.9% of AGI
State:
3.7% of AGI
(% of AGI for various income ranges: 0.4% for AGIs $25k-50k, 0.4% for AGIs $50k-75k, 0.9% for AGIs $75k-100k, 0.9% for AGIs over 100k)
Total tax: $3,879 (reported on 68.1% of returns)
25537:
$3,879
State:
$5,372
(% of AGI for various income ranges: 1.7% for AGIs below $10k, 3.9% for AGIs $10k-25k, 5.8% for AGIs $25k-50k, 8.2% for AGIs $50k-75k, 11.9% for AGIs $75k-100k, 16.8% for AGIs over 100k)
Earned income credit: $1,770 (reported on 21.8% of returns)
Here:
$1,770
State:
$1,662
Percentage of individuals using paid preparers for their 2004 taxes: 67.1%
Here:
67%
State:
55%
(% for various income ranges: 55.3% for AGIs below $10k, 70.0% for AGIs $10k-25k, 70.4% for AGIs $25k-50k, 65.5% for AGIs $50k-75k, 82.5% for AGIs $75k-100k, 70.8% for AGIs over 100k)
Household received Food Stamps/SNAP in the past 12 months: 46 Household did not receive Food Stamps/SNAP in the past 12 months: 680
Women who did not have a birth in the past 12 months: 337 (77 now married, 261 unmarried)
Housing units in zip code 25537 with a mortgage: 159 (43 second mortgage, 43 both second mortgage and home equity loan) Median monthly owner costs for units with a mortgage: $1,620 Median monthly owner costs for units without a mortgage: $306
Residents with income below the poverty level in 2022:
This zip code:
21.8%
Whole state:
17.9%
Residents with income below 50% of the poverty level in 2022:
This zip code:
13.8%
Whole state:
9.7%
Median number of rooms in houses and condos:
Here:
5.4
State:
6.5
Median number of rooms in apartments:
Here:
4.2
State:
4.7
Notable locations in this zip code not listed on our city pages
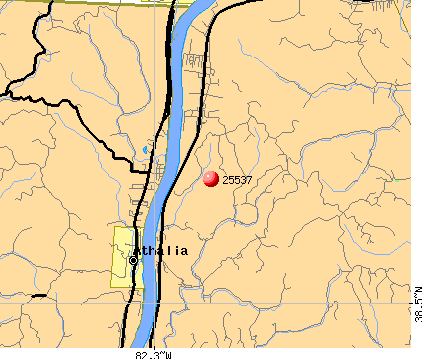
Notable locations in zip code 25537: Riveria Country Club Golf Course (A), Ohio River Road Volunteer Fire Department (B). Display/hide their locations on the map
Churches in zip code 25537 include: Warner Church (A), Vinson Chapel (B), Lower Green Bottom Church (C), Cremeans Chapel (D), Coxs Landing United Methodist Church (E). Display/hide their locations on the map
In group quarters: 18 (-1 institutionalized population)
Size of family households: 171 2-persons, 139 3-persons, 30 4-persons, 17 5-persons, 9 7-or-more-persons
Size of nonfamily households: 359 1-person, 10 2-persons
79 married couples with children.
67 single-parent households (67 women).
99.4% of residents of 25537 zip code speak English at home.
0.3% of residents speak other Indo-European language at home (100% very well).
Foreign born population: 0 (0.0%)
:
0.0%
Whole state:
1.8%
64%English
32%American
4%German
3%Italian
2%French
Year of entry for the foreign-born population
02010 or later
02000 to 2009
01990 to 1999
30Before 1990
Facilities with environmental interests located in this zip code:
COX LANDING ELEMENTARY (6358 COX LANE in LESAGE, WV)
(Geographic Names Information System) ENFORCEMENT/COMPLIANCE ACTIVITY (Integrated Compliance Information System) COMPLIANCE ACTIVITY (Tracking inspections of insecticide, fungicide, and rodenticide, and toxic substances) (National Center for Education Statistics) - STATE ID-12218 National Pollutant Discharge Elimination System NON-MAJOR (Tracking pollutant discharge elimination systems) - permit Business SIC classification: SEWERAGE SYSTEMS; ELEMENTARY AND SECONDARY SCHOOLS Organizations: CABELL CNTY BD OF ED (CONTACT/OWNER)
, CABELL COUNTY SCHOOL DISTRICT (SCHOOL DISTRICT)
Alternative names: CABELL CNTY BD OF ED
BIAS RIVERVIEW MANOR (RT 2 in LESAGE, WV)
National Pollutant Discharge Elimination System NON-MAJOR (Tracking pollutant discharge elimination systems) - permit Business SIC classification: OPERATORS OF RESIDENTIAL MOBILE HOME SITES Alternative names: RIVERVIEW MANOR NEIGHBORHOOD A, W SCOTT BIAS
ECO-FIRST INC (3 HARVEST VIEW DR in LESAGE, WV)
TRANSPORTER (Resource Conservation and Recovery Act (tracking hazardous waste)) USED OIL PROGRAM (Resource Conservation and Recovery Act (tracking hazardous waste))
ADAMS TRUCKING & SUPPLY INC (6600 OHIO RIVER RD in LESAGE, WV)
Conditionally Exempt Small Quantity Generators, less than 100 kg/month of hazardous waste (Resource Conservation and Recovery Act (tracking hazardous waste)) Organizations: PAUL ADAMS (CONTACT/OWNER)
Housing units lacking complete plumbing facilities: 8.5% Housing units lacking complete kitchen facilities: 4.1%
65.4%Electricity
26.3%Utility gas
6.2%Wood
2.2%Bottled, tank, or LP gas
Population in 1990: 2,972.
Place of birth for U.S.-born residents:
This state: 1,199
Northeast: 63
Midwest: 55
South: 108
West: 2
64% of the 25537 zip code residents lived in the same house 5 years ago. Out of people who lived in different houses, 66% lived in this county. Out of people who lived in different counties, 50% lived in West Virginia.
75% of the 25537 zip code residents lived in the same house 1 year ago. Out of people who lived in different houses, 40% moved from this county. Out of people who lived in different houses, 54% moved from different county within same state. Out of people who lived in different houses, 2% moved from different state.
Private vs. public school enrollment:
Students in private schools in grades 1 to 8 (elementary and middle school):
Here:
0.0%
West Virginia:
12.2%
Students in private undergraduate colleges: 6
Here:
5.7%
West Virginia:
17.3%
Occupation by median earnings in the past 12 months ($)
77,093Production occupations
55,720Health diagnosing and treating practitioners and other technical occupations
28,032Office and administrative support occupations
18,571Sales and related occupations
15,300Building and grounds cleaning and maintenance occupations
2,525Healthcare support occupations
Top industries in this zip code by the number of employees in 2005:
Health Care and Social Assistance: Residential Mental Retardation Facilities (100-249 employees: 1 establishment)
Accommodation and Food Services: Limited-Service Restaurants (20-49: 1, 1-4: 1)
Wholesale Trade: Paint, Varnish, and Supplies Merchant Wholesalers (20-49: 1)
Wholesale Trade: Service Establishment Equipment and Supplies Merchant Wholesalers (20-49: 1)
Arts, Entertainment, and Recreation: Golf Courses and Country Clubs (10-19: 1)
Wholesale Trade: Industrial Machinery and Equipment Merchant Wholesalers (5-9: 1)
Accommodation and Food Services: Snack and Nonalcoholic Beverage Bars (5-9: 1)
People in group quarters in 2010:
14 people in group homes intended for adults
People in group quarters in 2000:
35 people in schools, hospitals, or wards for the intellectually disabled
4 people in other noninstitutional group quarters
Fatal accident statistics in 2014:
Fatal accident count: 1
Vehicles involved in fatal accidents: 2
Fatal accidents caused by drunken drivers: 0
Fatalities: 1
Persons involved in fatal accidents: 3
Pedestrians involved in fatal accidents: 0
Fatal accident statistics in 2013:
Fatal accident count: 1
Vehicles involved in fatal accidents: 2
Fatal accidents caused by drunken drivers: 1
Fatalities: 1
Persons involved in fatal accidents: 3
Pedestrians involved in fatal accidents: 0
Home Mortgage Disclosure Act Aggregated Statistics For Year 2009 (Based on 2 partial tracts)
A) FHA, FSA/RHS & VA Home Purchase Loans
B) Conventional Home Purchase Loans
C) Refinancings
D) Home Improvement Loans
F) Non-occupant Loans on < 5 Family Dwellings (A B C & D)
G) Loans On Manufactured Home Dwelling (A B C & D)
Number
Average Value
Number
Average Value
Number
Average Value
Number
Average Value
Number
Average Value
Number
Average Value
LOANS ORIGINATED
10
$140,688
20
$139,451
59
$148,736
10
$57,396
4
$120,772
6
$61,248
APPLICATIONS APPROVED, NOT ACCEPTED
0
$0
1
$98,940
2
$86,575
2
$39,120
0
$0
2
$26,755
APPLICATIONS DENIED
5
$81,474
7
$125,479
26
$153,498
4
$45,938
2
$174,155
4
$41,520
APPLICATIONS WITHDRAWN
2
$125,445
2
$101,715
11
$157,452
1
$63,100
1
$55,020
1
$22,210
FILES CLOSED FOR INCOMPLETENESS
0
$0
2
$39,625
6
$136,717
1
$12,620
0
$0
2
$69,915
Aggregated Statistics For Year 2008 (Based on 2 partial tracts)
A) FHA, FSA/RHS & VA Home Purchase Loans
B) Conventional Home Purchase Loans
C) Refinancings
D) Home Improvement Loans
E) Loans on Dwellings For 5+ Families
F) Non-occupant Loans on < 5 Family Dwellings (A B C & D)
G) Loans On Manufactured Home Dwelling (A B C & D)
Number
Average Value
Number
Average Value
Number
Average Value
Number
Average Value
Number
Average Value
Number
Average Value
Number
Average Value
LOANS ORIGINATED
10
$132,762
26
$142,761
42
$123,123
15
$48,629
1
$75,720
3
$70,337
4
$67,895
APPLICATIONS APPROVED, NOT ACCEPTED
0
$0
4
$81,652
2
$117,620
2
$53,760
0
$0
1
$28,770
2
$53,005
APPLICATIONS DENIED
2
$102,220
10
$75,114
30
$106,042
10
$48,309
0
$0
2
$55,530
10
$52,196
APPLICATIONS WITHDRAWN
1
$107,020
5
$91,470
13
$140,528
1
$25,240
0
$0
1
$68,150
2
$73,700
FILES CLOSED FOR INCOMPLETENESS
0
$0
1
$46,440
1
$64,610
1
$50,480
0
$0
0
$0
0
$0
Aggregated Statistics For Year 2007 (Based on 2 partial tracts)
A) FHA, FSA/RHS & VA Home Purchase Loans
B) Conventional Home Purchase Loans
C) Refinancings
D) Home Improvement Loans
F) Non-occupant Loans on < 5 Family Dwellings (A B C & D)
G) Loans On Manufactured Home Dwelling (A B C & D)
Number
Average Value
Number
Average Value
Number
Average Value
Number
Average Value
Number
Average Value
Number
Average Value
LOANS ORIGINATED
2
$128,470
45
$146,056
41
$99,433
14
$57,114
7
$81,344
4
$39,122
APPLICATIONS APPROVED, NOT ACCEPTED
1
$32,810
3
$127,713
9
$75,047
4
$58,935
1
$22,720
2
$31,800
APPLICATIONS DENIED
1
$51,990
10
$86,826
30
$102,912
6
$36,008
3
$45,097
8
$54,266
APPLICATIONS WITHDRAWN
2
$82,785
6
$108,448
5
$110,350
1
$180,210
1
$40,380
3
$27,090
FILES CLOSED FOR INCOMPLETENESS
0
$0
1
$25,240
3
$154,637
0
$0
1
$78,240
0
$0
Aggregated Statistics For Year 2006 (Based on 2 partial tracts)
A) FHA, FSA/RHS & VA Home Purchase Loans
B) Conventional Home Purchase Loans
C) Refinancings
D) Home Improvement Loans
F) Non-occupant Loans on < 5 Family Dwellings (A B C & D)
G) Loans On Manufactured Home Dwelling (A B C & D)
Number
Average Value
Number
Average Value
Number
Average Value
Number
Average Value
Number
Average Value
Number
Average Value
LOANS ORIGINATED
4
$88,845
46
$115,007
36
$86,896
15
$32,845
11
$106,100
7
$58,990
APPLICATIONS APPROVED, NOT ACCEPTED
0
$0
7
$98,941
7
$80,551
3
$24,400
1
$37,860
3
$68,653
APPLICATIONS DENIED
2
$52,245
12
$53,845
28
$101,104
13
$41,277
3
$57,883
12
$46,147
APPLICATIONS WITHDRAWN
1
$53,000
5
$95,610
9
$107,410
2
$143,110
0
$0
3
$51,490
FILES CLOSED FOR INCOMPLETENESS
0
$0
1
$112,570
5
$114,792
0
$0
0
$0
0
$0
Aggregated Statistics For Year 2005 (Based on 2 partial tracts)
A) FHA, FSA/RHS & VA Home Purchase Loans
B) Conventional Home Purchase Loans
C) Refinancings
D) Home Improvement Loans
F) Non-occupant Loans on < 5 Family Dwellings (A B C & D)
G) Loans On Manufactured Home Dwelling (A B C & D)
Number
Average Value
Number
Average Value
Number
Average Value
Number
Average Value
Number
Average Value
Number
Average Value
LOANS ORIGINATED
2
$180,720
44
$109,737
58
$100,212
16
$24,704
5
$55,326
13
$44,772
APPLICATIONS APPROVED, NOT ACCEPTED
1
$17,670
7
$100,456
6
$97,090
3
$15,650
0
$0
5
$56,436
APPLICATIONS DENIED
2
$88,090
18
$66,129
28
$95,479
7
$15,504
3
$36,010
16
$53,824
APPLICATIONS WITHDRAWN
0
$0
2
$95,155
14
$103,087
2
$129,230
0
$0
2
$44,675
FILES CLOSED FOR INCOMPLETENESS
0
$0
1
$15,650
2
$83,290
0
$0
1
$15,650
1
$40,380
Aggregated Statistics For Year 2004 (Based on 2 partial tracts)
A) FHA, FSA/RHS & VA Home Purchase Loans
B) Conventional Home Purchase Loans
C) Refinancings
D) Home Improvement Loans
E) Loans on Dwellings For 5+ Families
F) Non-occupant Loans on < 5 Family Dwellings (A B C & D)
G) Loans On Manufactured Home Dwelling (A B C & D)
Number
Average Value
Number
Average Value
Number
Average Value
Number
Average Value
Number
Average Value
Number
Average Value
Number
Average Value
LOANS ORIGINATED
2
$133,265
38
$109,090
71
$92,641
12
$35,126
1
$69,660
2
$57,545
13
$42,209
APPLICATIONS APPROVED, NOT ACCEPTED
1
$64,610
5
$74,610
13
$94,320
6
$21,622
0
$0
1
$32,310
6
$44,170
APPLICATIONS DENIED
2
$42,150
22
$59,910
37
$94,971
13
$29,938
0
$0
4
$40,132
19
$43,067
APPLICATIONS WITHDRAWN
1
$45,940
3
$53,340
10
$119,940
1
$55,020
0
$0
1
$69,160
1
$45,940
FILES CLOSED FOR INCOMPLETENESS
0
$0
1
$59,060
2
$101,970
0
$0
0
$0
0
$0
1
$43,410
Aggregated Statistics For Year 2003 (Based on 2 partial tracts)
A) FHA, FSA/RHS & VA Home Purchase Loans
B) Conventional Home Purchase Loans
C) Refinancings
D) Home Improvement Loans
E) Loans on Dwellings For 5+ Families
F) Non-occupant Loans on < 5 Family Dwellings (A B C & D)
Number
Average Value
Number
Average Value
Number
Average Value
Number
Average Value
Number
Average Value
Number
Average Value
LOANS ORIGINATED
2
$52,245
40
$105,869
76
$97,646
14
$20,228
1
$83,290
4
$62,595
APPLICATIONS APPROVED, NOT ACCEPTED
0
$0
6
$34,073
13
$81,156
3
$32,140
0
$0
2
$34,325
APPLICATIONS DENIED
1
$37,360
16
$63,258
29
$67,243
9
$24,960
0
$0
3
$42,233
APPLICATIONS WITHDRAWN
0
$0
3
$82,113
13
$90,126
0
$0
0
$0
0
$0
FILES CLOSED FOR INCOMPLETENESS
1
$30,790
1
$38,360
3
$104,157
1
$7,570
0
$0
0
$0
Aggregated Statistics For Year 2002 (Based on 2 partial tracts)
A) FHA, FSA/RHS & VA Home Purchase Loans
B) Conventional Home Purchase Loans
C) Refinancings
D) Home Improvement Loans
F) Non-occupant Loans on < 5 Family Dwellings (A B C & D)
Number
Average Value
Number
Average Value
Number
Average Value
Number
Average Value
Number
Average Value
LOANS ORIGINATED
4
$72,188
29
$92,657
60
$94,364
13
$17,047
1
$58,050
APPLICATIONS APPROVED, NOT ACCEPTED
1
$31,300
6
$75,552
4
$53,888
3
$8,413
0
$0
APPLICATIONS DENIED
1
$53,510
18
$54,574
26
$75,157
8
$7,761
3
$71,513
APPLICATIONS WITHDRAWN
0
$0
3
$84,133
13
$146,780
2
$7,570
1
$65,620
FILES CLOSED FOR INCOMPLETENESS
1
$76,220
1
$76,730
3
$110,213
1
$1,510
0
$0
Aggregated Statistics For Year 2001 (Based on 2 partial tracts)
A) FHA, FSA/RHS & VA Home Purchase Loans
B) Conventional Home Purchase Loans
C) Refinancings
D) Home Improvement Loans
F) Non-occupant Loans on < 5 Family Dwellings (A B C & D)
Number
Average Value
Number
Average Value
Number
Average Value
Number
Average Value
Number
Average Value
LOANS ORIGINATED
5
$94,094
29
$87,539
63
$84,494
8
$15,649
3
$47,620
APPLICATIONS APPROVED, NOT ACCEPTED
1
$100,960
11
$57,547
7
$53,581
0
$0
1
$52,500
APPLICATIONS DENIED
1
$56,540
11
$40,246
27
$67,419
5
$12,520
0
$0
APPLICATIONS WITHDRAWN
0
$0
2
$87,585
12
$68,821
3
$7,067
1
$53,510
FILES CLOSED FOR INCOMPLETENESS
0
$0
1
$39,880
6
$65,287
0
$0
0
$0
Aggregated Statistics For Year 2000 (Based on 2 partial tracts)
A) FHA, FSA/RHS & VA Home Purchase Loans
B) Conventional Home Purchase Loans
C) Refinancings
D) Home Improvement Loans
F) Non-occupant Loans on < 5 Family Dwellings (A B C & D)
Number
Average Value
Number
Average Value
Number
Average Value
Number
Average Value
Number
Average Value
LOANS ORIGINATED
4
$86,320
31
$85,832
31
$64,891
4
$10,348
6
$39,122
APPLICATIONS APPROVED, NOT ACCEPTED
4
$36,978
10
$48,461
7
$38,220
1
$5,550
0
$0
APPLICATIONS DENIED
2
$53,510
24
$43,770
19
$59,274
3
$11,610
2
$18,175
APPLICATIONS WITHDRAWN
2
$53,255
2
$69,410
7
$51,346
2
$23,980
1
$18,170
FILES CLOSED FOR INCOMPLETENESS
0
$0
0
$0
2
$59,565
1
$50,480
0
$0
Aggregated Statistics For Year 1999 (Based on 1 partial tract)
A) FHA, FSA/RHS & VA Home Purchase Loans
B) Conventional Home Purchase Loans
C) Refinancings
D) Home Improvement Loans
F) Non-occupant Loans on < 5 Family Dwellings (A B C & D)
Detailed PMIC statistics for the following Tracts:0107.00
2003 - 2018 National Fire Incident Reporting System (NFIRS) incidents
Based on the data from the years 2003 - 2018 the average number of fires per year is 18. The highest number of fire incidents - 28 took place in 2014, and the least - 2 in 2003. The data has a rising trend.
When looking into fire subcategories, the most reports belonged to: Structure Fires (48.3%), and Outside Fires (31.3%).
Fire incident types reported to NFIRS in Zip Code 25537


 Nearest zip codes: 45669, 25545, 25520, 25702, 45623, 45678.


 Based on the data from the years 2003 - 2018 the average number of fires per year is 18. The highest number of fire incidents - 28 took place in 2014, and the least - 2 in 2003. The data has a rising trend.
 When looking into fire subcategories, the most reports belonged to: Structure Fires (48.3%), and Outside Fires (31.3%).