Estimated zip code population in 2022: 1,005 Zip code population in 2010: 1,467 Zip code population in 2000: 1,525
Houses and condos: 779 Renter-occupied apartments: 142
% of renters here:
28%
State:
33%
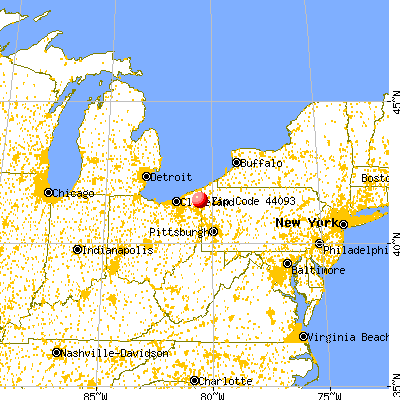
March 2022 cost of living index in zip code 44093: 83.8 (less than average, U.S. average is 100)
Land area: 32.2 sq. mi. Water area: 0.1 sq. mi.
Population density: 31 people per square mile
(very low).
OSM Map
General Map
Google Map
MSN Map
OSM Map
General Map
Google Map
MSN Map
OSM Map
General Map
Google Map
MSN Map
OSM Map
General Map
Google Map
MSN Map
Please wait while loading the map...
Real estate property taxes paid for housing units in 2022:
This zip code:
0.6% ($1,314)
Ohio:
1.3% ($2,639)
Median real estate property taxes paid for housing units with mortgages in 2022: $1,490 (0.6%) Median real estate property taxes paid for housing units with no mortgage in 2022: $1,238 (0.7%)
Business Search- 14 Million verified businesses
Males: 502
(50.0%)
Females: 502
(50.0%)
For population 25 years and over in 44093:
High school or higher: 83.4%
Bachelor's degree or higher: 13.6%
Graduate or professional degree: 7.7%
Unemployed: 8.0%
Mean travel time to work (commute): 27.4 minutes
For population 15 years and over in 44093:
Never married: 25.3%
Now married: 50.6%
Separated: 0.7%
Widowed: 12.6%
Divorced: 10.8%
Zip code 44093 compared to state average:
Unemployed percentage above state average.
Black race population percentage significantly below state average.
Hispanic race population percentage significantly below state average.
Foreign-born population percentage below state average.
Length of stay since moving in significantly above state average.
Number of college students significantly below state average.
Percentage of population with a bachelor's degree or higher below state average.
Averages for the 2020 tax year for zip code 44093, filed in 2021:
Average Adjusted Gross Income (AGI) in 2020: $44,392 (Individual Income Tax Returns)
Here:
$44,392
State:
$67,288
Salary/wage: $39,502 (reported on 75.4% of returns)
Here:
$39,502
State:
$55,628
(% of AGI for various income ranges: 1152.4% for AGIs below $25k, 3221.5% for AGIs $25k-50k, 7380.0% for AGIs $50k-75k, 8387.5% for AGIs $75k-100k, 21205.0% for AGIs $100k-200k)
Taxable interest for individuals: $867 (reported on 19.7% of returns)
This zip code:
$867
Ohio:
$1,518
(% of AGI for various income ranges: 10.0% for AGIs below $25k, 3.1% for AGIs $25k-50k, 56.7% for AGIs $50k-75k, 12.5% for AGIs $75k-100k, 220.0% for AGIs $100k-200k)
Ordinary dividends: $2,100 (reported on 13.1% of returns)
Here:
$2,100
State:
$7,167
(% of AGI for various income ranges: 73.8% for AGIs $25k-50k, 180.0% for AGIs $75k-100k)
Net capital gain/loss in AGI: +$1,967 (reported on 9.8% of returns)
Here:
+$1,967
State:
+$18,919
(% of AGI for various income ranges: 15.3% for AGIs below $25k, 153.3% for AGIs $50k-75k)
Profit/loss from business: +$13,400 (reported on 19.7% of returns)
Here:
+$13,400
State:
+$13,744
(% of AGI for various income ranges: 208.2% for AGIs below $25k, 270.8% for AGIs $25k-50k, 1503.3% for AGIs $50k-75k)
Taxable individual retirement arrangement distribution: $10,680 (reported on 8.2% of returns)
44093:
$10,680
Ohio:
$18,876
(% of AGI for various income ranges: 108.2% for AGIs below $25k, 583.3% for AGIs $50k-75k)
Earned income credit: $2,227 (reported on 18.0% of returns)
Here:
$2,227
State:
$2,304
(% of AGI for various income ranges: 83.5% for AGIs below $25k, 79.2% for AGIs $25k-50k)
Percentage of individuals using paid preparers for their 2020 taxes: 93.4%
Here:
93%
State:
94%
(% for various income ranges: 95.7% for AGIs below $25k, 100.0% for AGIs $25k-50k, 90.9% for AGIs $50k-75k, 83.3% for AGIs $75k-100k, 80.0% for AGIs $100k-200k)
Averages for the 2012 tax year for zip code 44093, filed in 2013:
Average Adjusted Gross Income (AGI) in 2012: $37,477 (Individual Income Tax Returns)
Here:
$37,477
State:
$54,926
Salary/wage: $33,110 (reported on 78.7% of returns)
Here:
$33,110
State:
$45,869
(% of AGI for various income ranges: 70.2% for AGIs below $25k, 76.7% for AGIs $25k-50k, 77.0% for AGIs $50k-75k, 76.7% for AGIs $75k-100k, 43.4% for AGIs $100k-200k)
Taxable interest for individuals: $529 (reported on 23.0% of returns)
This zip code:
$529
Ohio:
$1,297
(% of AGI for various income ranges: 0.6% for AGIs below $25k, 0.4% for AGIs $25k-50k, 0.3% for AGIs $50k-75k, 0.4% for AGIs $75k-100k)
Ordinary dividends: $1,978 (reported on 14.8% of returns)
Here:
$1,978
State:
$5,821
(% of AGI for various income ranges: 2.0% for AGIs below $25k, 2.1% for AGIs $50k-75k)
Net capital gain/loss in AGI: +$1,875 (reported on 6.6% of returns)
Here:
+$1,875
State:
+$11,232
(% of AGI for various income ranges: 1.2% for AGIs $25k-50k)
Profit/loss from business: +$6,211 (reported on 14.8% of returns)
Here:
+$6,211
State:
+$12,773
(% of AGI for various income ranges: 5.0% for AGIs below $25k, 6.2% for AGIs $25k-50k)
Taxable individual retirement arrangement distribution: $4,300 (reported on 8.2% of returns)
44093:
$4,300
Ohio:
$14,511
(% of AGI for various income ranges: 3.6% for AGIs $25k-50k)
Total itemized deductions: $16,022 (19% of AGI, reported on 14.8% of returns)
Here:
$16,022
State:
$21,278
Here:
18.7% of AGI
State:
18.8% of AGI
(% of AGI for various income ranges: 5.2% for AGIs $25k-50k, 8.9% for AGIs $50k-75k, 17.9% for AGIs $75k-100k)
Charity contributions: $3,117 (reported on 9.8% of returns)
Here:
$3,117
State:
$3,943
(% of AGI for various income ranges: 1.4% for AGIs $25k-50k, 2.7% for AGIs $75k-100k)
Taxes paid: $5,100 (reported on 16.4% of returns)
44093:
$5,100
State:
$9,568
(% of AGI for various income ranges: 1.4% for AGIs $25k-50k, 2.3% for AGIs $50k-75k, 8.1% for AGIs $75k-100k)
Earned income credit: $2,670 (reported on 16.4% of returns)
Here:
$2,670
State:
$2,285
(% of AGI for various income ranges: 5.1% for AGIs below $25k, 1.3% for AGIs $25k-50k)
Percentage of individuals using paid preparers for their 2012 taxes: 55.7%
Here:
56%
State:
51%
(% for various income ranges: 50.0% for AGIs below $25k, 58.8% for AGIs $25k-50k, 62.5% for AGIs $50k-75k, 100.0% for AGIs $75k-100k, 0.0% for AGIs $100k-200k)
Averages for the 2004 tax year for zip code 44093, filed in 2005:
Average Adjusted Gross Income (AGI) in 2004: $31,140 (Individual Income Tax Returns)
Here:
$31,140
State:
$44,480
Salary/wage: $30,109 (reported on 84.1% of returns)
Here:
$30,109
State:
$39,198
(% of AGI for various income ranges: 116.8% for AGIs below $10k, 68.6% for AGIs $10k-25k, 86.5% for AGIs $25k-50k, 84.3% for AGIs $50k-75k, 89.4% for AGIs $75k-100k, 58.2% for AGIs over 100k)
Taxable interest for individuals: $802 (reported on 40.2% of returns)
This zip code:
$802
Ohio:
$1,532
(% of AGI for various income ranges: 2.7% for AGIs below $10k, 2.5% for AGIs $10k-25k, 1.2% for AGIs $25k-50k, 0.3% for AGIs $50k-75k, 0.4% for AGIs $75k-100k, 0.1% for AGIs over 100k)
Taxable dividends: $1,192 (reported on 18.7% of returns)
Here:
$1,192
State:
$3,496
(% of AGI for various income ranges: 3.3% for AGIs below $10k, 1.3% for AGIs $10k-25k, 0.8% for AGIs $25k-50k, 0.4% for AGIs $50k-75k, 0.3% for AGIs $75k-100k)
Net capital gain/loss: +$831 (reported on 10.1% of returns)
Here:
+$831
State:
+$8,582
Profit/loss from business: +$5,543 (reported on 14.3% of returns)
Here:
+$5,543
State:
+$10,813
(% of AGI for various income ranges: 1.4% for AGIs below $10k, 8.2% for AGIs $10k-25k, 2.2% for AGIs $25k-50k, 1.6% for AGIs $50k-75k)
IRA payment deduction: $2,273 (reported on 1.7% of returns)
44093:
$2,273
Ohio:
$2,794
Total itemized deductions: $13,008 (24% of AGI, reported on 19.6% of returns)
Here:
$13,008
State:
$17,503
Here:
24.3% of AGI
State:
20.8% of AGI
(% of AGI for various income ranges: 7.0% for AGIs $10k-25k, 6.9% for AGIs $25k-50k, 9.8% for AGIs $50k-75k, 10.6% for AGIs $75k-100k, 10.9% for AGIs over 100k)
Charity contributions deductions: $2,068 (4% of AGI, reported on 13.7% of returns)
Here:
$2,068
State:
$3,087
Here:
3.6% of AGI
State:
3.4% of AGI
(% of AGI for various income ranges: 3.3% for AGIs below $10k, 0.6% for AGIs $25k-50k, 1.3% for AGIs $50k-75k, 0.7% for AGIs $75k-100k, 1.9% for AGIs over 100k)
Total tax: $3,224 (reported on 71.7% of returns)
44093:
$3,224
State:
$6,781
(% of AGI for various income ranges: 3.1% for AGIs below $10k, 3.7% for AGIs $10k-25k, 6.3% for AGIs $25k-50k, 8.0% for AGIs $50k-75k, 10.6% for AGIs $75k-100k, 14.2% for AGIs over 100k)
Earned income credit: $1,726 (reported on 16.5% of returns)
Here:
$1,726
State:
$1,696
Percentage of individuals using paid preparers for their 2004 taxes: 60.4%
Here:
60%
State:
55%
(% for various income ranges: 48.9% for AGIs below $10k, 66.7% for AGIs $10k-25k, 59.8% for AGIs $25k-50k, 66.2% for AGIs $50k-75k, 104.3% for AGIs $75k-100k)
Notable locations in zip code 44093: Golden Ridge Farm (A), Pilgrim Goose Hatchery (B), Ri Valley Farm (C), Topside Farms (D), Windhorse Farm (E). Display/hide their locations on the map
Size of family households: 125 2-persons, 77 3-persons, 29 4-persons, 11 5-persons, 11 6-persons
Size of nonfamily households: 218 1-person, 30 2-persons
85 married couples with children.
5 single-parent households (5 women).
97.9% of residents of 44093 zip code speak English at home.
1.7% of residents speak Asian or Pacific Island language at home (100% very well).
Foreign born population: 24 (2.4%) (29.5% of them are naturalized citizens)
This zip code:
2.4%
Whole state:
5.0%
75%Japan
21%Germany
37%American
18%German
8%English
3%Slavic
3%Hungarian
2%Irish
2%Italian
Year of entry for the foreign-born population
02010 or later
162000 to 2009
01990 to 1999
6Before 1990
Housing units lacking complete plumbing facilities: 13.3% Housing units lacking complete kitchen facilities: 5.8%
27.5%Utility gas
24.0%Fuel oil, kerosene, etc.
12.8%Bottled, tank, or LP gas
12.8%Wood
11.0%Coal or coke
8.8%Electricity
1.8%No fuel used
1.6%Solar energy
Population in 1990: 1,817.
Place of birth for U.S.-born residents:
This state: 453
Northeast: 354
South: 122
West: 54
67% of the 44093 zip code residents lived in the same house 5 years ago. Out of people who lived in different houses, 49% lived in this county. Out of people who lived in different counties, 50% lived in Ohio.
89% of the 44093 zip code residents lived in the same house 1 year ago. Out of people who lived in different houses, 48% moved from this county. Out of people who lived in different houses, 50% moved from different county within same state.
Private vs. public school enrollment:
Students in private schools in grades 1 to 8 (elementary and middle school):
Here:
0.0%
Ohio:
16.0%
Students in private schools in grades 9 to 12 (high school): 11
Here:
22.1%
Ohio:
13.1%
Occupation by median earnings in the past 12 months ($)
82,553Installation, maintenance, and repair occupations
61,866Production occupations
46,189Construction and extraction occupations
33,279Healthcare support occupations
17,004Building and grounds cleaning and maintenance occupations
Companies with federal contracts located in this zip code:
UNDERWATER SERVICES OF OHIO IN (7274 TESSMER RD in WILLIAMSFIELD, OH)
-$1,420 with Army for Other Professional Services. Taking place in NY. Signed on 2005-03-21. Completion date: 2004-01-06.
Top industries in this zip code by the number of employees in 2005:
Health Care and Social Assistance: Offices of Physical, Occupational and Speech Therapists, and Audiologists (10-19 employees: 1 establishment)
Finance and Insurance: Commercial Banking (5-9: 1)
Professional, Scientific, and Technical Services: All Other Professional, Scientific, and Technical Services (5-9: 1)
Construction: Painting and Wall Covering Contractors (1-4: 1)
Other Services (except Public Administration): Religious Organizations (1-4: 1)
Mining: Construction Sand and Gravel Mining (1-4: 1)
Other Services (except Public Administration): General Automotive Repair (1-4: 1)
Fatal accident statistics in 2014:
Fatal accident count: 1
Vehicles involved in fatal accidents: 1
Fatal accidents caused by drunken drivers: 1
Fatalities: 1
Persons involved in fatal accidents: 1
Pedestrians involved in fatal accidents: 0
Fatal accident statistics in 2010:
Fatal accident count: 1
Vehicles involved in fatal accidents: 2
Fatal accidents caused by drunken drivers: 0
Fatalities: 1
Persons involved in fatal accidents: 3
Pedestrians involved in fatal accidents: 0
Home Mortgage Disclosure Act Aggregated Statistics For Year 2003 (Based on 2 partial tracts)
A) FHA, FSA/RHS & VA Home Purchase Loans
B) Conventional Home Purchase Loans
C) Refinancings
D) Home Improvement Loans
F) Non-occupant Loans on < 5 Family Dwellings (A B C & D)
Number
Average Value
Number
Average Value
Number
Average Value
Number
Average Value
Number
Average Value
LOANS ORIGINATED
7
$99,994
47
$85,066
133
$81,983
18
$19,651
16
$65,031
APPLICATIONS APPROVED, NOT ACCEPTED
0
$0
7
$52,603
20
$86,716
2
$15,380
4
$36,360
APPLICATIONS DENIED
1
$93,590
20
$62,944
62
$82,876
12
$24,094
4
$92,602
APPLICATIONS WITHDRAWN
1
$148,960
9
$77,188
31
$94,159
1
$22,850
0
$0
FILES CLOSED FOR INCOMPLETENESS
1
$76,020
1
$129,620
6
$82,387
0
$0
0
$0
Aggregated Statistics For Year 1999 (Based on 1 partial tract)
A) FHA, FSA/RHS & VA Home Purchase Loans
B) Conventional Home Purchase Loans
C) Refinancings
D) Home Improvement Loans
F) Non-occupant Loans on < 5 Family Dwellings (A B C & D)
Detailed PMIC statistics for the following Tracts:0013.00
2002 - 2018 National Fire Incident Reporting System (NFIRS) incidents
According to the data from the years 2002 - 2018 the average number of fires per year is 21. The highest number of reported fire incidents - 40 took place in 2016, and the least - 4 in 2004. The data has a growing trend.
When looking into fire subcategories, the most reports belonged to: Structure Fires (56.2%), and Outside Fires (35.2%).
Fire incident types reported to NFIRS in Zip Code 44093


 Nearest zip codes: 44003, 44428, 44417, 16134, 44032, 44076.


 According to the data from the years 2002 - 2018 the average number of fires per year is 21. The highest number of reported fire incidents - 40 took place in 2016, and the least - 4 in 2004. The data has a growing trend.
 When looking into fire subcategories, the most reports belonged to: Structure Fires (56.2%), and Outside Fires (35.2%).