Estimated zip code population in 2022: 1,543 Zip code population in 2010: 1,557 Zip code population in 2000: 1,494
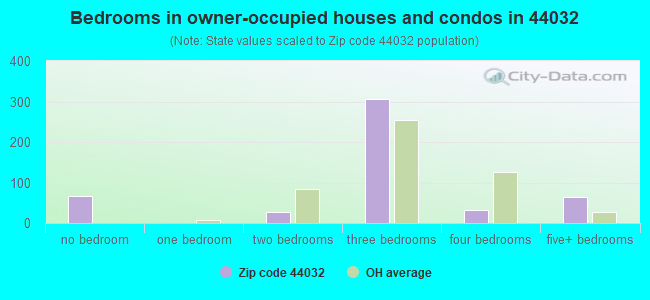
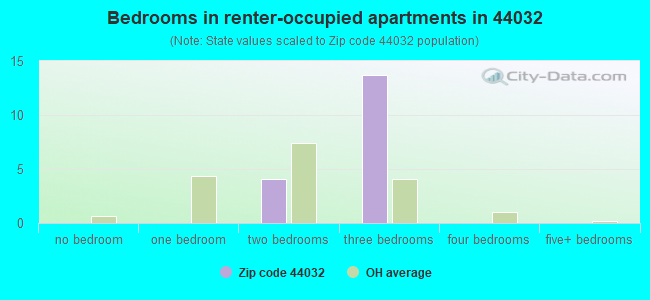
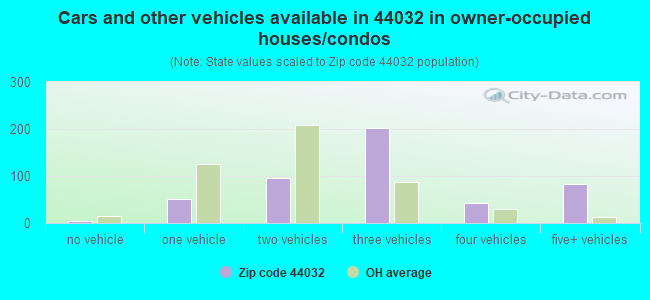
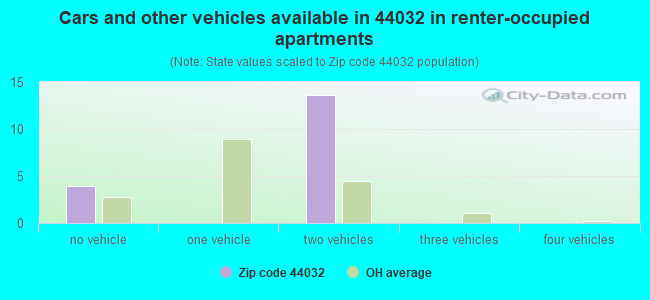
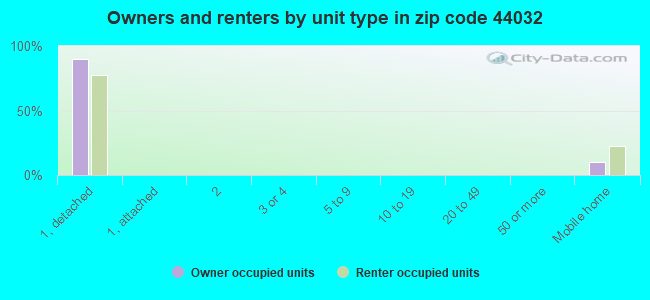
Houses and condos: 534 Renter-occupied apartments: 18
% of renters here:
4%
State:
33%
March 2022 cost of living index in zip code 44032: 82.5 (low, U.S. average is 100)
Land area: 40.2 sq. mi. Water area: 0.0 sq. mi.
Population density: 38 people per square mile
(very low).
OSM Map
General Map
Google Map
MSN Map
OSM Map
General Map
Google Map
MSN Map
OSM Map
General Map
Google Map
MSN Map
OSM Map
General Map
Google Map
MSN Map
Please wait while loading the map...
Real estate property taxes paid for housing units in 2022:
This zip code:
1.1% ($2,005)
Ohio:
1.3% ($2,639)
Median real estate property taxes paid for housing units with mortgages in 2022: $3,199 (0.9%) Median real estate property taxes paid for housing units with no mortgage in 2022: $1,033 (0.7%)
Business Search- 14 Million verified businesses
Males: 930
(60.3%)
Females: 613
(39.7%)
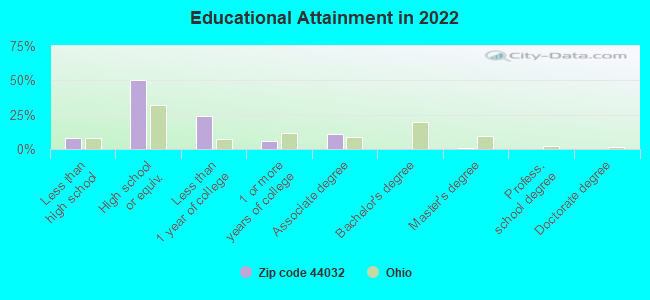
For population 25 years and over in 44032:
High school or higher: 90.6%
Bachelor's degree or higher: 1.2%
Graduate or professional degree: 1.2%
Unemployed: 1.4%
Mean travel time to work (commute): 25.5 minutes
For population 15 years and over in 44032:
Never married: 28.8%
Now married: 47.7%
Separated: 0.3%
Widowed: 7.4%
Divorced: 15.8%
Zip code 44032 compared to state average:
Unemployed percentage below state average.
Black race population percentage significantly below state average.
Hispanic race population percentage significantly below state average.
Foreign-born population percentage significantly below state average.
Renting percentage significantly below state average.
Length of stay since moving in significantly above state average.
Number of college students significantly below state average.
Percentage of population with a bachelor's degree or higher significantly below state average.
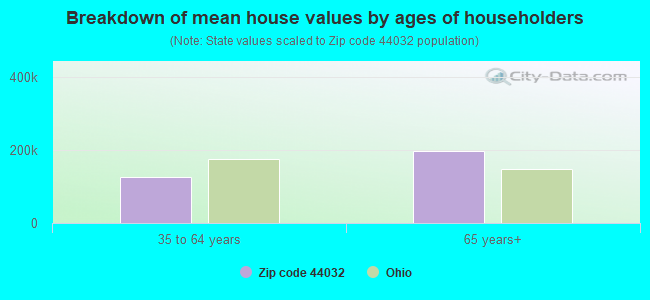
Estimated median house/condo value in 2022: $188,957
44032:
$188,957
Ohio:
$204,100
According to our research of Ohio and other state lists, there were 5 registered sex offenders living in 44032 zip code as of June 02, 2024. The ratio of all residents to sex offenders in zip code 44032 is 492 to 1. The ratio of registered sex offenders to all residents in this zip code is near the state average.
Median resident age:
This zip code:
38.8 years
Ohio median age:
39.9 years
Average household size:
This zip code:
3.1 people
Ohio:
2.4 people
Averages for the 2020 tax year for zip code 44032, filed in 2021:
Average Adjusted Gross Income (AGI) in 2020: $42,227 (Individual Income Tax Returns)
Here:
$42,227
State:
$67,288
Salary/wage: $40,169 (reported on 72.9% of returns)
Here:
$40,169
State:
$55,628
(% of AGI for various income ranges: 1107.1% for AGIs below $25k, 3821.9% for AGIs $25k-50k, 5674.4% for AGIs $50k-75k, 7742.0% for AGIs $75k-100k, 11703.3% for AGIs $100k-200k)
Taxable interest for individuals: $392 (reported on 18.6% of returns)
This zip code:
$392
Ohio:
$1,518
(% of AGI for various income ranges: 3.5% for AGIs below $25k, 12.5% for AGIs $25k-50k, 6.7% for AGIs $50k-75k, 38.0% for AGIs $75k-100k)
Ordinary dividends: $3,250 (reported on 11.4% of returns)
Here:
$3,250
State:
$7,167
(% of AGI for various income ranges: 16.5% for AGIs below $25k, 95.0% for AGIs $25k-50k, 160.0% for AGIs $75k-100k)
Net capital gain/loss in AGI: +$5,714 (reported on 10.0% of returns)
Here:
+$5,714
State:
+$18,919
(% of AGI for various income ranges: 78.1% for AGIs $25k-50k, 550.0% for AGIs $75k-100k)
Profit/loss from business: +$11,725 (reported on 17.1% of returns)
Here:
+$11,725
State:
+$13,744
(% of AGI for various income ranges: 248.2% for AGIs below $25k, 240.0% for AGIs $25k-50k, 667.8% for AGIs $50k-75k)
Taxable individual retirement arrangement distribution: $13,340 (reported on 7.1% of returns)
44032:
$13,340
Ohio:
$18,876
(% of AGI for various income ranges: 139.4% for AGIs below $25k, 477.8% for AGIs $50k-75k)
Earned income credit: $1,983 (reported on 17.1% of returns)
Here:
$1,983
State:
$2,304
(% of AGI for various income ranges: 90.0% for AGIs below $25k, 53.1% for AGIs $25k-50k)
Percentage of individuals using paid preparers for their 2020 taxes: 92.9%
Here:
93%
State:
94%
(% for various income ranges: 95.8% for AGIs below $25k, 91.3% for AGIs $25k-50k, 91.7% for AGIs $50k-75k, 100.0% for AGIs $75k-100k, 80.0% for AGIs $100k-200k)
Averages for the 2012 tax year for zip code 44032, filed in 2013:
Average Adjusted Gross Income (AGI) in 2012: $37,625 (Individual Income Tax Returns)
Here:
$37,625
State:
$54,926
Salary/wage: $33,932 (reported on 81.9% of returns)
Here:
$33,932
State:
$45,869
(% of AGI for various income ranges: 69.0% for AGIs below $25k, 80.9% for AGIs $25k-50k, 77.2% for AGIs $50k-75k, 78.8% for AGIs $75k-100k, 57.4% for AGIs $100k-200k)
Taxable interest for individuals: $229 (reported on 23.6% of returns)
This zip code:
$229
Ohio:
$1,297
(% of AGI for various income ranges: 0.2% for AGIs $25k-50k, 0.2% for AGIs $50k-75k, 0.1% for AGIs $75k-100k)
Ordinary dividends: $1,833 (reported on 12.5% of returns)
Here:
$1,833
State:
$5,821
(% of AGI for various income ranges: 1.4% for AGIs $25k-50k, 0.6% for AGIs $50k-75k, 0.4% for AGIs $75k-100k)
Net capital gain/loss in AGI: +$360 (reported on 6.9% of returns)
Here:
+$360
State:
+$11,232
(% of AGI for various income ranges: 0.2% for AGIs $50k-75k)
Profit/loss from business: +$8,123 (reported on 18.1% of returns)
Here:
+$8,123
State:
+$12,773
(% of AGI for various income ranges: 12.5% for AGIs below $25k, 5.6% for AGIs $25k-50k, 1.2% for AGIs $50k-75k)
Taxable individual retirement arrangement distribution: $9,520 (reported on 6.9% of returns)
44032:
$9,520
Ohio:
$14,511
(% of AGI for various income ranges: 4.8% for AGIs below $25k, 3.8% for AGIs $50k-75k)
Total itemized deductions: $15,800 (23% of AGI, reported on 20.8% of returns)
Here:
$15,800
State:
$21,278
Here:
23.2% of AGI
State:
18.8% of AGI
(% of AGI for various income ranges: 11.6% for AGIs $25k-50k, 9.4% for AGIs $50k-75k, 23.1% for AGIs $75k-100k)
Charity contributions: $2,433 (reported on 12.5% of returns)
Here:
$2,433
State:
$3,943
(% of AGI for various income ranges: 0.8% for AGIs $25k-50k, 1.3% for AGIs $50k-75k, 1.9% for AGIs $75k-100k)
Taxes paid: $4,813 (reported on 20.8% of returns)
44032:
$4,813
State:
$9,568
(% of AGI for various income ranges: 2.6% for AGIs $25k-50k, 2.6% for AGIs $50k-75k, 9.6% for AGIs $75k-100k)
Earned income credit: $2,143 (reported on 19.4% of returns)
Here:
$2,143
State:
$2,285
(% of AGI for various income ranges: 5.1% for AGIs below $25k, 1.0% for AGIs $25k-50k)
Percentage of individuals using paid preparers for their 2012 taxes: 56.9%
Here:
57%
State:
51%
(% for various income ranges: 53.1% for AGIs below $25k, 61.9% for AGIs $25k-50k, 58.3% for AGIs $50k-75k, 100.0% for AGIs $75k-100k, 0.0% for AGIs $100k-200k)
Averages for the 2004 tax year for zip code 44032, filed in 2005:
Average Adjusted Gross Income (AGI) in 2004: $28,943 (Individual Income Tax Returns)
Here:
$28,943
State:
$44,480
Salary/wage: $28,142 (reported on 82.8% of returns)
Here:
$28,142
State:
$39,198
(% of AGI for various income ranges: 100.2% for AGIs below $10k, 72.7% for AGIs $10k-25k, 86.2% for AGIs $25k-50k, 85.5% for AGIs $50k-75k, 67.5% for AGIs $75k-100k)
Taxable interest for individuals: $601 (reported on 37.9% of returns)
This zip code:
$601
Ohio:
$1,532
(% of AGI for various income ranges: 4.7% for AGIs below $10k, 1.9% for AGIs $10k-25k, 0.4% for AGIs $25k-50k, 0.5% for AGIs $50k-75k, 0.2% for AGIs $75k-100k)
Taxable dividends: $1,170 (reported on 14.6% of returns)
Here:
$1,170
State:
$3,496
(% of AGI for various income ranges: 1.4% for AGIs below $10k, 1.6% for AGIs $10k-25k, 0.5% for AGIs $25k-50k, 0.3% for AGIs $50k-75k)
Net capital gain/loss: +$91 (reported on 10.0% of returns)
Here:
+$91
State:
+$8,582
Profit/loss from business: +$6,468 (reported on 14.5% of returns)
Here:
+$6,468
State:
+$10,813
(% of AGI for various income ranges: 5.4% for AGIs below $10k, 7.2% for AGIs $10k-25k, 4.4% for AGIs $25k-50k, 0.6% for AGIs $50k-75k)
Total itemized deductions: $12,527 (24% of AGI, reported on 22.0% of returns)
Here:
$12,527
State:
$17,503
Here:
23.5% of AGI
State:
20.8% of AGI
(% of AGI for various income ranges: 7.3% for AGIs $10k-25k, 8.5% for AGIs $25k-50k, 12.3% for AGIs $50k-75k, 11.7% for AGIs $75k-100k)
Charity contributions deductions: $1,820 (3% of AGI, reported on 16.7% of returns)
Here:
$1,820
State:
$3,087
Here:
3.5% of AGI
State:
3.4% of AGI
(% of AGI for various income ranges: 1.1% for AGIs $10k-25k, 0.7% for AGIs $25k-50k, 1.8% for AGIs $50k-75k, 0.8% for AGIs $75k-100k)
Total tax: $2,985 (reported on 67.7% of returns)
44032:
$2,985
State:
$6,781
(% of AGI for various income ranges: 3.3% for AGIs below $10k, 3.7% for AGIs $10k-25k, 6.1% for AGIs $25k-50k, 8.6% for AGIs $50k-75k, 10.5% for AGIs $75k-100k)
Earned income credit: $1,633 (reported on 18.1% of returns)
Here:
$1,633
State:
$1,696
Percentage of individuals using paid preparers for their 2004 taxes: 57.3%
Here:
57%
State:
55%
(% for various income ranges: 45.6% for AGIs below $10k, 59.2% for AGIs $10k-25k, 64.0% for AGIs $25k-50k, 59.8% for AGIs $50k-75k, 56.4% for AGIs $75k-100k)
Household received Food Stamps/SNAP in the past 12 months: 35 Household did not receive Food Stamps/SNAP in the past 12 months: 467
Women who had a birth in the past 12 months: 4 (5 now married, 0 unmarried) Women who did not have a birth in the past 12 months: 270 (151 now married, 119 unmarried)
Housing units in zip code 44032 with a mortgage: 318 (86 second mortgage) Houses without a mortgage: 33
Median monthly owner costs for units with a mortgage: $1,780 Median monthly owner costs for units without a mortgage: $355
Residents with income below the poverty level in 2022:
This zip code:
2.3%
Whole state:
13.4%
Median number of rooms in houses and condos:
Here:
6.0
State:
6.7
Notable locations in this zip code not listed on our city pages
Notable locations in zip code 44032: Comp Dairy Farm (A), Bar D Farm (B), Bay - Lee - Dell Farms (C), Woodard Dairy Farm (D), Dorset Volunteer Fire Department (E). Display/hide their locations on the map
Size of family households: 132 2-persons, 55 3-persons, 144 4-persons, 25 6-persons, 38 7-or-more-persons
Size of nonfamily households: 87 1-person, 14 2-persons
255 married couples with children.
69 single-parent households (69 men).
95.9% of residents of 44032 zip code speak English at home.
3.1% of residents speak other Indo-European language at home (24% very well, 56% well, 20% not well).
0.3% of residents speak other language at home (100% very well).
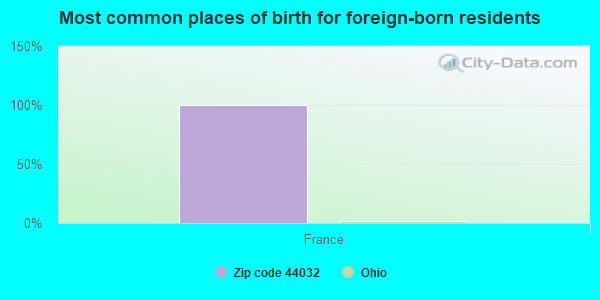
Foreign born population: 10 (0.7%) (100.0% of them are naturalized citizens)
This zip code:
0.7%
Whole state:
5.0%
100%France
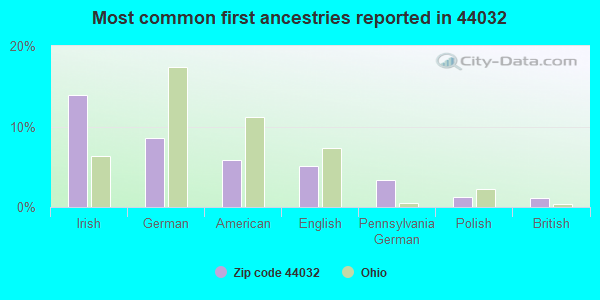
14%Irish
9%German
6%American
5%English
3%Pennsylvania German
1%Polish
1%British
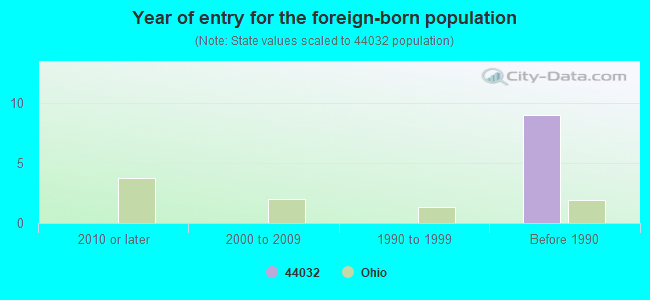
Year of entry for the foreign-born population
02010 or later
02000 to 2009
01990 to 1999
9Before 1990
Facilities with environmental interests located in this zip code:
ALLTEL - DORSET (5964 STATE RTE 193 in DORSET, OH)
(Integrated Compliance Information System) - ICIS-HQ-2000-6004, FORMAL ENFORCEMENT ACTION
Housing units lacking complete plumbing facilities: 8.0% Housing units lacking complete kitchen facilities: 7.6%
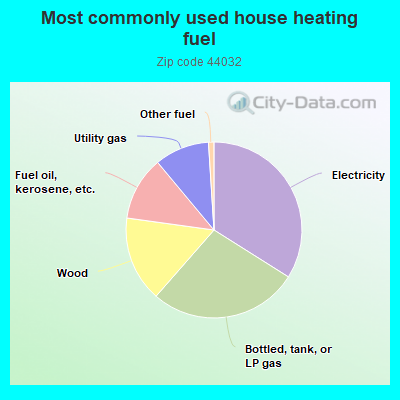
34.1%Electricity
27.6%Bottled, tank, or LP gas
15.8%Wood
11.8%Fuel oil, kerosene, etc.
10.1%Utility gas
1.0%Other fuel
Population in 1990: 1,536.
Place of birth for U.S.-born residents:
This state: 1,360
Northeast: 121
Midwest: 3
South: 46
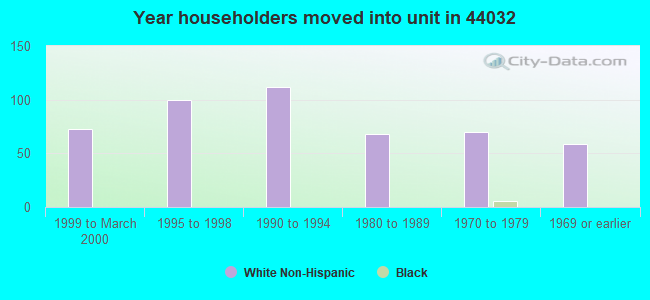
59% of the 44032 zip code residents lived in the same house 5 years ago. Out of people who lived in different houses, 71% lived in this county. Out of people who lived in different counties, 50% lived in Ohio.
94% of the 44032 zip code residents lived in the same house 1 year ago. Out of people who lived in different houses, 68% moved from this county. Out of people who lived in different houses, 11% moved from different county within same state. Out of people who lived in different houses, 21% moved from different state.
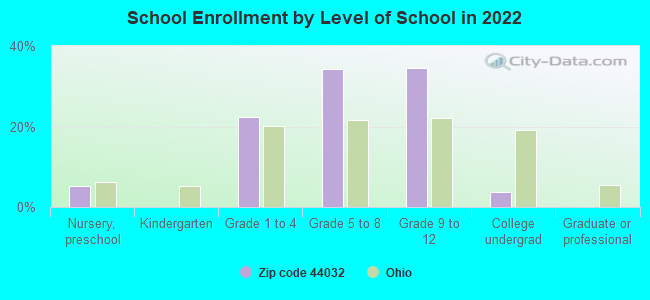
Private vs. public school enrollment:
Students in private schools in grades 1 to 8 (elementary and middle school): 19
Here:
7.3%
Ohio:
16.0%
Students in private schools in grades 9 to 12 (high school):
Here:
0.0%
Ohio:
13.1%
Students in private undergraduate colleges:
Here:
0.0%
Ohio:
22.3%
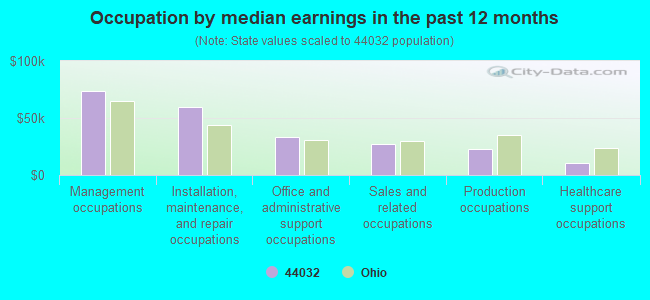
Occupation by median earnings in the past 12 months ($)
73,788Management occupations
59,254Installation, maintenance, and repair occupations
33,448Office and administrative support occupations
26,910Sales and related occupations
23,206Production occupations
10,945Healthcare support occupations
Top industries in this zip code by the number of employees in 2005:
Mining: Support Activities for Oil and Gas Operations (10-19 employees: 1 establishment, 5-9 employees: 1 establishment)
Construction: Plumbing, Heating, and Air-Conditioning Contractors (10-19: 1)
Accommodation and Food Services: Full-Service Restaurants (5-9: 1)
Administrative and Support and Waste Management and Remediation Services: Janitorial Services (5-9: 1)
Other Services (except Public Administration): Other Electronic and Precision Equipment Repair and Maintenance (1-4: 1)
Fatal accident statistics in 2014:
Fatal accident count: 1
Vehicles involved in fatal accidents: 1
Fatal accidents caused by drunken drivers: 1
Fatalities: 1
Persons involved in fatal accidents: 1
Pedestrians involved in fatal accidents: 0
Fatal accident statistics in 2011:
Fatal accident count: 2
Vehicles involved in fatal accidents: 4
Fatal accidents caused by drunken drivers: 1
Fatalities: 3
Persons involved in fatal accidents: 4
Pedestrians involved in fatal accidents: 0
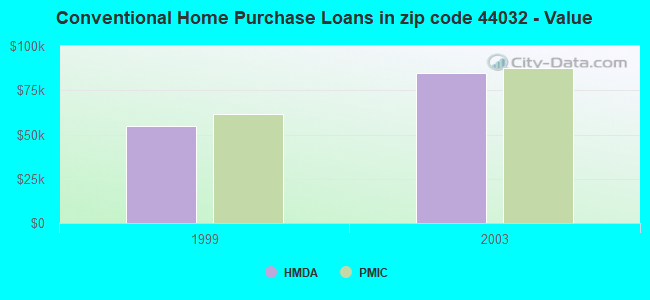
Home Mortgage Disclosure Act Aggregated Statistics For Year 2003 (Based on 2 partial tracts)
A) FHA, FSA/RHS & VA Home Purchase Loans
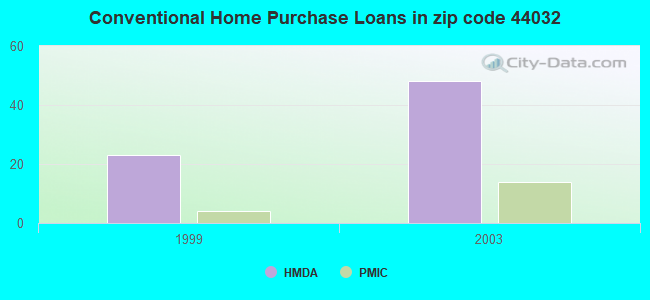
B) Conventional Home Purchase Loans
C) Refinancings
D) Home Improvement Loans
F) Non-occupant Loans on < 5 Family Dwellings (A B C & D)
Number
Average Value
Number
Average Value
Number
Average Value
Number
Average Value
Number
Average Value
LOANS ORIGINATED
7
$101,816
48
$84,810
135
$82,239
18
$20,009
17
$62,320
APPLICATIONS APPROVED, NOT ACCEPTED
0
$0
7
$53,560
21
$84,090
2
$15,660
4
$37,022
APPLICATIONS DENIED
1
$95,300
20
$64,090
63
$83,046
13
$22,645
4
$94,290
APPLICATIONS WITHDRAWN
1
$151,670
9
$78,593
32
$92,878
1
$23,260
0
$0
FILES CLOSED FOR INCOMPLETENESS
1
$77,400
1
$131,980
6
$83,888
0
$0
0
$0
Aggregated Statistics For Year 1999 (Based on 1 partial tract)
A) FHA, FSA/RHS & VA Home Purchase Loans
B) Conventional Home Purchase Loans
C) Refinancings
D) Home Improvement Loans
F) Non-occupant Loans on < 5 Family Dwellings (A B C & D)
Detailed PMIC statistics for the following Tracts:0013.00
2002 - 2018 National Fire Incident Reporting System (NFIRS) incidents
Based on the data from the years 2002 - 2018 the average number of fires per year is 23. The highest number of reported fire incidents - 34 took place in 2009, and the least - 11 in 2002. The data has a growing trend.
When looking into fire subcategories, the most reports belonged to: Structure Fires (47.8%), and Outside Fires (39.2%).
Fire incident types reported to NFIRS in Zip Code 44032


 Nearest zip codes: 44047, 44003, 44082, 44093, 44048, 44010.


 Based on the data from the years 2002 - 2018 the average number of fires per year is 23. The highest number of reported fire incidents - 34 took place in 2009, and the least - 11 in 2002. The data has a growing trend.
 When looking into fire subcategories, the most reports belonged to: Structure Fires (47.8%), and Outside Fires (39.2%).