Estimated zip code population in 2022: 7,233 Zip code population in 2010: 6,936 Zip code population in 2000: 6,734
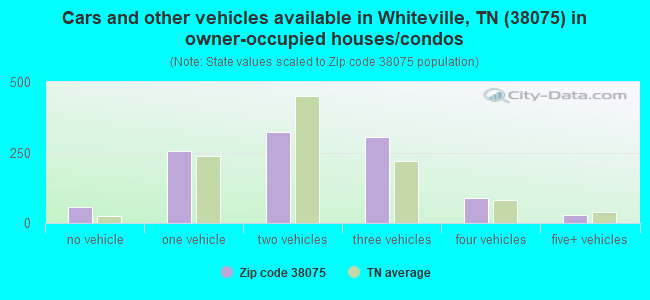
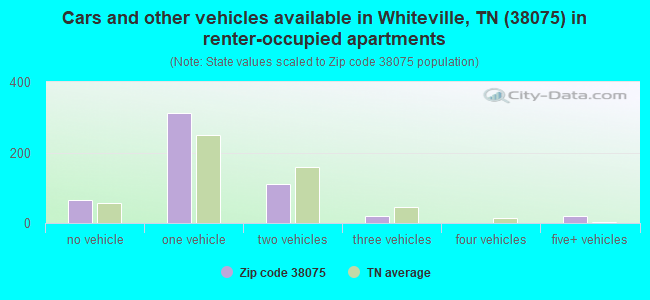
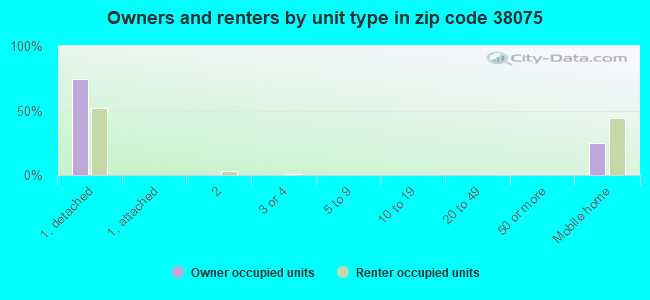
Houses and condos: 1,741 Renter-occupied apartments: 524
% of renters here:
33%
State:
33%
March 2022 cost of living index in zip code 38075: 78.8 (low, U.S. average is 100)
Land area: 133.5 sq. mi. Water area: 0.4 sq. mi.
Population density: 54 people per square mile
(very low).
OSM Map
General Map
Google Map
MSN Map
OSM Map
General Map
Google Map
MSN Map
OSM Map
General Map
Google Map
MSN Map
OSM Map
General Map
Google Map
MSN Map
Please wait while loading the map...
Real estate property taxes paid for housing units in 2022:
This zip code:
0.5% ($693)
Tennessee:
0.5% ($1,376)
Median real estate property taxes paid for housing units with mortgages in 2022: $841 (0.5%) Median real estate property taxes paid for housing units with no mortgage in 2022: $634 (0.5%)
Business Search- 14 Million verified businesses
Males: 5,366
(74.2%)
Females: 1,866
(25.8%)
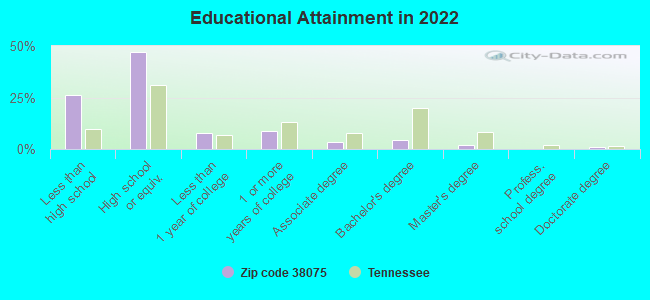
For population 25 years and over in 38075:
High school or higher: 70.9%
Bachelor's degree or higher: 6.8%
Graduate or professional degree: 2.7%
Unemployed: 4.5%
Mean travel time to work (commute): 28.2 minutes
For population 15 years and over in 38075:
Never married: 49.7%
Now married: 27.8%
Separated: 2.5%
Widowed: 4.2%
Divorced: 15.7%
Zip code 38075 compared to state average:
Median house value below state average.
Black race population percentage above state average.
Foreign-born population percentage significantly below state average.
Length of stay since moving in above state average.
Number of college students below state average.
Percentage of population with a bachelor's degree or higher significantly below state average.
Averages for the 2020 tax year for zip code 38075, filed in 2021:
Average Adjusted Gross Income (AGI) in 2020: $35,032 (Individual Income Tax Returns)
Here:
$35,032
State:
$69,014
Salary/wage: $36,985 (reported on 69.9% of returns)
Here:
$36,985
State:
$55,872
(% of AGI for various income ranges: 1245.6% for AGIs below $25k, 3811.8% for AGIs $25k-50k, 6840.6% for AGIs $50k-75k, 9277.1% for AGIs $75k-100k, 22266.0% for AGIs $100k-200k)
Taxable interest for individuals: $370 (reported on 28.6% of returns)
This zip code:
$370
Tennessee:
$1,945
(% of AGI for various income ranges: 4.5% for AGIs below $25k, 5.5% for AGIs $25k-50k, 58.8% for AGIs $50k-75k, 132.0% for AGIs $100k-200k)
Ordinary dividends: $3,571 (reported on 3.6% of returns)
Here:
$3,571
State:
$8,105
(% of AGI for various income ranges: 22.5% for AGIs $25k-50k, 320.0% for AGIs $100k-200k)
Net capital gain/loss in AGI: +$8,038 (reported on 4.1% of returns)
Here:
+$8,038
State:
+$33,664
(% of AGI for various income ranges: 1.6% for AGIs below $25k, 49.4% for AGIs $50k-75k, 1110.0% for AGIs $100k-200k)
Profit/loss from business: +$5,500 (reported on 13.8% of returns)
Here:
+$5,500
State:
+$18,991
(% of AGI for various income ranges: 34.9% for AGIs below $25k, 58.5% for AGIs $25k-50k, 261.9% for AGIs $50k-75k, 1280.0% for AGIs $100k-200k)
Taxable individual retirement arrangement distribution: $9,314 (reported on 3.6% of returns)
38075:
$9,314
Tennessee:
$20,036
(% of AGI for various income ranges: 43.1% for AGIs below $25k, 107.5% for AGIs $50k-75k, 347.1% for AGIs $75k-100k)
Total itemized deductions: $38,250 (reported on 3.1% of returns)
Here:
$38,250
State:
$40,136
(% of AGI for various income ranges: 867.5% for AGIs $50k-75k, 1814.0% for AGIs $100k-200k)
Charity contributions: $15,783 (reported on 3.1% of returns)
Here:
$15,783
State:
$19,852
(% of AGI for various income ranges: 247.5% for AGIs $50k-75k, 1102.0% for AGIs $100k-200k)
Taxes paid: $4,540 (reported on 2.6% of returns)
38075:
$4,540
State:
$6,038
(% of AGI for various income ranges: 74.4% for AGIs $50k-75k, 216.0% for AGIs $100k-200k)
Earned income credit: $2,462 (reported on 24.0% of returns)
Here:
$2,462
State:
$2,391
(% of AGI for various income ranges: 142.9% for AGIs below $25k, 92.8% for AGIs $25k-50k)
Percentage of individuals using paid preparers for their 2020 taxes: 74.5%
Here:
74%
State:
93%
(% for various income ranges: 58.3% for AGIs below $25k, 93.9% for AGIs $25k-50k, 91.3% for AGIs $50k-75k, 90.0% for AGIs $75k-100k, 88.9% for AGIs $100k-200k, 100.0% for AGIs over 200k)
Averages for the 2012 tax year for zip code 38075, filed in 2013:
Average Adjusted Gross Income (AGI) in 2012: $34,293 (Individual Income Tax Returns)
Here:
$34,293
State:
$53,767
Salary/wage: $31,109 (reported on 85.9% of returns)
Here:
$31,109
State:
$45,421
(% of AGI for various income ranges: 80.8% for AGIs below $25k, 87.0% for AGIs $25k-50k, 80.8% for AGIs $50k-75k, 74.9% for AGIs $75k-100k, 53.8% for AGIs $100k-200k)
Taxable interest for individuals: $764 (reported on 16.0% of returns)
This zip code:
$764
Tennessee:
$1,732
(% of AGI for various income ranges: 0.4% for AGIs below $25k, 0.2% for AGIs $25k-50k, 0.4% for AGIs $50k-75k, 0.3% for AGIs $75k-100k, 0.5% for AGIs $100k-200k)
Ordinary dividends: $2,600 (reported on 5.8% of returns)
Here:
$2,600
State:
$6,739
(% of AGI for various income ranges: 0.1% for AGIs below $25k, 0.3% for AGIs $25k-50k, 0.2% for AGIs $50k-75k, 2.8% for AGIs $75k-100k)
Net capital gain/loss in AGI: +$5,671 (reported on 4.5% of returns)
Here:
+$5,671
State:
+$19,082
Profit/loss from business: +$9,414 (reported on 14.1% of returns)
Here:
+$9,414
State:
+$15,240
(% of AGI for various income ranges: 8.3% for AGIs below $25k, 2.7% for AGIs $25k-50k, 1.9% for AGIs $50k-75k, 10.2% for AGIs $75k-100k)
Taxable individual retirement arrangement distribution: $8,900 (reported on 4.5% of returns)
38075:
$8,900
Tennessee:
$15,505
(% of AGI for various income ranges: 1.3% for AGIs below $25k, 0.6% for AGIs $25k-50k, 3.4% for AGIs $50k-75k)
Total itemized deductions: $17,355 (26% of AGI, reported on 12.8% of returns)
Here:
$17,355
State:
$21,976
Here:
26.4% of AGI
State:
17.8% of AGI
(% of AGI for various income ranges: 2.4% for AGIs below $25k, 6.2% for AGIs $25k-50k, 13.2% for AGIs $50k-75k, 7.0% for AGIs $100k-200k)
Charity contributions: $4,624 (reported on 10.9% of returns)
Here:
$4,624
State:
$6,709
(% of AGI for various income ranges: 1.6% for AGIs $25k-50k, 2.7% for AGIs $50k-75k, 2.3% for AGIs $100k-200k)
Taxes paid: $3,553 (reported on 12.2% of returns)
38075:
$3,553
State:
$4,829
(% of AGI for various income ranges: 1.6% for AGIs $25k-50k, 2.0% for AGIs $50k-75k, 1.7% for AGIs $100k-200k)
Earned income credit: $2,570 (reported on 35.9% of returns)
Here:
$2,570
State:
$2,404
(% of AGI for various income ranges: 11.4% for AGIs below $25k, 1.6% for AGIs $25k-50k)
Percentage of individuals using paid preparers for their 2012 taxes: 50.6%
Here:
51%
State:
52%
(% for various income ranges: 48.0% for AGIs below $25k, 50.0% for AGIs $25k-50k, 52.6% for AGIs $50k-75k, 66.7% for AGIs $75k-100k, 66.7% for AGIs $100k-200k)
Averages for the 2004 tax year for zip code 38075, filed in 2005:
Average Adjusted Gross Income (AGI) in 2004: $30,467 (Individual Income Tax Returns)
Here:
$30,467
State:
$44,088
Salary/wage: $26,471 (reported on 88.6% of returns)
Here:
$26,471
State:
$38,825
(% of AGI for various income ranges: 97.2% for AGIs below $10k, 88.6% for AGIs $10k-25k, 89.3% for AGIs $25k-50k, 82.9% for AGIs $50k-75k, 75.3% for AGIs $75k-100k, 20.0% for AGIs over 100k)
Taxable interest for individuals: $1,601 (reported on 16.9% of returns)
This zip code:
$1,601
Tennessee:
$1,802
(% of AGI for various income ranges: 1.3% for AGIs below $10k, 0.8% for AGIs $10k-25k, 0.6% for AGIs $25k-50k, 0.3% for AGIs $50k-75k, 1.0% for AGIs $75k-100k, 2.4% for AGIs over 100k)
Taxable dividends: $4,753 (reported on 4.9% of returns)
Here:
$4,753
State:
$3,727
(% of AGI for various income ranges: 0.2% for AGIs below $10k, 0.1% for AGIs $25k-50k, 0.3% for AGIs $50k-75k, 4.7% for AGIs over 100k)
Net capital gain/loss: +$14,269 (reported on 4.8% of returns)
Here:
+$14,269
State:
+$15,776
(% of AGI for various income ranges: 0.5% for AGIs below $10k, 0.2% for AGIs $25k-50k, 2.1% for AGIs $50k-75k, 12.1% for AGIs over 100k)
Profit/loss from business: +$8,475 (reported on 12.5% of returns)
Here:
+$8,475
State:
+$12,882
(% of AGI for various income ranges: -13.7% for AGIs below $10k, 3.4% for AGIs $10k-25k, 2.9% for AGIs $25k-50k, 5.7% for AGIs $50k-75k, 13.4% for AGIs $75k-100k)
IRA payment deduction: $3,312 (reported on 1.0% of returns)
38075:
$3,312
Tennessee:
$2,934
Total itemized deductions: $14,514 (28% of AGI, reported on 13.3% of returns)
Here:
$14,514
State:
$18,035
Here:
27.8% of AGI
State:
19.9% of AGI
(% of AGI for various income ranges: 4.0% for AGIs $10k-25k, 6.9% for AGIs $25k-50k, 9.4% for AGIs $50k-75k, 8.6% for AGIs $75k-100k, 4.6% for AGIs over 100k)
Charity contributions deductions: $4,011 (7% of AGI, reported on 11.0% of returns)
Here:
$4,011
State:
$5,167
Here:
7.4% of AGI
State:
5.3% of AGI
(% of AGI for various income ranges: 0.7% for AGIs $10k-25k, 1.5% for AGIs $25k-50k, 2.3% for AGIs $50k-75k, 2.1% for AGIs $75k-100k, 1.2% for AGIs over 100k)
Total tax: $3,741 (reported on 61.9% of returns)
38075:
$3,741
State:
$7,482
(% of AGI for various income ranges: 3.8% for AGIs below $10k, 2.6% for AGIs $10k-25k, 5.8% for AGIs $25k-50k, 8.2% for AGIs $50k-75k, 10.8% for AGIs $75k-100k, 17.3% for AGIs over 100k)
Earned income credit: $1,990 (reported on 36.3% of returns)
Here:
$1,990
State:
$1,826
Percentage of individuals using paid preparers for their 2004 taxes: 64.1%
Here:
64%
State:
60%
(% for various income ranges: 56.0% for AGIs below $10k, 69.8% for AGIs $10k-25k, 62.4% for AGIs $25k-50k, 63.8% for AGIs $50k-75k, 66.7% for AGIs $75k-100k, 69.6% for AGIs over 100k)
Household received Food Stamps/SNAP in the past 12 months: 334 Household did not receive Food Stamps/SNAP in the past 12 months: 1,240
Women who had a birth in the past 12 months: 90 (3 now married, 83 unmarried) Women who did not have a birth in the past 12 months: 733 (293 now married, 439 unmarried)
Housing units in zip code 38075 with a mortgage: 521 (8 second mortgage, 6 both second mortgage and home equity loan) Median monthly owner costs for units with a mortgage: $1,275 Median monthly owner costs for units without a mortgage: $320
Residents with income below the poverty level in 2022:
This zip code:
13.5%
Whole state:
13.3%
Residents with income below 50% of the poverty level in 2022:
This zip code:
10.6%
Whole state:
7.1%
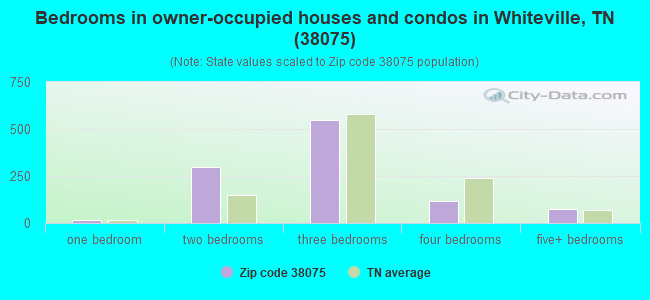
Median number of rooms in houses and condos:
Here:
5.5
State:
6.5
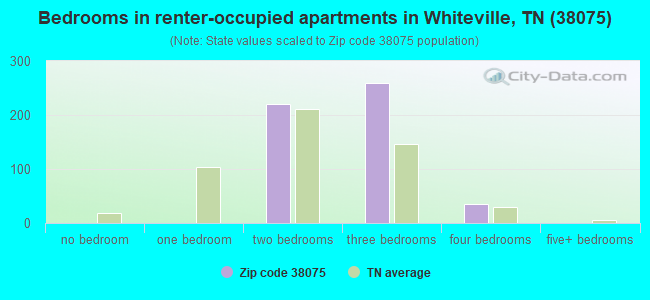
Median number of rooms in apartments:
Here:
5.2
State:
4.4
Notable locations in this zip code not listed on our city pages
Notable locations in zip code 38075: Powell Camp (A), Old Ferry Landing (B), Gallaway Volunteer Fire Department (C), Whiteville City Hall (D), Whiteville Volunteer Fire Department (E). Display/hide their locations on the map
Churches in zip code 38075 include: Simons Chapel (A), Elcanaan Baptist Church (B), First Baptist Church (C), First United Methodist Church (D), Bethlehem Church (E), Antioch Missionary Baptist Church (F), Union Hill Church (G), Bartlett Chapel (H), Mount Tabor Churchs (I). Display/hide their locations on the map
Cemeteries: Sammons Cemetery (1), Johnson Church Cemetery (2), Vildo Cemetery (3), Kinney Cemetery (4), Williams Cemetery (5), Bartlett Chapel Cemetery (6), Bethany Cemetery (7). Display/hide their locations on the map
Lakes, reservoirs, and swamps: Round Pond (A), Brushy Pond (B), Brush Lake (C), Little Pigeon Lake (D), Duck Pond (E), Clover Lakes (F), Horseshoe Cutoff (G), Jennie Pond (H). Display/hide their locations on the map
Streams, rivers, and creeks: Hickory Creek (A), Gamble Branch (B), Clear Creek (C), Mill Branch (D), Pinner Creek (E), Oak Dain Creek (F), Morris Branch (G), Running Slough (H), Richland Creek (I). Display/hide their locations on the map
In group quarters: 3,336 (-1 institutionalized population)
Size of family households: 469 2-persons, 224 3-persons, 104 4-persons, 108 5-persons, 9 6-persons, 51 7-or-more-persons
Size of nonfamily households: 558 1-person, 58 2-persons
406 married couples with children.
322 single-parent households (34 men, 288 women).
94.4% of residents of 38075 zip code speak English at home.
3.5% of residents speak Spanish at home (65% very well, 15% well, 20% not well).
1.0% of residents speak other Indo-European language at home (100% very well).
0.1% of residents speak Asian or Pacific Island language at home (100% very well).
0.5% of residents speak other language at home (83% very well, 17% well).
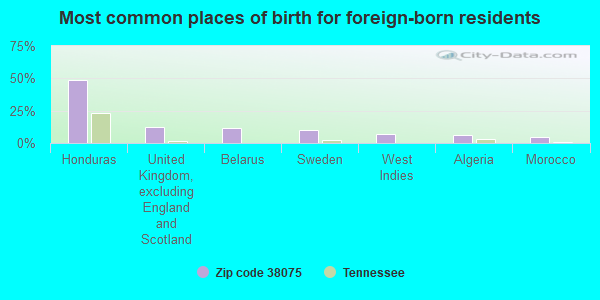
Foreign born population: 137 (1.9%) (12.0% of them are naturalized citizens)
This zip code:
1.9%
Whole state:
5.6%
49%Honduras
12%United Kingdom, excluding England and Scotland
12%Belarus
10%Sweden
7%West Indies
6%Algeria
4%Morocco
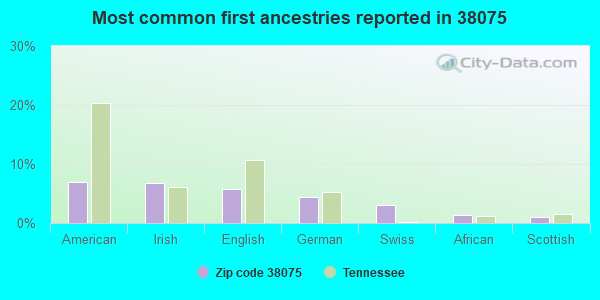
7%American
7%Irish
6%English
4%German
3%Swiss
1%African
1%Scottish
Year of entry for the foreign-born population
602010 or later
502000 to 2009
751990 to 1999
0Before 1990
Facilities with environmental interests located in this zip code:
GARNER AUTOMOTIVE ELECTRICAL (WHITEVILLE (428 SOUTH WOODLAND EXT. in WHITEVILLE, TN)
HAZARDOUS WASTE BIENNIAL REPORTER (Resource Conservation and Recovery Act (tracking hazardous waste)) Large Quantity Generators, more that 1000 kg of hazardous waste/month (Resource Conservation and Recovery Act (tracking hazardous waste)) - notification Organizations: DAVID BREWER (CONTACT/OPERATOR)
, JOE GARNER (CONTACT/OWNER)
Alternative names: GARNER AUTOMOTIVE ELECTRICAL INC
GARNER AUTOMOTIVE ELECTRICAL INC (UNION SPRING RD FARM NO 2459 in WHITEVILLE, TN)
(Resource Conservation and Recovery Act (tracking hazardous waste)) Business NAICS classification: OTHER MOTOR VEHICLE ELECTRICAL AND ELECTRONIC EQUIPMENT MANUFACTURING.
Housing units lacking complete plumbing facilities: 7.2% Housing units lacking complete kitchen facilities: 4.9%
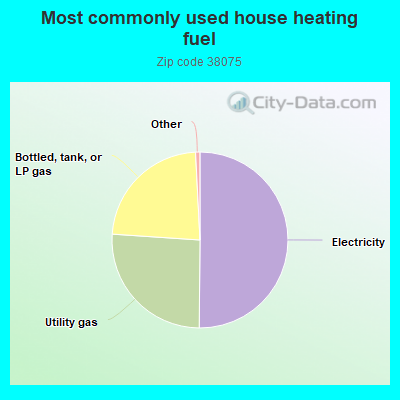
50.1%Electricity
25.9%Utility gas
23.1%Bottled, tank, or LP gas
Population in 1990: 3,044. Population change in the 1990s: +3,690 (+121.2%).
Place of birth for U.S.-born residents:
This state: 5,458
Northeast: 75
Midwest: 545
South: 815
West: 75
41% of the 38075 zip code residents lived in the same house 5 years ago. Out of people who lived in different houses, 21% lived in this county. Out of people who lived in different counties, 50% lived in Tennessee.
82% of the 38075 zip code residents lived in the same house 1 year ago. Out of people who lived in different houses, 11% moved from this county. Out of people who lived in different houses, 89% moved from different county within same state. Out of people who lived in different houses, 2% moved from abroad.
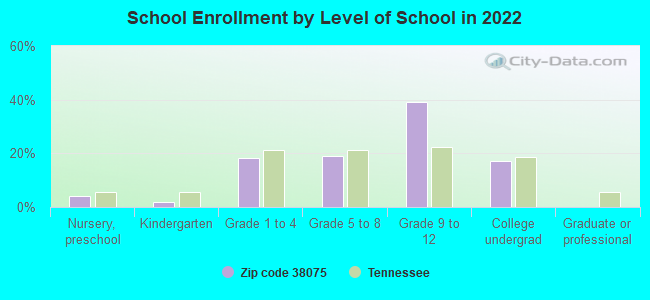
Private vs. public school enrollment:
Students in private schools in grades 1 to 8 (elementary and middle school): 98
Here:
26.6%
Tennessee:
15.0%
Students in private schools in grades 9 to 12 (high school): 84
Here:
22.2%
Tennessee:
16.2%
Students in private undergraduate colleges: 26
Here:
15.8%
Tennessee:
23.5%
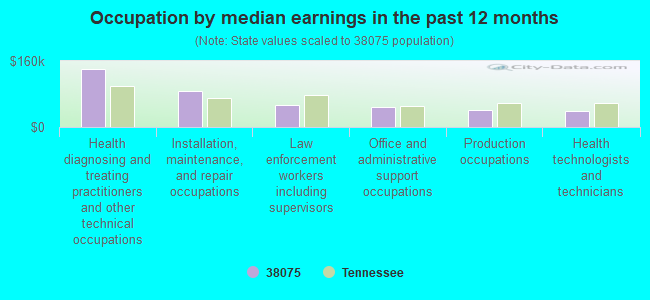
Occupation by median earnings in the past 12 months ($)
140,543Health diagnosing and treating practitioners and other technical occupations
87,683Installation, maintenance, and repair occupations
53,128Law enforcement workers including supervisors
49,692Office and administrative support occupations
41,951Production occupations
39,763Health technologists and technicians
Companies with federal contracts located in this zip code:
UPPER MISSOURI RIVER CORPORATI (3065 MT MORIAH in WHITEVILLE, TN; small business) : $7,149,005 in 31 contractsfrom 2001 to 2005
Contracts for Construction of Structures and Facilities -- Other Non-Building Facilities, Construction of Structures and Facilities -- Recreation Facilities (Non-Building), Construction of Structures and Facilities -- Other Conservation and Development Facilities by U.S. Army Corps of Engineers - civil program financing only, Army Signed by year:2000: $0; 2001: $3,643,790; 2002: $2,092,605; 2003: $714,373; 2004: $800,000; 2005: -$101,763; 2006: $0.
Biggest contracts:
$3,000,000 with U.S. Army Corps of Engineers - civil program financing only for Construction of Structures and Facilities -- Other Non-Building Facilities. Taking place in LA. Signed on 2001-11-20. Completion date: 2002-12-05.
$768,725 with U.S. Army Corps of Engineers - civil program financing only for Construction of Structures and Facilities -- Recreation Facilities (Non-Building). Taking place in MS. Signed on 2002-09-03. Completion date: 2002-02-21.
$522,903 with U.S. Army Corps of Engineers - civil program financing only for Construction of Structures and Facilities -- Other Conservation and Development Facilities. Taking place in LA. Signed on 2003-01-17. Completion date: 2002-04-04.
$506,961, same as above.Signed on 2002-12-12. Completion date: 2002-04-04.
Top industries in this zip code by the number of employees in 2005:
Administrative and Support and Waste Management and Remediation Services: Facilities Support Services (250-499 employees: 2 establishments)
Other Services (except Public Administration): Religious Organizations (5-9: 2, 1-4: 5)
Accommodation and Food Services: Food Service Contractors (10-19: 1, 5-9: 1)
Construction: Water and Sewer Line and Related Structures Construction (10-19: 1, 1-4: 1)
Construction: New Single-Family Housing Construction (except Operative Builders) (10-19: 1)
People in group quarters in 2010:
3,456 people in state prisons
2 people in group homes intended for adults
People in group quarters in 2000:
1,984 people in local jails and other confinement facilities (including police lockups)
1,393 people in state prisons
7 people in homes for the mentally retarded
Fatal accident statistics in 2012:
Fatal accident count: 1
Vehicles involved in fatal accidents: 1
Fatal accidents caused by drunken drivers: 0
Fatalities: 1
Persons involved in fatal accidents: 1
Pedestrians involved in fatal accidents: 0
2002 - 2018 National Fire Incident Reporting System (NFIRS) incidents
Based on the data from the years 2002 - 2018 the average number of fires per year is 26. The highest number of fire incidents - 44 took place in 2015, and the least - 3 in 2003. The data has a rising trend.
When looking into fire subcategories, the most incidents belonged to: Structure Fires (37.6%), and Outside Fires (37.4%).
Fire incident types reported to NFIRS in Zip Code 38075

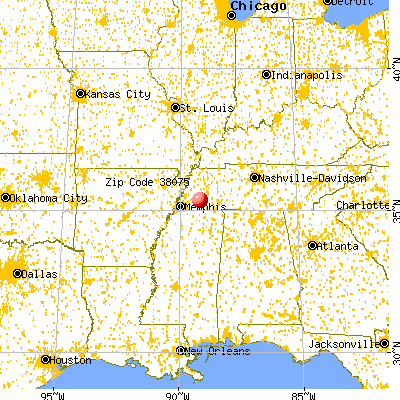


 Nearest zip codes: 38392, 38381, 38008, 38069, 38391, 38042.


 Based on the data from the years 2002 - 2018 the average number of fires per year is 26. The highest number of fire incidents - 44 took place in 2015, and the least - 3 in 2003. The data has a rising trend.
 When looking into fire subcategories, the most incidents belonged to: Structure Fires (37.6%), and Outside Fires (37.4%).