Estimated zip code population in 2022: 8,724 Zip code population in 2010: 9,721 Zip code population in 2000: 10,579
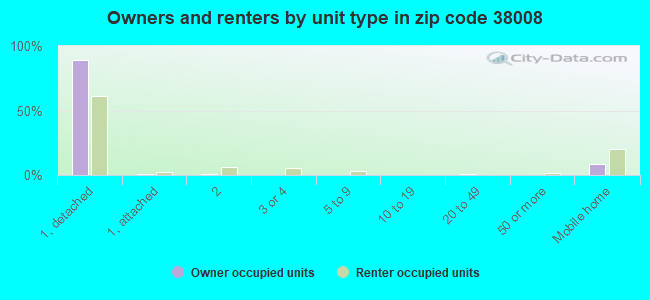
Houses and condos: 4,422 Renter-occupied apartments: 1,257
% of renters here:
33%
State:
33%
March 2022 cost of living index in zip code 38008: 80.6 (low, U.S. average is 100)
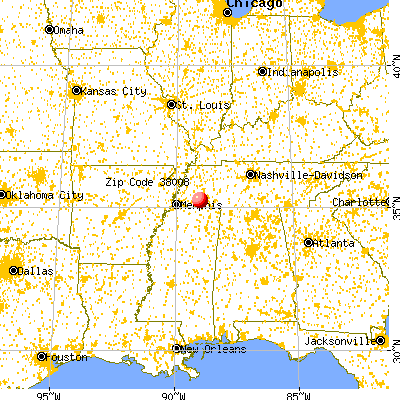
Land area: 148.3 sq. mi. Water area: 0.4 sq. mi.
Population density: 59 people per square mile
(very low).
OSM Map
General Map
Google Map
MSN Map
OSM Map
General Map
Google Map
MSN Map
OSM Map
General Map
Google Map
MSN Map
OSM Map
General Map
Google Map
MSN Map
Please wait while loading the map...
Real estate property taxes paid for housing units in 2022:
This zip code:
0.6% ($939)
Tennessee:
0.5% ($1,376)
Median real estate property taxes paid for housing units with mortgages in 2022: $884 (0.6%) Median real estate property taxes paid for housing units with no mortgage in 2022: $1,051 (0.8%)
Business Search- 14 Million verified businesses
Males: 4,422
(50.7%)
Females: 4,302
(49.3%)
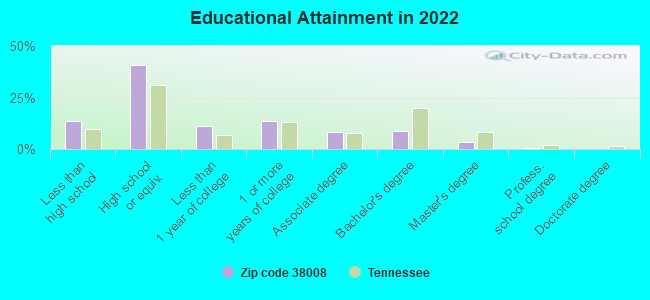
For population 25 years and over in 38008:
High school or higher: 85.3%
Bachelor's degree or higher: 12.5%
Graduate or professional degree: 4.1%
Unemployed: 12.6%
Mean travel time to work (commute): 31.6 minutes
For population 15 years and over in 38008:
Never married: 38.9%
Now married: 39.9%
Separated: 2.8%
Widowed: 7.4%
Divorced: 11.0%
Zip code 38008 compared to state average:
Median household income below state average.
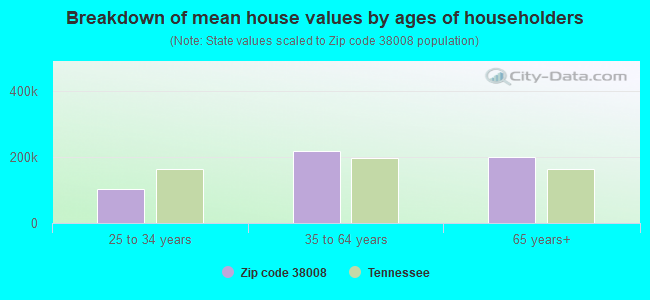
Median house value below state average.
Unemployed percentage significantly above state average.
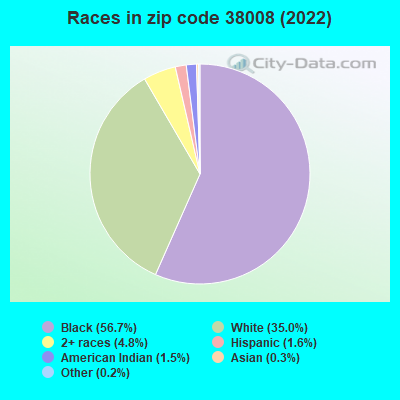
Black race population percentage significantly above state average.
Hispanic race population percentage significantly below state average.
Foreign-born population percentage significantly below state average.
Length of stay since moving in significantly above state average.
Percentage of population with a bachelor's degree or higher significantly below state average.
Averages for the 2020 tax year for zip code 38008, filed in 2021:
Average Adjusted Gross Income (AGI) in 2020: $39,573 (Individual Income Tax Returns)
Here:
$39,573
State:
$69,014
Salary/wage: $34,775 (reported on 83.5% of returns)
Here:
$34,775
State:
$55,872
(% of AGI for various income ranges: 1328.4% for AGIs below $25k, 3630.2% for AGIs $25k-50k, 5942.8% for AGIs $50k-75k, 9238.1% for AGIs $75k-100k, 13850.0% for AGIs $100k-200k)
Taxable interest for individuals: $1,033 (reported on 18.4% of returns)
This zip code:
$1,033
Tennessee:
$1,945
(% of AGI for various income ranges: 8.0% for AGIs below $25k, 10.2% for AGIs $25k-50k, 35.9% for AGIs $50k-75k, 52.5% for AGIs $75k-100k, 182.1% for AGIs $100k-200k)
Ordinary dividends: $3,530 (reported on 7.1% of returns)
Here:
$3,530
State:
$8,105
(% of AGI for various income ranges: 4.7% for AGIs below $25k, 10.0% for AGIs $25k-50k, 35.4% for AGIs $50k-75k, 63.1% for AGIs $75k-100k, 451.4% for AGIs $100k-200k)
Net capital gain/loss in AGI: +$5,396 (reported on 6.6% of returns)
Here:
+$5,396
State:
+$33,664
(% of AGI for various income ranges: 4.5% for AGIs below $25k, 15.6% for AGIs $25k-50k, 79.2% for AGIs $50k-75k, 43.1% for AGIs $75k-100k, 630.0% for AGIs $100k-200k)
Profit/loss from business: +$7,195 (reported on 19.1% of returns)
Here:
+$7,195
State:
+$18,991
(% of AGI for various income ranges: 23.4% for AGIs $25k-50k, 170.0% for AGIs $50k-75k, 169.4% for AGIs $75k-100k, 3309.3% for AGIs $100k-200k)
Taxable individual retirement arrangement distribution: $11,657 (reported on 5.4% of returns)
38008:
$11,657
Tennessee:
$20,036
(% of AGI for various income ranges: 25.3% for AGIs below $25k, 44.9% for AGIs $25k-50k, 231.5% for AGIs $50k-75k, 624.3% for AGIs $100k-200k)
Total itemized deductions: $31,667 (reported on 3.5% of returns)
Here:
$31,667
State:
$40,136
(% of AGI for various income ranges: 113.0% for AGIs $25k-50k, 198.5% for AGIs $50k-75k, 538.8% for AGIs $75k-100k, 1272.1% for AGIs $100k-200k)
Charity contributions: $13,575 (reported on 2.8% of returns)
Here:
$13,575
State:
$19,852
(% of AGI for various income ranges: 29.7% for AGIs $25k-50k, 66.9% for AGIs $50k-75k, 221.2% for AGIs $75k-100k, 474.3% for AGIs $100k-200k)
Taxes paid: $4,377 (reported on 3.1% of returns)
38008:
$4,377
State:
$6,038
(% of AGI for various income ranges: 11.7% for AGIs $25k-50k, 29.7% for AGIs $50k-75k, 45.0% for AGIs $75k-100k, 173.6% for AGIs $100k-200k)
Earned income credit: $2,717 (reported on 31.9% of returns)
Here:
$2,717
State:
$2,391
(% of AGI for various income ranges: 166.1% for AGIs below $25k, 102.5% for AGIs $25k-50k)
Percentage of individuals using paid preparers for their 2020 taxes: 93.9%
Here:
94%
State:
93%
(% for various income ranges: 93.9% for AGIs below $25k, 92.9% for AGIs $25k-50k, 96.2% for AGIs $50k-75k, 91.3% for AGIs $75k-100k, 95.8% for AGIs $100k-200k, 100.0% for AGIs over 200k)
Averages for the 2012 tax year for zip code 38008, filed in 2013:
Average Adjusted Gross Income (AGI) in 2012: $35,658 (Individual Income Tax Returns)
Here:
$35,658
State:
$53,767
Salary/wage: $30,321 (reported on 86.2% of returns)
Here:
$30,321
State:
$45,421
(% of AGI for various income ranges: 78.5% for AGIs below $25k, 85.4% for AGIs $25k-50k, 76.5% for AGIs $50k-75k, 73.7% for AGIs $75k-100k, 75.9% for AGIs $100k-200k)
Taxable interest for individuals: $1,224 (reported on 18.9% of returns)
This zip code:
$1,224
Tennessee:
$1,732
(% of AGI for various income ranges: 0.7% for AGIs below $25k, 0.5% for AGIs $25k-50k, 0.7% for AGIs $50k-75k, 0.5% for AGIs $75k-100k, 0.9% for AGIs $100k-200k, 0.5% for AGIs over 200k)
Ordinary dividends: $2,797 (reported on 9.0% of returns)
Here:
$2,797
State:
$6,739
(% of AGI for various income ranges: 0.4% for AGIs below $25k, 0.3% for AGIs $25k-50k, 1.0% for AGIs $50k-75k, 0.4% for AGIs $75k-100k, 2.2% for AGIs $100k-200k)
Net capital gain/loss in AGI: +$3,282 (reported on 6.8% of returns)
Here:
+$3,282
State:
+$19,082
(% of AGI for various income ranges: 0.9% for AGIs $50k-75k, 0.4% for AGIs $75k-100k, 3.2% for AGIs $100k-200k)
Profit/loss from business: +$10,553 (reported on 15.0% of returns)
Here:
+$10,553
State:
+$15,240
(% of AGI for various income ranges: 7.4% for AGIs below $25k, 1.2% for AGIs $25k-50k, 2.9% for AGIs $50k-75k, 1.8% for AGIs $75k-100k, 13.8% for AGIs $100k-200k)
Taxable individual retirement arrangement distribution: $11,620 (reported on 6.1% of returns)
38008:
$11,620
Tennessee:
$15,505
(% of AGI for various income ranges: 1.5% for AGIs below $25k, 1.1% for AGIs $25k-50k, 2.1% for AGIs $50k-75k, 2.9% for AGIs $75k-100k, 4.6% for AGIs $100k-200k)
Total itemized deductions: $18,149 (24% of AGI, reported on 14.3% of returns)
Here:
$18,149
State:
$21,976
Here:
24.1% of AGI
State:
17.8% of AGI
(% of AGI for various income ranges: 3.3% for AGIs below $25k, 6.4% for AGIs $25k-50k, 8.2% for AGIs $50k-75k, 8.2% for AGIs $75k-100k, 16.3% for AGIs $100k-200k)
Charity contributions: $5,708 (reported on 12.3% of returns)
Here:
$5,708
State:
$6,709
(% of AGI for various income ranges: 0.6% for AGIs below $25k, 1.4% for AGIs $25k-50k, 2.5% for AGIs $50k-75k, 2.7% for AGIs $75k-100k, 4.8% for AGIs $100k-200k)
Taxes paid: $3,031 (reported on 14.0% of returns)
38008:
$3,031
State:
$4,829
(% of AGI for various income ranges: 0.5% for AGIs below $25k, 1.1% for AGIs $25k-50k, 1.3% for AGIs $50k-75k, 1.5% for AGIs $75k-100k, 2.6% for AGIs $100k-200k)
Earned income credit: $2,569 (reported on 36.8% of returns)
Here:
$2,569
State:
$2,404
(% of AGI for various income ranges: 11.4% for AGIs below $25k, 1.7% for AGIs $25k-50k)
Percentage of individuals using paid preparers for their 2012 taxes: 58.1%
Here:
58%
State:
52%
(% for various income ranges: 56.8% for AGIs below $25k, 53.6% for AGIs $25k-50k, 65.9% for AGIs $50k-75k, 60.0% for AGIs $75k-100k, 81.2% for AGIs $100k-200k, 100.0% for AGIs over 200k)
Averages for the 2004 tax year for zip code 38008, filed in 2005:
Average Adjusted Gross Income (AGI) in 2004: $30,294 (Individual Income Tax Returns)
Here:
$30,294
State:
$44,088
Salary/wage: $27,328 (reported on 88.4% of returns)
Here:
$27,328
State:
$38,825
(% of AGI for various income ranges: 101.8% for AGIs below $10k, 86.5% for AGIs $10k-25k, 87.0% for AGIs $25k-50k, 79.4% for AGIs $50k-75k, 75.7% for AGIs $75k-100k, 53.2% for AGIs over 100k)
Taxable interest for individuals: $1,547 (reported on 24.3% of returns)
This zip code:
$1,547
Tennessee:
$1,802
(% of AGI for various income ranges: 3.9% for AGIs below $10k, 1.3% for AGIs $10k-25k, 0.9% for AGIs $25k-50k, 1.2% for AGIs $50k-75k, 1.6% for AGIs $75k-100k, 1.1% for AGIs over 100k)
Taxable dividends: $1,556 (reported on 9.3% of returns)
Here:
$1,556
State:
$3,727
(% of AGI for various income ranges: 1.3% for AGIs below $10k, 0.4% for AGIs $10k-25k, 0.3% for AGIs $25k-50k, 0.3% for AGIs $50k-75k, 0.7% for AGIs $75k-100k, 1.0% for AGIs over 100k)
Net capital gain/loss: +$8,243 (reported on 8.5% of returns)
Here:
+$8,243
State:
+$15,776
(% of AGI for various income ranges: -1.2% for AGIs below $10k, 0.2% for AGIs $10k-25k, 0.4% for AGIs $25k-50k, 2.2% for AGIs $50k-75k, 1.8% for AGIs $75k-100k, 10.8% for AGIs over 100k)
Profit/loss from business: +$10,414 (reported on 13.4% of returns)
Here:
+$10,414
State:
+$12,882
(% of AGI for various income ranges: 4.2% for AGIs below $10k, 2.7% for AGIs $10k-25k, 2.0% for AGIs $25k-50k, 3.6% for AGIs $50k-75k, 5.7% for AGIs $75k-100k, 13.6% for AGIs over 100k)
IRA payment deduction: $2,848 (reported on 1.6% of returns)
38008:
$2,848
Tennessee:
$2,934
(% of AGI for various income ranges: 0.1% for AGIs $10k-25k, 0.1% for AGIs $25k-50k, 0.2% for AGIs $50k-75k, 0.3% for AGIs over 100k)
Self-employed pension: $12,083 (reported on 0.3% of returns)
Here:
$12,083
Tennessee:
$16,857
Total itemized deductions: $15,806 (27% of AGI, reported on 14.6% of returns)
Here:
$15,806
State:
$18,035
Here:
27.0% of AGI
State:
19.9% of AGI
(% of AGI for various income ranges: 7.5% for AGIs below $10k, 3.8% for AGIs $10k-25k, 6.9% for AGIs $25k-50k, 9.3% for AGIs $50k-75k, 8.5% for AGIs $75k-100k, 11.7% for AGIs over 100k)
Charity contributions deductions: $4,271 (7% of AGI, reported on 12.6% of returns)
Here:
$4,271
State:
$5,167
Here:
7.2% of AGI
State:
5.3% of AGI
(% of AGI for various income ranges: 0.4% for AGIs below $10k, 0.7% for AGIs $10k-25k, 1.5% for AGIs $25k-50k, 2.5% for AGIs $50k-75k, 2.6% for AGIs $75k-100k, 2.5% for AGIs over 100k)
Total tax: $3,938 (reported on 62.0% of returns)
38008:
$3,938
State:
$7,482
(% of AGI for various income ranges: 2.6% for AGIs below $10k, 2.6% for AGIs $10k-25k, 6.0% for AGIs $25k-50k, 8.9% for AGIs $50k-75k, 11.5% for AGIs $75k-100k, 17.7% for AGIs over 100k)
Earned income credit: $2,017 (reported on 35.0% of returns)
Here:
$2,017
State:
$1,826
Percentage of individuals using paid preparers for their 2004 taxes: 63.5%
Here:
64%
State:
60%
(% for various income ranges: 57.0% for AGIs below $10k, 68.5% for AGIs $10k-25k, 59.3% for AGIs $25k-50k, 63.4% for AGIs $50k-75k, 70.0% for AGIs $75k-100k, 82.3% for AGIs over 100k)
Household received Food Stamps/SNAP in the past 12 months: 648 Household did not receive Food Stamps/SNAP in the past 12 months: 3,199
Women who had a birth in the past 12 months: 105 (43 now married, 59 unmarried) Women who did not have a birth in the past 12 months: 1,564 (572 now married, 991 unmarried)
Housing units in zip code 38008 with a mortgage: 1,390 (84 second mortgage, 85 both second mortgage and home equity loan) Houses without a mortgage: 25
Median monthly owner costs for units with a mortgage: $992 Median monthly owner costs for units without a mortgage: $464
Residents with income below the poverty level in 2022:
This zip code:
15.9%
Whole state:
13.3%
Residents with income below 50% of the poverty level in 2022:
This zip code:
10.3%
Whole state:
7.1%
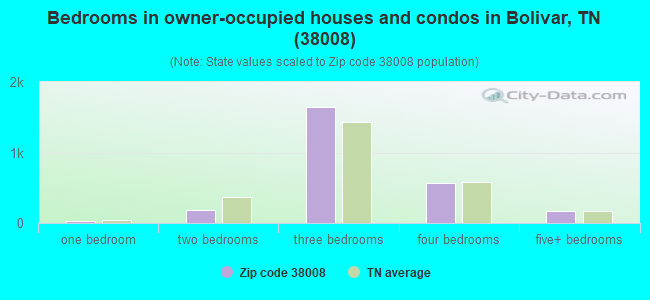
Median number of rooms in houses and condos:
Here:
6.7
State:
6.5
Median number of rooms in apartments:
Here:
4.6
State:
4.4
Notable locations in this zip code not listed on our city pages
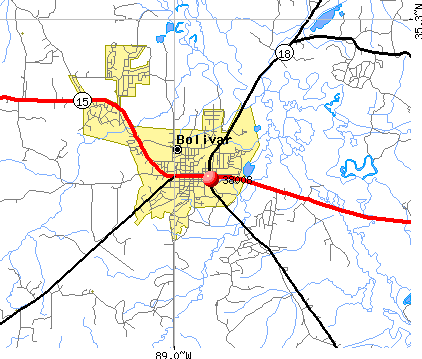
Notable locations in zip code 38008: Hardeman County Golf Course (A), Hardeman County Landfill (B), Hardeman County Jail (C), Hardeman county Courthouse (D), Hardeman County Library (E), Bolivar City Hall (F), Bolivar Fire Department (G), Hardeman County Ambulance Service (H). Display/hide their locations on the map
Churches in zip code 38008 include: Forrest Hill Church (A), Messiah’s Spiritual Body Church (B), Bethelehem Baptist Church (C), Bolivar Church of Christ (D), Bolivar First Baptist Church (E), Dixie Hills Baptist Church (F), Middleburg Baptist Church (G), Oak Hill Baptist Church (H), Saint Marys Catholic Church (I). Display/hide their locations on the map
Cemeteries: Salem Cemetery (1), Union Cemetery (2), Clifft Cemetery (3), Ussery Cemetery (4), Nuckolls Cemetery (5), Oak Hill Cemetery (6), Ruffian Cemetery (7). Display/hide their locations on the map
Lakes and reservoirs: Pirtle Pond (A), Jack Pond (B), Harris Pond (C), Horseshoe Pond (D), Vaughn Pond (E), The Grinnel Pond (F), Otter Pond (G), Cub Creek Lake Number Three (H). Display/hide their locations on the map
Streams, rivers, and creeks: Lane Branch (A), Hamer Creek (B), Grays Creek (C), Dry Branch (D), Deadman Branch (E), Carter Branch (F), Daily Creek (G), Hayes Branch (H), Marshall Creek (I). Display/hide their locations on the map
Parks in zip code 38008 include: North Main Street Historic District (1), Bolivar Courthouse Square Historic District (2), Bills-McNeal Historic District (3). Display/hide their locations on the map
In group quarters: 182 (-1 institutionalized population)
Size of family households: 1,191 2-persons, 381 3-persons, 426 4-persons, 186 5-persons, 9 6-persons, 4 7-or-more-persons
Size of nonfamily households: 1,608 1-person, 18 2-persons, 15 4-persons
589 married couples with children.
732 single-parent households (6 men, 726 women).
99.4% of residents of 38008 zip code speak English at home.
0.1% of residents speak Spanish at home (11% very well, 89% well).
0.3% of residents speak other Indo-European language at home (100% very well).
0.1% of residents speak Asian or Pacific Island language at home (100% very well).
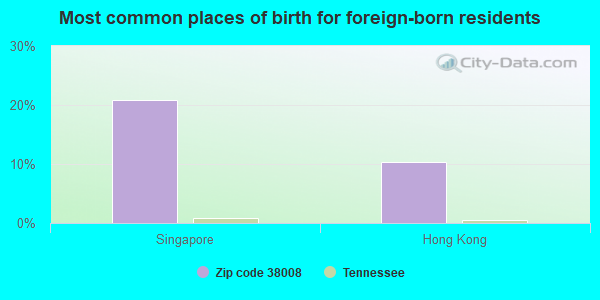
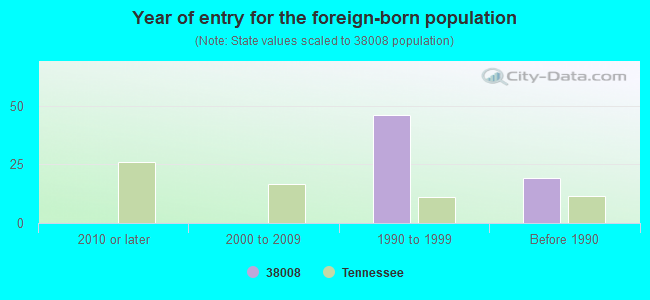
Foreign born population: 47 (0.5%) (71.4% of them are naturalized citizens)
This zip code:
0.5%
Whole state:
5.6%
21%Singapore
10%Hong Kong
15%American
5%Irish
4%English
2%German
1%European
1%Scottish
1%Italian
Year of entry for the foreign-born population
02010 or later
02000 to 2009
461990 to 1999
19Before 1990
Facilities with environmental interests located in this zip code:
ARMIRA CORPORATION (918 MAIN ST. - HWY 18 NORTH in BOLIVAR, TN)
SUPERFUND (Superfund database) (Integrated Compliance Information System) - ICIS-04-1998-0361, FORMAL ENFORCEMENT ACTION (Resource Conservation and Recovery Act (tracking hazardous waste)) Business SIC classification: MANUFACTURING INDUSTRIES
CENTRAL HIGH SCHOOL (313 HARRIS ST in BOLIVAR, TN)
(Geographic Names Information System) (National Center for Education Statistics) - STATE ID-0015 Organizations: HARDEMAN COUNTY SCHOOL DISTRCT (SCHOOL DISTRICT)
BRINT NURSING HOME (214 NORTH WATER STREET in BOLIVAR, TN)
(Resource Conservation and Recovery Act (tracking hazardous waste))
CAMPBELL CLEANERS (212 N WASHINGTON ST in BOLIVAR, TN)
Conditionally Exempt Small Quantity Generators, less than 100 kg/month of hazardous waste (Resource Conservation and Recovery Act (tracking hazardous waste)) - notification Organizations: MARY CAMPBELL (CONTACT/OPERATOR)
, ROBERT CAMPBELL (CONTACT/OWNER)
Housing units lacking complete plumbing facilities: 2.1% Housing units lacking complete kitchen facilities: 4.0%
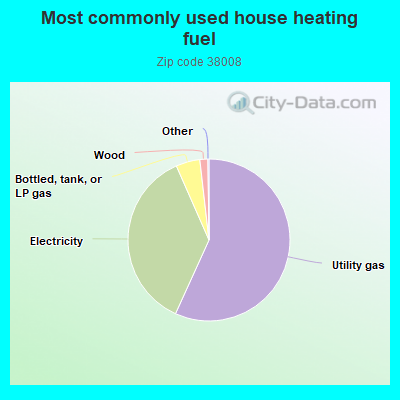
56.8%Utility gas
36.6%Electricity
4.8%Bottled, tank, or LP gas
1.6%Wood
Population in 1990: 10,327. Population change in the 1990s: +252 (+2.4%).
Place of birth for U.S.-born residents:
This state: 6,926
Northeast: 157
Midwest: 286
South: 985
West: 209
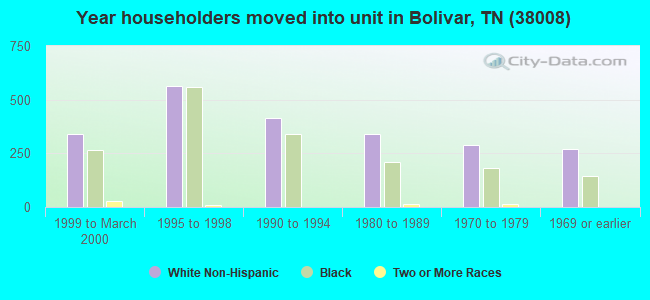
60% of the 38008 zip code residents lived in the same house 5 years ago. Out of people who lived in different houses, 66% lived in this county. Out of people who lived in different counties, 50% lived in Tennessee.
95% of the 38008 zip code residents lived in the same house 1 year ago. Out of people who lived in different houses, 58% moved from this county. Out of people who lived in different houses, 23% moved from different county within same state. Out of people who lived in different houses, 24% moved from different state.
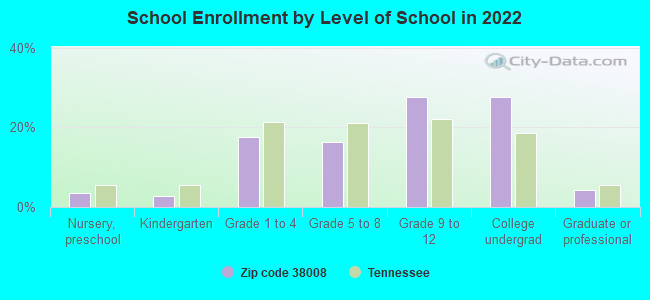
Private vs. public school enrollment:
Students in private schools in grades 1 to 8 (elementary and middle school): 60
Here:
9.4%
Tennessee:
15.0%
Students in private schools in grades 9 to 12 (high school): 43
Here:
8.3%
Tennessee:
16.2%
Students in private undergraduate colleges: 73
Here:
13.9%
Tennessee:
23.5%
Occupation by median earnings in the past 12 months ($)
89,614Architecture and engineering occupations
84,979Transportation occupations
63,678Arts, design, entertainment, sports, and media occupations
58,223Management occupations
56,452Installation, maintenance, and repair occupations
52,696Fire fighting and prevention, and other protective service workers including supervisors
Companies with federal contracts located in this zip code:
RODEWAY INN (916 W MARKET ST in BOLIVAR, TN; small business)
$6,824 with Army for Lodging - Hotel/Motel. Signed on 2004-01-26. Completion date: 2004-01-29.
JIMMERSON DORIS (318 E MARKET STREET in BOLIVAR, TN; small business) : $6,146 in 2 contractsin 2004
$6,145 with Army for Food Items For Resale. Signed on 2004-01-22. Completion date: 2004-01-27.
$1, same as above.Signed on 2004-02-11. Completion date: 2004-01-27.
Top industries in this zip code by the number of employees in 2005:
Health Care and Social Assistance: Psychiatric and Substance Abuse Hospitals (500-999 employees: 1 establishment)
Health Care and Social Assistance: Nursing Care Facilities (100-249: 1, 50-99: 1, 1-4: 1)
Other Services (except Public Administration): Religious Organizations (20-49: 1, 10-19: 1, 5-9: 4, 1-4: 5)
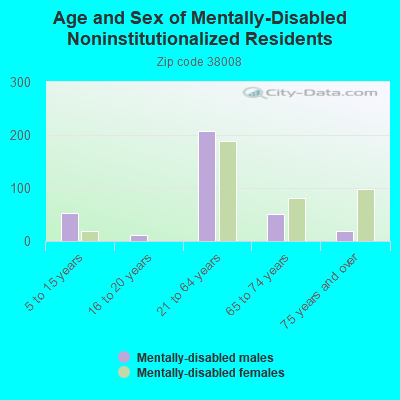
People in group quarters in 2010:
190 people in nursing facilities/skilled-nursing facilities
118 people in mental (psychiatric) hospitals and psychiatric units in other hospitals
9 people in group homes intended for adults
9 people in residential treatment centers for adults
People in group quarters in 2000:
211 people in mental (psychiatric) hospitals or wards
203 people in nursing homes
61 people in local jails and other confinement facilities (including police lockups)
31 people in homes for the mentally retarded
9 people in hospitals/wards and hospices for chronically ill
9 people in other hospitals or wards for chronically ill
Fatal accident statistics in 2014:
Fatal accident count: 1
Vehicles involved in fatal accidents: 2
Fatal accidents caused by drunken drivers: 0
Fatalities: 1
Persons involved in fatal accidents: 7
Pedestrians involved in fatal accidents: 0
Fatal accident statistics in 2012:
Fatal accident count: 1
Vehicles involved in fatal accidents: 1
Fatal accidents caused by drunken drivers: 0
Fatalities: 1
Persons involved in fatal accidents: 1
Pedestrians involved in fatal accidents: 0
2002 - 2018 National Fire Incident Reporting System (NFIRS) incidents
Based on the data from the years 2002 - 2018 the average number of fires per year is 76. The highest number of fires - 104 took place in 2005, and the least - 55 in 2015. The data has a rising trend.
When looking into fire subcategories, the most incidents belonged to: Structure Fires (47.0%), and Outside Fires (28.5%).
Fire incident types reported to NFIRS in Zip Code 38008


 Nearest zip codes: 38381, 38067, 38042, 38052, 38075, 38044.


 Based on the data from the years 2002 - 2018 the average number of fires per year is 76. The highest number of fires - 104 took place in 2005, and the least - 55 in 2015. The data has a rising trend.
 When looking into fire subcategories, the most incidents belonged to: Structure Fires (47.0%), and Outside Fires (28.5%).