Estimated zip code population in 2022: 1,282 Zip code population in 2010: 1,370 Zip code population in 2000: 1,254
Houses and condos: 496 Renter-occupied apartments: 53
% of renters here:
13%
State:
26%
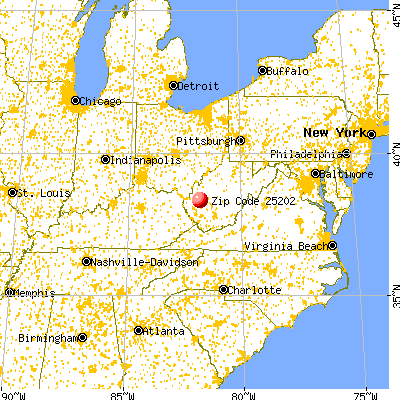
March 2022 cost of living index in zip code 25202: 80.8 (low, U.S. average is 100)
Land area: 11.4 sq. mi. Water area: 0.2 sq. mi.
Population density: 112 people per square mile
(very low).
OSM Map
General Map
Google Map
MSN Map
OSM Map
General Map
Google Map
MSN Map
OSM Map
General Map
Google Map
MSN Map
OSM Map
General Map
Google Map
MSN Map
Please wait while loading the map...
Real estate property taxes paid for housing units in 2022:
This zip code:
0.6% ($878)
West Virginia:
0.5% ($821)
Median real estate property taxes paid for housing units with mortgages in 2022: $903 (0.4%) Median real estate property taxes paid for housing units with no mortgage in 2022: $844 (0.7%)
Estimated median house/condo value in 2022: $151,058
25202:
$151,058
West Virginia:
$155,100
According to our research of West Virginia and other state lists, there were 4 registered sex offenders living in 25202 zip code as of May 24, 2024. The ratio of all residents to sex offenders in zip code 25202 is 310 to 1. The ratio of registered sex offenders to all residents in this zip code is near the state average.
Median resident age:
This zip code:
42.2 years
West Virginia median age:
42.9 years
Average household size:
This zip code:
3.2 people
West Virginia:
2.3 people
Averages for the 2020 tax year for zip code 25202, filed in 2021:
Average Adjusted Gross Income (AGI) in 2020: $50,694 (Individual Income Tax Returns)
Here:
$50,694
State:
$56,292
Salary/wage: $47,351 (reported on 77.8% of returns)
Here:
$47,351
State:
$49,093
(% of AGI for various income ranges: 1108.7% for AGIs below $25k, 2999.3% for AGIs $25k-50k, 5515.0% for AGIs $50k-75k, 9104.0% for AGIs $75k-100k, 16752.0% for AGIs $100k-200k)
Taxable interest for individuals: $1,200 (reported on 20.6% of returns)
This zip code:
$1,200
West Virginia:
$1,141
(% of AGI for various income ranges: 2.7% for AGIs below $25k, 6.4% for AGIs $25k-50k, 5.0% for AGIs $50k-75k, 34.0% for AGIs $75k-100k, 244.0% for AGIs $100k-200k)
Ordinary dividends: $1,140 (reported on 7.9% of returns)
Here:
$1,140
State:
$5,456
(% of AGI for various income ranges: 5.3% for AGIs below $25k, 98.0% for AGIs $75k-100k)
Net capital gain/loss in AGI: +$375 (reported on 6.3% of returns)
Here:
+$375
State:
+$11,656
(% of AGI for various income ranges: 30.0% for AGIs $75k-100k)
Profit/loss from business: +$5,200 (reported on 9.5% of returns)
Here:
+$5,200
State:
+$12,084
(% of AGI for various income ranges: 66.0% for AGIs below $25k, 266.2% for AGIs $50k-75k)
Taxable individual retirement arrangement distribution: $14,940 (reported on 7.9% of returns)
25202:
$14,940
West Virginia:
$15,311
(% of AGI for various income ranges: 164.0% for AGIs below $25k, 626.2% for AGIs $50k-75k)
Earned income credit: $1,760 (reported on 15.9% of returns)
Here:
$1,760
State:
$2,258
(% of AGI for various income ranges: 45.3% for AGIs below $25k, 77.1% for AGIs $25k-50k)
Percentage of individuals using paid preparers for their 2020 taxes: 93.7%
Here:
94%
State:
93%
(% for various income ranges: 90.5% for AGIs below $25k, 94.1% for AGIs $25k-50k, 90.0% for AGIs $50k-75k, 100.0% for AGIs $75k-100k, 100.0% for AGIs $100k-200k)
Averages for the 2012 tax year for zip code 25202, filed in 2013:
Average Adjusted Gross Income (AGI) in 2012: $48,548 (Individual Income Tax Returns)
Here:
$48,548
State:
$48,628
Salary/wage: $44,282 (reported on 85.9% of returns)
Here:
$44,282
State:
$42,328
(% of AGI for various income ranges: 70.2% for AGIs below $25k, 75.1% for AGIs $25k-50k, 83.4% for AGIs $50k-75k, 79.1% for AGIs $75k-100k, 79.2% for AGIs $100k-200k)
Taxable interest for individuals: $661 (reported on 28.1% of returns)
This zip code:
$661
West Virginia:
$1,211
(% of AGI for various income ranges: 0.8% for AGIs below $25k, 0.8% for AGIs $25k-50k, 0.4% for AGIs $50k-75k, 0.2% for AGIs $100k-200k)
Ordinary dividends: $1,600 (reported on 7.8% of returns)
Here:
$1,600
State:
$4,262
Profit/loss from business: +$6,100 (reported on 10.9% of returns)
Here:
+$6,100
State:
+$13,636
Taxable individual retirement arrangement distribution: $13,050 (reported on 6.2% of returns)
25202:
$13,050
West Virginia:
$11,787
Total itemized deductions: $18,667 (19% of AGI, reported on 18.8% of returns)
Here:
$18,667
State:
$21,148
Here:
19.1% of AGI
State:
18.1% of AGI
(% of AGI for various income ranges: 7.6% for AGIs $25k-50k, 6.1% for AGIs $50k-75k, 6.7% for AGIs $75k-100k, 10.2% for AGIs $100k-200k)
Charity contributions: $4,862 (reported on 12.5% of returns)
Here:
$4,862
State:
$4,508
Taxes paid: $6,175 (reported on 18.8% of returns)
25202:
$6,175
State:
$8,103
(% of AGI for various income ranges: 1.4% for AGIs $25k-50k, 1.5% for AGIs $50k-75k, 2.1% for AGIs $75k-100k, 4.5% for AGIs $100k-200k)
Earned income credit: $2,192 (reported on 18.8% of returns)
Here:
$2,192
State:
$2,140
(% of AGI for various income ranges: 6.7% for AGIs below $25k, 1.0% for AGIs $25k-50k)
Percentage of individuals using paid preparers for their 2012 taxes: 45.3%
Here:
45%
State:
49%
(% for various income ranges: 41.7% for AGIs below $25k, 43.8% for AGIs $25k-50k, 50.0% for AGIs $50k-75k, 42.9% for AGIs $75k-100k, 57.1% for AGIs $100k-200k)
Averages for the 2004 tax year for zip code 25202, filed in 2005:
Average Adjusted Gross Income (AGI) in 2004: $37,400 (Individual Income Tax Returns)
Here:
$37,400
State:
$37,498
Salary/wage: $35,769 (reported on 87.5% of returns)
Here:
$35,769
State:
$33,645
(% of AGI for various income ranges: 79.2% for AGIs below $10k, 71.9% for AGIs $10k-25k, 83.0% for AGIs $25k-50k, 88.1% for AGIs $50k-75k, 86.8% for AGIs $75k-100k, 83.5% for AGIs over 100k)
Taxable interest for individuals: $946 (reported on 35.1% of returns)
This zip code:
$946
West Virginia:
$1,465
(% of AGI for various income ranges: 1.5% for AGIs below $10k, 3.1% for AGIs $10k-25k, 0.7% for AGIs $25k-50k, 0.3% for AGIs $50k-75k, 0.3% for AGIs $75k-100k, 0.9% for AGIs over 100k)
Taxable dividends: $812 (reported on 10.9% of returns)
Here:
$812
State:
$2,913
(% of AGI for various income ranges: 0.5% for AGIs $10k-25k, 0.1% for AGIs $25k-50k, 0.2% for AGIs $50k-75k, 0.4% for AGIs $75k-100k)
Profit/loss from business: +$4,550 (reported on 9.5% of returns)
Here:
+$4,550
State:
+$11,074
Total itemized deductions: $13,452 (19% of AGI, reported on 19.9% of returns)
Here:
$13,452
State:
$16,976
Here:
18.9% of AGI
State:
19.0% of AGI
(% of AGI for various income ranges: 3.6% for AGIs $10k-25k, 5.8% for AGIs $25k-50k, 7.4% for AGIs $50k-75k, 9.8% for AGIs $75k-100k, 10.4% for AGIs over 100k)
Charity contributions deductions: $2,589 (3% of AGI, reported on 15.0% of returns)
Here:
$2,589
State:
$3,529
Here:
3.4% of AGI
State:
3.7% of AGI
(% of AGI for various income ranges: 0.7% for AGIs $25k-50k, 0.7% for AGIs $50k-75k, 2.5% for AGIs $75k-100k, 1.6% for AGIs over 100k)
Total tax: $4,412 (reported on 74.1% of returns)
25202:
$4,412
State:
$5,372
(% of AGI for various income ranges: 1.9% for AGIs below $10k, 3.8% for AGIs $10k-25k, 6.5% for AGIs $25k-50k, 8.7% for AGIs $50k-75k, 10.8% for AGIs $75k-100k, 17.3% for AGIs over 100k)
Earned income credit: $1,755 (reported on 15.5% of returns)
Here:
$1,755
State:
$1,662
Percentage of individuals using paid preparers for their 2004 taxes: 48.3%
Here:
48%
State:
55%
(% for various income ranges: 47.7% for AGIs below $10k, 52.4% for AGIs $10k-25k, 47.8% for AGIs $25k-50k, 45.9% for AGIs $50k-75k, 56.4% for AGIs $75k-100k)
Household received Food Stamps/SNAP in the past 12 months: 75 Household did not receive Food Stamps/SNAP in the past 12 months: 331
Women who did not have a birth in the past 12 months: 352 (169 now married, 182 unmarried)
Housing units in zip code 25202 with a mortgage: 150 (5 second mortgage, 5 both second mortgage and home equity loan) Median monthly owner costs for units with a mortgage: $1,450 Median monthly owner costs for units without a mortgage: $451
Residents with income below the poverty level in 2022:
This zip code:
8.0%
Whole state:
17.9%
Residents with income below 50% of the poverty level in 2022:
This zip code:
6.0%
Whole state:
9.7%
Median number of rooms in houses and condos:
Here:
7.0
State:
6.5
Notable locations in this zip code not listed on our city pages
Streams, rivers, and creeks: Rocky Run (A), Mannens Branch (B), Mahone Branch (C), Island Creek (D), Falls Creek (E), Boardtree Run (F). Display/hide their locations on the map
Size of family households: 110 2-persons, 26 3-persons, 157 4-persons, 30 5-persons, 11 6-persons
Size of nonfamily households: 61 1-person
253 married couples with children.
14 single-parent households (14 women).
99.6% of residents of 25202 zip code speak English at home.
Foreign born population: 25 (2.0%) (18.3% of them are naturalized citizens)
This zip code:
2.0%
Whole state:
1.8%
25%Sweden
25%United Kingdom, excluding England and Scotland
17%Singapore
46%American
17%Irish
13%English
3%French
2%British
2%German
Year of entry for the foreign-born population
252010 or later
02000 to 2009
01990 to 1999
0Before 1990
Facilities with environmental interests located in this zip code:
ANDREWS HEIGHTS ELEMENTARY (COAL RIVER ROAD in TORNADO, WV)
ENFORCEMENT/COMPLIANCE ACTIVITY (Integrated Compliance Information System) COMPLIANCE ACTIVITY (Tracking inspections of insecticide, fungicide, and rodenticide, and toxic substances) (National Center for Education Statistics) - STATE ID-39203 National Pollutant Discharge Elimination System NON-MAJOR (Tracking pollutant discharge elimination systems) - permit Business SIC classification: SEWERAGE SYSTEMS; ELEMENTARY AND SECONDARY SCHOOLS Organizations: KANAWHA CNTY BD OF ED (CONTACT/OWNER)
, KANAWHA COUNTY SCHOOL DISTRICT (SCHOOL DISTRICT)
Alternative names: ANDREWS HEIGHTS ELEMENTARY SCHOOL, ANDREWS HGTS ELEM, KANAWHA CNTY BD OF ED
BIG BEND SEWER SYSTEM (BIG BEND SUBDIVISION in TORNADO, WV)
National Pollutant Discharge Elimination System NON-MAJOR (Tracking pollutant discharge elimination systems) - permit Business SIC classification: SEWERAGE SYSTEMS Organizations: WITT, MAYFORD G (CONTACT/OWNER)
Alternative names: MAYFORD G WITT, WITT, MAYFORD G
Housing units lacking complete plumbing facilities: 5.1%
59.8%Electricity
23.2%Utility gas
17.6%Wood
Population in 1990: 1,500.
Place of birth for U.S.-born residents:
This state: 1,127
Northeast: 6
Midwest: 35
South: 47
West: 24
70% of the 25202 zip code residents lived in the same house 5 years ago. Out of people who lived in different houses, 74% lived in this county. Out of people who lived in different counties, 50% lived in West Virginia.
93% of the 25202 zip code residents lived in the same house 1 year ago. Out of people who lived in different houses, 74% moved from this county. Out of people who lived in different houses, 5% moved from different county within same state. Out of people who lived in different houses, 16% moved from different state.
Private vs. public school enrollment:
Students in private schools in grades 1 to 8 (elementary and middle school): 10
Here:
7.3%
West Virginia:
12.2%
Students in private schools in grades 9 to 12 (high school):
Here:
0.0%
West Virginia:
8.8%
Students in private undergraduate colleges: 12
Here:
40.5%
West Virginia:
17.3%
Occupation by median earnings in the past 12 months ($)
105,566Production occupations
73,993Health diagnosing and treating practitioners and other technical occupations
54,863Installation, maintenance, and repair occupations
38,781Business and financial operations occupations
33,080Sales and related occupations
32,704Material moving occupations
Companies with federal contracts located in this zip code:
TBM CONSTRUCTION CO (105 2ND AVE in TORNADO, WV; small business) : $0 in 2 contractsin 2002
$5,839 with U.S. Army Corps of Engineers - civil program financing only for Prefabricated and Portable Buildings. Signed on 2002-04-09. Completion date: 2002-05-01.
-$5,839, same as above.Signed on 2002-07-10. Completion date: 2002-05-01.
Top industries in this zip code by the number of employees in 2005:
Other Services (except Public Administration): Religious Organizations (5-9 employees: 1 establishment, 1-4 employees: 1 establishment)
Construction: Commercial and Institutional Building Construction (5-9: 1)
Construction: Residential Remodelers (1-4: 3)
Construction: Electrical Contractors (1-4: 2)
Wholesale Trade: Construction and Mining (except Oil Well) Machinery and Equipment Merchant Wholesalers (1-4: 1)
Home Mortgage Disclosure Act Aggregated Statistics For Year 2009 (Based on 4 partial tracts)
A) FHA, FSA/RHS & VA Home Purchase Loans
B) Conventional Home Purchase Loans
C) Refinancings
D) Home Improvement Loans
F) Non-occupant Loans on < 5 Family Dwellings (A B C & D)
G) Loans On Manufactured Home Dwelling (A B C & D)
Number
Average Value
Number
Average Value
Number
Average Value
Number
Average Value
Number
Average Value
Number
Average Value
LOANS ORIGINATED
16
$104,385
12
$124,160
48
$109,279
6
$36,185
3
$54,787
1
$60,210
APPLICATIONS APPROVED, NOT ACCEPTED
2
$84,590
1
$209,700
3
$64,920
1
$10,120
0
$0
2
$43,900
APPLICATIONS DENIED
3
$98,587
5
$62,364
21
$115,504
6
$20,368
3
$42,240
3
$52,850
APPLICATIONS WITHDRAWN
2
$105,830
1
$85,540
12
$116,029
1
$54,590
0
$0
0
$0
FILES CLOSED FOR INCOMPLETENESS
1
$70,370
0
$0
3
$96,090
0
$0
0
$0
0
$0
Aggregated Statistics For Year 2008 (Based on 4 partial tracts)
A) FHA, FSA/RHS & VA Home Purchase Loans
B) Conventional Home Purchase Loans
C) Refinancings
D) Home Improvement Loans
E) Loans on Dwellings For 5+ Families
F) Non-occupant Loans on < 5 Family Dwellings (A B C & D)
G) Loans On Manufactured Home Dwelling (A B C & D)
Number
Average Value
Number
Average Value
Number
Average Value
Number
Average Value
Number
Average Value
Number
Average Value
Number
Average Value
LOANS ORIGINATED
10
$106,405
24
$119,398
39
$103,974
8
$47,636
1
$262,430
5
$44,574
2
$44,920
APPLICATIONS APPROVED, NOT ACCEPTED
3
$99,503
4
$98,705
5
$93,212
2
$49,550
0
$0
0
$0
2
$40,975
APPLICATIONS DENIED
2
$121,545
8
$74,134
34
$91,516
8
$41,411
0
$0
3
$53,427
6
$38,905
APPLICATIONS WITHDRAWN
1
$164,320
2
$96,505
13
$112,868
0
$0
0
$0
1
$35,350
1
$35,830
FILES CLOSED FOR INCOMPLETENESS
1
$90,710
1
$60,360
2
$101,115
0
$0
0
$0
0
$0
0
$0
Aggregated Statistics For Year 2007 (Based on 4 partial tracts)
A) FHA, FSA/RHS & VA Home Purchase Loans
B) Conventional Home Purchase Loans
C) Refinancings
D) Home Improvement Loans
E) Loans on Dwellings For 5+ Families
F) Non-occupant Loans on < 5 Family Dwellings (A B C & D)
G) Loans On Manufactured Home Dwelling (A B C & D)
Number
Average Value
Number
Average Value
Number
Average Value
Number
Average Value
Number
Average Value
Number
Average Value
Number
Average Value
LOANS ORIGINATED
4
$115,910
31
$109,241
46
$99,452
13
$49,092
1
$145,580
4
$81,800
5
$57,738
APPLICATIONS APPROVED, NOT ACCEPTED
0
$0
5
$97,848
9
$88,482
1
$62,890
0
$0
1
$30,500
3
$68,930
APPLICATIONS DENIED
2
$122,975
7
$108,531
35
$91,498
12
$33,868
0
$0
2
$24,525
4
$76,385
APPLICATIONS WITHDRAWN
0
$0
2
$116,230
13
$99,918
1
$56,010
0
$0
1
$29,700
1
$92,130
FILES CLOSED FOR INCOMPLETENESS
0
$0
2
$100,290
3
$113,253
0
$0
0
$0
0
$0
0
$0
Aggregated Statistics For Year 2006 (Based on 4 partial tracts)
A) FHA, FSA/RHS & VA Home Purchase Loans
B) Conventional Home Purchase Loans
C) Refinancings
D) Home Improvement Loans
F) Non-occupant Loans on < 5 Family Dwellings (A B C & D)
G) Loans On Manufactured Home Dwelling (A B C & D)
Number
Average Value
Number
Average Value
Number
Average Value
Number
Average Value
Number
Average Value
Number
Average Value
LOANS ORIGINATED
7
$95,879
38
$98,286
52
$78,070
15
$40,362
5
$78,606
9
$42,126
APPLICATIONS APPROVED, NOT ACCEPTED
1
$25,670
6
$74,500
12
$73,330
2
$25,745
1
$77,100
4
$64,668
APPLICATIONS DENIED
2
$87,550
18
$63,249
37
$81,838
13
$43,945
2
$38,155
14
$54,104
APPLICATIONS WITHDRAWN
2
$86,010
6
$94,800
16
$89,905
2
$43,740
0
$0
1
$24,400
FILES CLOSED FOR INCOMPLETENESS
0
$0
2
$133,820
4
$104,895
0
$0
0
$0
0
$0
Aggregated Statistics For Year 2005 (Based on 4 partial tracts)
A) FHA, FSA/RHS & VA Home Purchase Loans
B) Conventional Home Purchase Loans
C) Refinancings
D) Home Improvement Loans
F) Non-occupant Loans on < 5 Family Dwellings (A B C & D)
G) Loans On Manufactured Home Dwelling (A B C & D)
Number
Average Value
Number
Average Value
Number
Average Value
Number
Average Value
Number
Average Value
Number
Average Value
LOANS ORIGINATED
7
$112,621
37
$94,453
63
$85,013
12
$27,718
7
$73,486
8
$57,175
APPLICATIONS APPROVED, NOT ACCEPTED
0
$0
8
$63,708
10
$78,066
3
$26,607
1
$51,650
3
$42,797
APPLICATIONS DENIED
2
$69,990
16
$69,378
43
$79,944
18
$24,760
1
$69,390
15
$48,203
APPLICATIONS WITHDRAWN
1
$112,330
8
$104,465
14
$98,611
4
$76,430
2
$72,170
2
$66,665
FILES CLOSED FOR INCOMPLETENESS
0
$0
3
$108,943
2
$107,760
0
$0
1
$41,440
0
$0
Aggregated Statistics For Year 2004 (Based on 4 partial tracts)
A) FHA, FSA/RHS & VA Home Purchase Loans
B) Conventional Home Purchase Loans
C) Refinancings
D) Home Improvement Loans
F) Non-occupant Loans on < 5 Family Dwellings (A B C & D)
G) Loans On Manufactured Home Dwelling (A B C & D)
Number
Average Value
Number
Average Value
Number
Average Value
Number
Average Value
Number
Average Value
Number
Average Value
LOANS ORIGINATED
5
$95,690
33
$104,372
69
$74,319
17
$26,922
6
$54,000
5
$55,580
APPLICATIONS APPROVED, NOT ACCEPTED
1
$80,230
4
$103,160
13
$76,268
4
$24,028
1
$81,140
2
$48,010
APPLICATIONS DENIED
1
$115,630
21
$59,488
44
$74,382
14
$21,399
3
$36,140
15
$46,825
APPLICATIONS WITHDRAWN
1
$119,120
3
$147,627
22
$90,812
2
$38,035
0
$0
2
$52,160
FILES CLOSED FOR INCOMPLETENESS
1
$73,280
4
$96,465
5
$74,724
1
$47,770
0
$0
0
$0
Aggregated Statistics For Year 2003 (Based on 4 partial tracts)
A) FHA, FSA/RHS & VA Home Purchase Loans
B) Conventional Home Purchase Loans
C) Refinancings
D) Home Improvement Loans
F) Non-occupant Loans on < 5 Family Dwellings (A B C & D)
Number
Average Value
Number
Average Value
Number
Average Value
Number
Average Value
Number
Average Value
LOANS ORIGINATED
4
$100,632
35
$93,370
100
$81,746
16
$20,582
7
$83,664
APPLICATIONS APPROVED, NOT ACCEPTED
0
$0
6
$72,305
20
$56,342
2
$37,445
1
$30,460
APPLICATIONS DENIED
2
$59,235
17
$67,572
52
$73,383
12
$9,722
5
$66,302
APPLICATIONS WITHDRAWN
0
$0
5
$101,474
28
$79,183
1
$9,040
1
$57,700
FILES CLOSED FOR INCOMPLETENESS
0
$0
2
$64,830
7
$98,421
0
$0
1
$44,870
Aggregated Statistics For Year 2002 (Based on 4 partial tracts)
A) FHA, FSA/RHS & VA Home Purchase Loans
B) Conventional Home Purchase Loans
C) Refinancings
D) Home Improvement Loans
F) Non-occupant Loans on < 5 Family Dwellings (A B C & D)
Number
Average Value
Number
Average Value
Number
Average Value
Number
Average Value
Number
Average Value
LOANS ORIGINATED
6
$89,012
39
$75,043
92
$77,810
19
$16,053
7
$35,303
APPLICATIONS APPROVED, NOT ACCEPTED
0
$0
8
$69,804
15
$59,386
3
$14,557
1
$65,340
APPLICATIONS DENIED
2
$59,880
16
$52,815
35
$64,559
11
$7,901
2
$43,035
APPLICATIONS WITHDRAWN
1
$70,060
5
$77,058
21
$72,607
1
$8,920
1
$70,670
FILES CLOSED FOR INCOMPLETENESS
0
$0
3
$86,107
5
$84,932
0
$0
1
$30,630
Aggregated Statistics For Year 2001 (Based on 4 partial tracts)
A) FHA, FSA/RHS & VA Home Purchase Loans
B) Conventional Home Purchase Loans
C) Refinancings
D) Home Improvement Loans
F) Non-occupant Loans on < 5 Family Dwellings (A B C & D)
Number
Average Value
Number
Average Value
Number
Average Value
Number
Average Value
Number
Average Value
LOANS ORIGINATED
8
$85,289
31
$78,676
70
$77,774
12
$18,765
4
$52,652
APPLICATIONS APPROVED, NOT ACCEPTED
1
$56,170
10
$44,745
16
$70,555
1
$23,590
2
$22,765
APPLICATIONS DENIED
1
$98,990
27
$45,706
35
$69,231
9
$13,222
3
$18,517
APPLICATIONS WITHDRAWN
0
$0
4
$74,680
20
$68,733
1
$29,070
1
$26,470
FILES CLOSED FOR INCOMPLETENESS
0
$0
1
$113,840
3
$157,373
0
$0
0
$0
Aggregated Statistics For Year 2000 (Based on 4 partial tracts)
A) FHA, FSA/RHS & VA Home Purchase Loans
B) Conventional Home Purchase Loans
C) Refinancings
D) Home Improvement Loans
F) Non-occupant Loans on < 5 Family Dwellings (A B C & D)
Number
Average Value
Number
Average Value
Number
Average Value
Number
Average Value
Number
Average Value
LOANS ORIGINATED
8
$70,052
34
$62,792
34
$60,698
16
$10,839
4
$28,552
APPLICATIONS APPROVED, NOT ACCEPTED
6
$39,733
12
$51,941
15
$44,986
4
$27,585
1
$69,080
APPLICATIONS DENIED
4
$53,610
36
$41,981
38
$62,119
7
$15,151
2
$26,310
APPLICATIONS WITHDRAWN
2
$41,315
5
$84,212
14
$63,470
1
$28,560
0
$0
FILES CLOSED FOR INCOMPLETENESS
0
$0
1
$113,810
3
$75,800
0
$0
0
$0
Aggregated Statistics For Year 1999 (Based on 2 partial tracts)
A) FHA, FSA/RHS & VA Home Purchase Loans
B) Conventional Home Purchase Loans
C) Refinancings
D) Home Improvement Loans
F) Non-occupant Loans on < 5 Family Dwellings (A B C & D)
Detailed PMIC statistics for the following Tracts:0132.00
, 0137.00
2003 - 2018 National Fire Incident Reporting System (NFIRS) incidents
According to the data from the years 2003 - 2018 the average number of fires per year is 10. The highest number of fires - 24 took place in 2012, and the least - 0 in 2005. The data has an increasing trend.
When looking into fire subcategories, the most incidents belonged to: Structure Fires (61.0%), and Outside Fires (21.4%).
Fire incident types reported to NFIRS in Zip Code 25202


 Nearest zip codes: 25177, 25564, 25003, 25567, 25143, 25309.


 According to the data from the years 2003 - 2018 the average number of fires per year is 10. The highest number of fires - 24 took place in 2012, and the least - 0 in 2005. The data has an increasing trend.
 When looking into fire subcategories, the most incidents belonged to: Structure Fires (61.0%), and Outside Fires (21.4%).