Estimated zip code population in 2022: 26,265 Zip code population in 2010: 21,031 Zip code population in 2000: 14,713
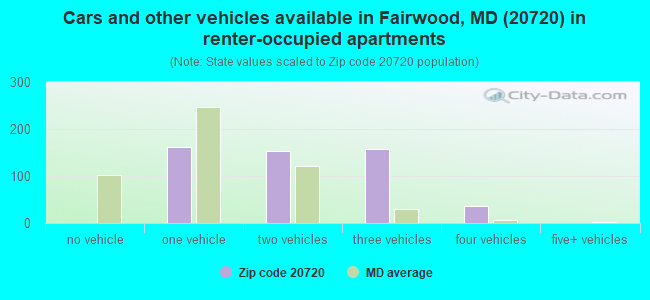
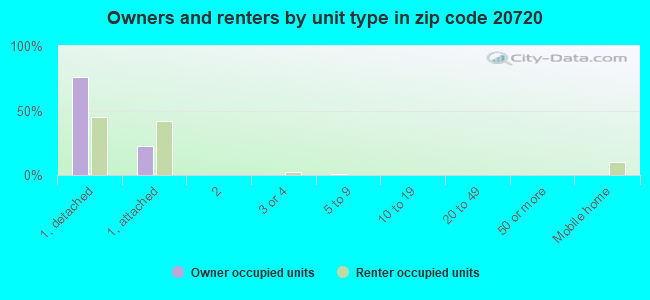
Houses and condos: 8,535 Renter-occupied apartments: 514
% of renters here:
6%
State:
32%
March 2022 cost of living index in zip code 20720: 164.4 (very high, U.S. average is 100)
Land area: 11.2 sq. mi. Water area: 0.1 sq. mi.
Population density: 2,352 people per square mile
(low).
OSM Map
General Map
Google Map
MSN Map
OSM Map
General Map
Google Map
MSN Map
OSM Map
General Map
Google Map
MSN Map
OSM Map
General Map
Google Map
MSN Map
Please wait while loading the map...
Real estate property taxes paid for housing units in 2022:
This zip code:
1.1% ($5,851)
Maryland:
0.9% ($3,777)
Median real estate property taxes paid for housing units with mortgages in 2022: $5,922 (1.1%) Median real estate property taxes paid for housing units with no mortgage in 2022: $5,385 (1.0%)
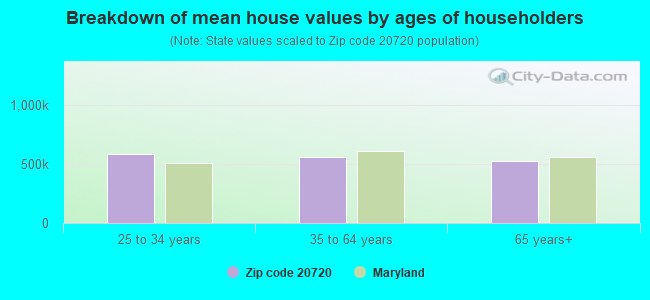
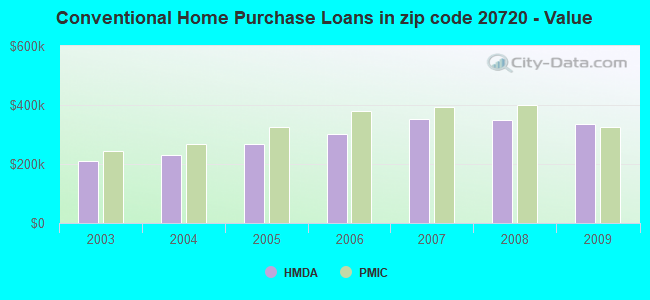
Estimated median house/condo value in 2022: $521,035
20720:
$521,035
Maryland:
$398,100
According to our research of Maryland and other state lists, there were 9 registered sex offenders living in 20720 zip code as of May 09, 2024. The ratio of all residents to sex offenders in zip code 20720 is 2,529 to 1. The ratio of registered sex offenders to all residents in this zip code is much lower than the state average.
Median resident age:
This zip code:
41.5 years
Maryland median age:
39.7 years
Average household size:
This zip code:
3.1 people
Maryland:
2.5 people
Averages for the 2020 tax year for zip code 20720, filed in 2021:
Average Adjusted Gross Income (AGI) in 2020: $93,243 (Individual Income Tax Returns)
Here:
$93,243
State:
$86,905
Salary/wage: $88,022 (reported on 84.1% of returns)
Here:
$88,022
State:
$73,953
(% of AGI for various income ranges: 1127.1% for AGIs below $25k, 3952.4% for AGIs $25k-50k, 7162.9% for AGIs $50k-75k, 10845.5% for AGIs $75k-100k, 20886.8% for AGIs $100k-200k, 71712.1% for AGIs over 200k)
Taxable interest for individuals: $642 (reported on 35.9% of returns)
This zip code:
$642
Maryland:
$1,528
(% of AGI for various income ranges: 8.5% for AGIs below $25k, 10.9% for AGIs $25k-50k, 23.3% for AGIs $50k-75k, 40.6% for AGIs $75k-100k, 58.4% for AGIs $100k-200k, 213.5% for AGIs over 200k)
Ordinary dividends: $3,018 (reported on 15.5% of returns)
Here:
$3,018
State:
$8,028
(% of AGI for various income ranges: 9.4% for AGIs below $25k, 12.7% for AGIs $25k-50k, 21.2% for AGIs $50k-75k, 65.3% for AGIs $75k-100k, 107.8% for AGIs $100k-200k, 666.0% for AGIs over 200k)
Net capital gain/loss in AGI: +$11,046 (reported on 15.4% of returns)
Here:
+$11,046
State:
+$25,238
(% of AGI for various income ranges: 5.0% for AGIs below $25k, 10.7% for AGIs $25k-50k, 27.5% for AGIs $50k-75k, 92.6% for AGIs $75k-100k, 195.3% for AGIs $100k-200k, 3997.7% for AGIs over 200k)
Profit/loss from business: +$4,118 (reported on 27.3% of returns)
Here:
+$4,118
State:
+$11,398
(% of AGI for various income ranges: 147.9% for AGIs below $25k, 104.5% for AGIs $25k-50k, 115.6% for AGIs $75k-100k, 109.5% for AGIs $100k-200k, 1560.7% for AGIs over 200k)
Taxable individual retirement arrangement distribution: $18,412 (reported on 5.9% of returns)
20720:
$18,412
Maryland:
$20,944
(% of AGI for various income ranges: 24.3% for AGIs below $25k, 40.7% for AGIs $25k-50k, 119.6% for AGIs $50k-75k, 185.2% for AGIs $75k-100k, 312.1% for AGIs $100k-200k, 976.0% for AGIs over 200k)
Self-employed (Keogh) retirement plans: $21,943 (reported on 0.5% of returns)
20720:
$21,943
Maryland:
$29,558
(% of AGI for various income ranges: 10.6% for AGIs $100k-200k, 311.2% for AGIs over 200k)
Total itemized deductions: $32,306 (reported on 39.5% of returns)
Here:
$32,306
State:
$30,672
(% of AGI for various income ranges: 131.5% for AGIs below $25k, 501.1% for AGIs $25k-50k, 1430.3% for AGIs $50k-75k, 2594.5% for AGIs $75k-100k, 3861.6% for AGIs $100k-200k, 10069.8% for AGIs over 200k)
Charity contributions: $10,319 (reported on 34.8% of returns)
Here:
$10,319
State:
$9,065
(% of AGI for various income ranges: 15.0% for AGIs below $25k, 109.5% for AGIs $25k-50k, 352.5% for AGIs $50k-75k, 659.5% for AGIs $75k-100k, 1081.6% for AGIs $100k-200k, 3398.4% for AGIs over 200k)
Taxes paid: $8,853 (reported on 39.3% of returns)
20720:
$8,853
State:
$8,475
(% of AGI for various income ranges: 31.0% for AGIs below $25k, 117.9% for AGIs $25k-50k, 411.0% for AGIs $50k-75k, 790.3% for AGIs $75k-100k, 1132.9% for AGIs $100k-200k, 2268.4% for AGIs over 200k)
Earned income credit: $1,935 (reported on 10.0% of returns)
Here:
$1,935
State:
$2,151
(% of AGI for various income ranges: 74.8% for AGIs below $25k, 55.6% for AGIs $25k-50k)
Percentage of individuals using paid preparers for their 2020 taxes: 89.1%
Here:
89%
State:
90%
(% for various income ranges: 89.7% for AGIs below $25k, 89.4% for AGIs $25k-50k, 88.3% for AGIs $50k-75k, 88.2% for AGIs $75k-100k, 88.8% for AGIs $100k-200k, 90.0% for AGIs over 200k)
Averages for the 2012 tax year for zip code 20720, filed in 2013:
Average Adjusted Gross Income (AGI) in 2012: $85,176 (Individual Income Tax Returns)
Here:
$85,176
State:
$72,703
Salary/wage: $79,494 (reported on 88.6% of returns)
Here:
$79,494
State:
$62,228
(% of AGI for various income ranges: 79.8% for AGIs below $25k, 85.1% for AGIs $25k-50k, 85.3% for AGIs $50k-75k, 83.2% for AGIs $75k-100k, 85.7% for AGIs $100k-200k, 75.9% for AGIs over 200k)
Taxable interest for individuals: $565 (reported on 42.8% of returns)
This zip code:
$565
Maryland:
$1,413
(% of AGI for various income ranges: 0.7% for AGIs below $25k, 0.3% for AGIs $25k-50k, 0.3% for AGIs $50k-75k, 0.2% for AGIs $75k-100k, 0.2% for AGIs $100k-200k, 0.3% for AGIs over 200k)
Ordinary dividends: $3,216 (reported on 17.5% of returns)
Here:
$3,216
State:
$6,933
(% of AGI for various income ranges: 0.6% for AGIs below $25k, 0.4% for AGIs $25k-50k, 0.4% for AGIs $50k-75k, 0.5% for AGIs $75k-100k, 0.4% for AGIs $100k-200k, 1.4% for AGIs over 200k)
Net capital gain/loss in AGI: +$2,794 (reported on 12.5% of returns)
Here:
+$2,794
State:
+$14,830
(% of AGI for various income ranges: 0.2% for AGIs $75k-100k, 0.2% for AGIs $100k-200k, 1.3% for AGIs over 200k)
Profit/loss from business: +$7,818 (reported on 22.9% of returns)
Here:
+$7,818
State:
+$12,606
(% of AGI for various income ranges: 11.1% for AGIs below $25k, 2.0% for AGIs $25k-50k, 0.2% for AGIs $50k-75k, 1.2% for AGIs $75k-100k, 1.4% for AGIs $100k-200k, 3.4% for AGIs over 200k)
Taxable individual retirement arrangement distribution: $15,869 (reported on 6.1% of returns)
20720:
$15,869
Maryland:
$17,065
(% of AGI for various income ranges: 1.2% for AGIs below $25k, 1.3% for AGIs $25k-50k, 1.4% for AGIs $50k-75k, 1.0% for AGIs $75k-100k, 1.0% for AGIs $100k-200k, 1.2% for AGIs over 200k)
Self-employment retirement plans: $17,275 (reported on 0.7% of returns)
20720:
$17,275
Maryland:
$24,439
(% of AGI for various income ranges: 0.4% for AGIs $25k-50k, 0.3% for AGIs over 200k)
Total itemized deductions: $31,883 (27% of AGI, reported on 64.7% of returns)
Here:
$31,883
State:
$27,886
Here:
27.3% of AGI
State:
22.8% of AGI
(% of AGI for various income ranges: 16.5% for AGIs below $25k, 22.2% for AGIs $25k-50k, 28.6% for AGIs $50k-75k, 28.1% for AGIs $75k-100k, 25.5% for AGIs $100k-200k, 19.8% for AGIs over 200k)
Charity contributions: $5,720 (reported on 57.2% of returns)
Here:
$5,720
State:
$4,452
(% of AGI for various income ranges: 1.7% for AGIs below $25k, 3.7% for AGIs $25k-50k, 4.6% for AGIs $50k-75k, 4.6% for AGIs $75k-100k, 4.0% for AGIs $100k-200k, 3.1% for AGIs over 200k)
Taxes paid: $11,891 (reported on 64.4% of returns)
20720:
$11,891
State:
$11,690
(% of AGI for various income ranges: 3.6% for AGIs below $25k, 5.4% for AGIs $25k-50k, 8.7% for AGIs $50k-75k, 9.6% for AGIs $75k-100k, 9.8% for AGIs $100k-200k, 9.1% for AGIs over 200k)
Earned income credit: $2,107 (reported on 9.6% of returns)
Here:
$2,107
State:
$2,199
(% of AGI for various income ranges: 5.7% for AGIs below $25k, 0.8% for AGIs $25k-50k)
Percentage of individuals using paid preparers for their 2012 taxes: 52.5%
Here:
53%
State:
52%
(% for various income ranges: 48.0% for AGIs below $25k, 50.3% for AGIs $25k-50k, 56.0% for AGIs $50k-75k, 56.3% for AGIs $75k-100k, 53.8% for AGIs $100k-200k, 54.2% for AGIs over 200k)
Averages for the 2004 tax year for zip code 20720, filed in 2005:
Average Adjusted Gross Income (AGI) in 2004: $71,735 (Individual Income Tax Returns)
Here:
$71,735
State:
$60,339
Salary/wage: $68,856 (reported on 90.9% of returns)
Here:
$68,856
State:
$52,211
(% of AGI for various income ranges: 115.9% for AGIs below $10k, 83.8% for AGIs $10k-25k, 88.2% for AGIs $25k-50k, 89.1% for AGIs $50k-75k, 90.3% for AGIs $75k-100k, 85.4% for AGIs over 100k)
Taxable interest for individuals: $850 (reported on 54.1% of returns)
This zip code:
$850
Maryland:
$1,701
(% of AGI for various income ranges: 3.9% for AGIs below $10k, 0.7% for AGIs $10k-25k, 0.6% for AGIs $25k-50k, 0.6% for AGIs $50k-75k, 0.6% for AGIs $75k-100k, 0.6% for AGIs over 100k)
Taxable dividends: $1,355 (reported on 23.5% of returns)
Here:
$1,355
State:
$4,235
(% of AGI for various income ranges: 1.1% for AGIs below $10k, 0.7% for AGIs $10k-25k, 0.4% for AGIs $25k-50k, 0.4% for AGIs $50k-75k, 0.3% for AGIs $75k-100k, 0.5% for AGIs over 100k)
Net capital gain/loss: +$3,778 (reported on 18.4% of returns)
Here:
+$3,778
State:
+$15,888
(% of AGI for various income ranges: 0.0% for AGIs below $10k, -0.4% for AGIs $10k-25k, -0.3% for AGIs $25k-50k, 0.2% for AGIs $50k-75k, 0.4% for AGIs $75k-100k, 1.6% for AGIs over 100k)
Profit/loss from business: +$8,046 (reported on 21.6% of returns)
Here:
+$8,046
State:
+$12,221
(% of AGI for various income ranges: 9.1% for AGIs below $10k, 8.8% for AGIs $10k-25k, 1.4% for AGIs $25k-50k, 1.7% for AGIs $50k-75k, 1.3% for AGIs $75k-100k, 2.7% for AGIs over 100k)
IRA payment deduction: $2,925 (reported on 2.5% of returns)
20720:
$2,925
Maryland:
$2,968
(% of AGI for various income ranges: 0.3% for AGIs $10k-25k, 0.2% for AGIs $25k-50k, 0.2% for AGIs $50k-75k, 0.1% for AGIs $75k-100k, 0.1% for AGIs over 100k)
Self-employed pension: $13,790 (reported on 1.4% of returns)
Here:
$13,790
Maryland:
$17,155
(% of AGI for various income ranges: 0.2% for AGIs $50k-75k, 0.1% for AGIs $75k-100k, 0.4% for AGIs over 100k)
Total itemized deductions: $28,019 (30% of AGI, reported on 69.3% of returns)
Here:
$28,019
State:
$22,960
Here:
29.6% of AGI
State:
23.3% of AGI
(% of AGI for various income ranges: 19.7% for AGIs below $10k, 19.7% for AGIs $10k-25k, 31.7% for AGIs $25k-50k, 33.7% for AGIs $50k-75k, 31.1% for AGIs $75k-100k, 23.7% for AGIs over 100k)
Charity contributions deductions: $5,034 (5% of AGI, reported on 64.0% of returns)
Here:
$5,034
State:
$4,031
Here:
5.2% of AGI
State:
3.9% of AGI
(% of AGI for various income ranges: 0.8% for AGIs below $10k, 2.8% for AGIs $10k-25k, 4.9% for AGIs $25k-50k, 5.6% for AGIs $50k-75k, 5.0% for AGIs $75k-100k, 4.1% for AGIs over 100k)
Total tax: $9,940 (reported on 83.7% of returns)
20720:
$9,940
State:
$10,167
(% of AGI for various income ranges: 4.1% for AGIs below $10k, 4.8% for AGIs $10k-25k, 6.0% for AGIs $25k-50k, 8.1% for AGIs $50k-75k, 9.4% for AGIs $75k-100k, 14.7% for AGIs over 100k)
Earned income credit: $1,703 (reported on 6.9% of returns)
Here:
$1,703
State:
$1,700
Percentage of individuals using paid preparers for their 2004 taxes: 52.1%
Here:
52%
State:
55%
(% for various income ranges: 40.1% for AGIs below $10k, 56.5% for AGIs $10k-25k, 54.6% for AGIs $25k-50k, 56.6% for AGIs $50k-75k, 52.2% for AGIs $75k-100k, 51.4% for AGIs over 100k)
Likely homosexual households (counted as self-reported same-sex unmarried-partner households)
Lesbian couples: 0.2% of all households
Gay men: 0.0% of all households
Household received Food Stamps/SNAP in the past 12 months: 754 Household did not receive Food Stamps/SNAP in the past 12 months: 7,690
Women who had a birth in the past 12 months: 354 (258 now married, 96 unmarried) Women who did not have a birth in the past 12 months: 5,345 (2,530 now married, 2,815 unmarried)
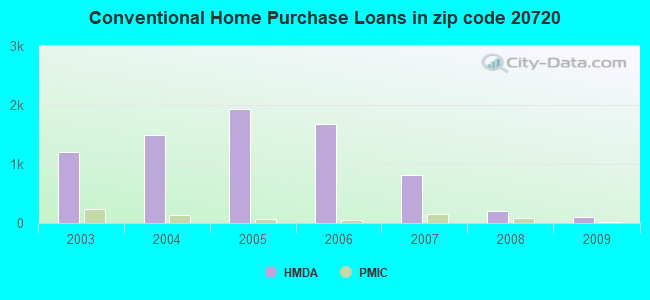
Housing units in zip code 20720 with a mortgage: 6,861 (677 second mortgage, 66 home equity loan, 507 both second mortgage and home equity loan) Houses without a mortgage: 144
Median monthly owner costs for units with a mortgage: $2,722 Median monthly owner costs for units without a mortgage: $871
Residents with income below the poverty level in 2022:
This zip code:
2.7%
Whole state:
9.6%
Residents with income below 50% of the poverty level in 2022:
This zip code:
1.3%
Whole state:
4.7%
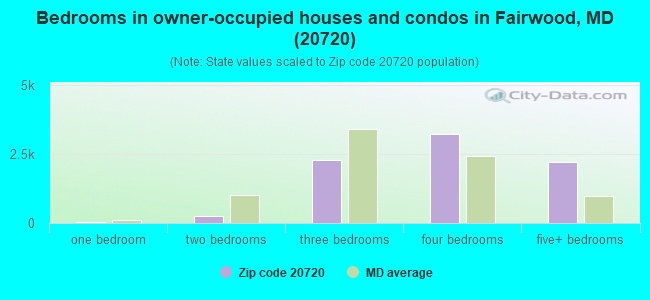
Median number of rooms in houses and condos:
Here:
8.4
State:
7.3
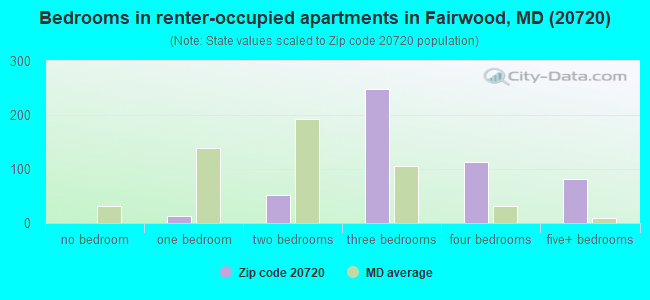
Median number of rooms in apartments:
Here:
6.0
State:
4.2
Notable locations in this zip code not listed on our city pages
Notable locations in zip code 20720: Prince Georges County Volunteer Fire Department Capital Heights Volunteer Fire Department (A), Goodloe House (B). Display/hide their locations on the map
Parks in zip code 20720 include: Northeast Branch Park (1), High Bridge Park (2), Glenn Dale Recreation Center (3), Folly Branch Park (4), Huntington North Recreation Area (5). Display/hide their locations on the map
3,941 married couples with children.
1,231 single-parent households (284 men, 947 women).
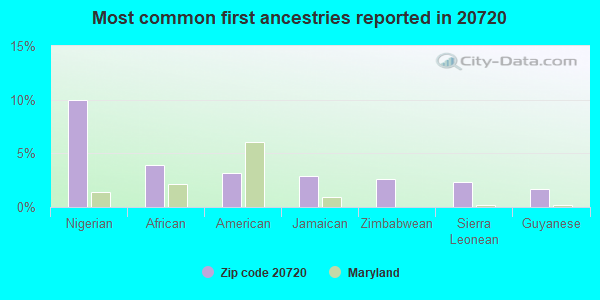
77.5% of residents of 20720 zip code speak English at home.
7.5% of residents speak Spanish at home (74% very well, 16% well, 8% not well, 2% not at all).
3.2% of residents speak other Indo-European language at home (62% very well, 18% well, 6% not well, 14% not at all).
3.3% of residents speak Asian or Pacific Island language at home (56% very well, 19% well, 20% not well, 5% not at all).
9.3% of residents speak other language at home (88% very well, 8% well, 2% not well, 1% not at all).
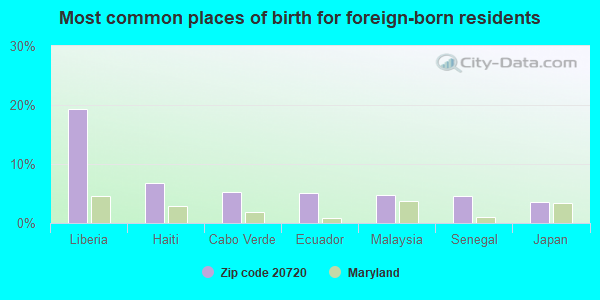
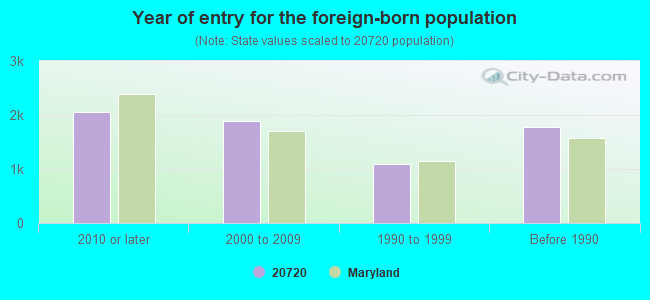
Foreign born population: 6,294 (24.0%) (67.3% of them are naturalized citizens)
Facilities with environmental interests located in this zip code:
BOWIE TOWERS CONDO/WOODLAWN LA (15611 EVERGLADE LANE in BOWIE, MD)
National Pollutant Discharge Elimination System NON-MAJOR (Tracking pollutant discharge elimination systems) - permit Business SIC classification: CIVIC, SOCIAL, AND FRATERNAL ASSOCIATIONS Alternative names: DRD POOL MANAGEMENT,INC
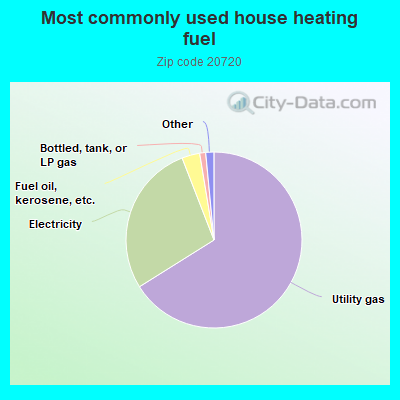
66.1%Utility gas
28.0%Electricity
3.3%Fuel oil, kerosene, etc.
1.1%Bottled, tank, or LP gas
0.6%No fuel used
0.6%Solar energy
Population in 1990: 8,239. Population change in the 1990s: +6,474 (+78.6%).
Place of birth for U.S.-born residents:
This state: 7,713
Northeast: 2,110
Midwest: 804
South: 8,235
West: 460
66% of the 20720 zip code residents lived in the same house 5 years ago. Out of people who lived in different houses, 63% lived in this county. Out of people who lived in different counties, 50% lived in Maryland.
92% of the 20720 zip code residents lived in the same house 1 year ago. Out of people who lived in different houses, 52% moved from this county. Out of people who lived in different houses, 15% moved from different county within same state. Out of people who lived in different houses, 22% moved from different state. Out of people who lived in different houses, 14% moved from abroad.
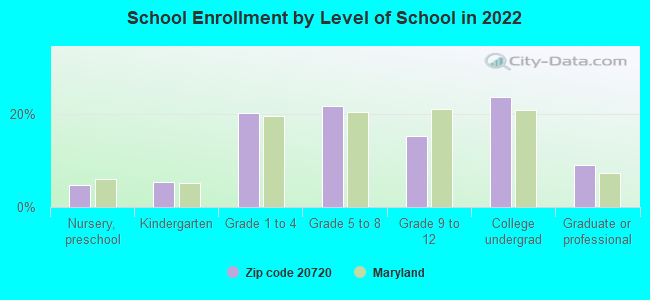
Private vs. public school enrollment:
Students in private schools in grades 1 to 8 (elementary and middle school): 834
Here:
28.0%
Maryland:
15.2%
Students in private schools in grades 9 to 12 (high school): 237
Here:
21.8%
Maryland:
14.4%
Students in private undergraduate colleges: 276
Here:
16.6%
Maryland:
20.2%
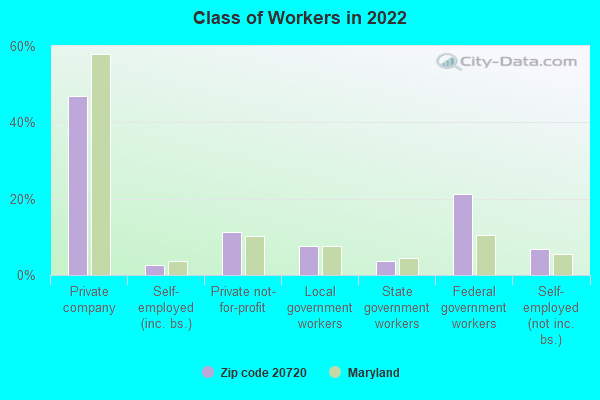
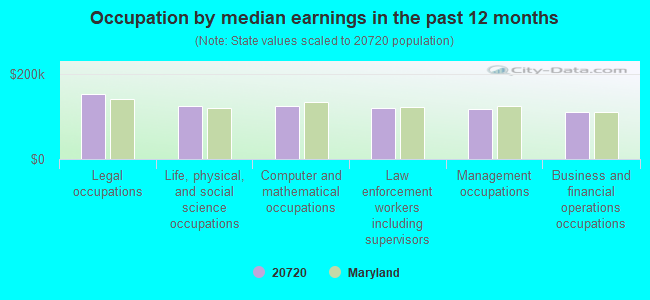
Occupation by median earnings in the past 12 months ($)
153,133Legal occupations
125,016Life, physical, and social science occupations
123,964Computer and mathematical occupations
119,078Law enforcement workers including supervisors
117,108Management occupations
109,782Business and financial operations occupations
Companies with federal contracts located in this zip code (BOWIE, MD):
INFORMATION DELIVERY SYSTEMS, (7305 QUETZAL DRIVE; small business) : $10,410,205 in 29 contractsfrom 2000 to 2006
Contracts for Programming Services, Telecommunications Network Management Services, Other ADP and Telecommunications Services (includes data storage on tapes, compact disks, etc.), Automated Information System Design and Integration Services by Navy Signed by year:2000: $81,553; 2001: $813,806; 2002: $2,363,948; 2003: $2,345,748; 2004: $2,539,582; 2005: $1,894,568; 2006: $371,000.
Biggest contracts:
$1,568,608 with Navy for Programming Services. Taking place in DC. Signed on 2003-09-09. Completion date: 2004-08-31.
$1,541,495, same as above.Signed on 2004-08-25. Completion date: 2005-08-31.
$1,518,668, same as above.Signed on 2005-08-31. Completion date: 2006-08-31.
$1,439,097, same as above.Signed on 2002-09-30. Completion date: 2003-08-31.
POWER CLEANING SERVICES INC (8407 BATES DR; small business) : $654,047 in 11 contractsfrom 1999 to 2005
Contracts for Operation of Government-Owned Facilities -- Maintenance Buildings, Maintenance, Repair and Rebuilding of Equipment -- Cleaning Equipment and Supplies, Custodial Janitorial Services by Department of State, Army Signed by year:2000: $121,000; 2001: $0; 2002: $80,000; 2003: $63,000; 2004: $159,264; 2005: $110,783; 2006: $0.
Biggest contracts:
$121,000 with Department of State for Operation of Government-Owned Facilities -- Maintenance Buildings. Signed on 2000-11-15. Completion date: 2001-09-15.
$120,000 with Department of State for Maintenance, Repair and Rebuilding of Equipment -- Cleaning Equipment and Supplies. Signed on 1999-10-15. Completion date: 2000-10-15.
$110,783 with Army for Custodial Janitorial Services. Signed on 2005-11-14. Completion date: 2004-09-30.
$80,000 with Department of State for Custodial Janitorial Services. Signed on 2002-02-15. Completion date: 2002-02-15.
M.D. RAPHA, INC (12602 HENDERSON CHAPEL LN; small business)
$26,000 with Office of Personnel Management for Other Professional Services. Signed on 2001-11-15. Completion date: 2001-12-15.
SPINS AND QUANTUM SOLUTIONS (13303 KATRINKA DR; small business)
$24,476 with Defense Microelectronics Activity for Engineering and Technical Services. Taking place in CA. Signed on 2005-11-17. Completion date: 2006-05-31.
SYSTEMS 3 LLC (13010 OLD FLETCHERTOWN RD; small business)
$3,000 with Army for Lectures For Training. Taking place in KY. Signed on 2005-01-31. Completion date: 2005-02-18.
Top industries in this zip code by the number of employees in 2005:


 Nearest zip codes: 20769, 20715, 20706, 20721, 20708, 20716.