Estimated zip code population in 2022: 3,160 Zip code population in 2010: 3,221 Zip code population in 2000: 2,805
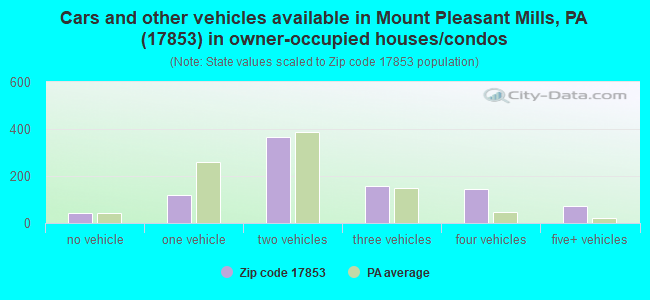
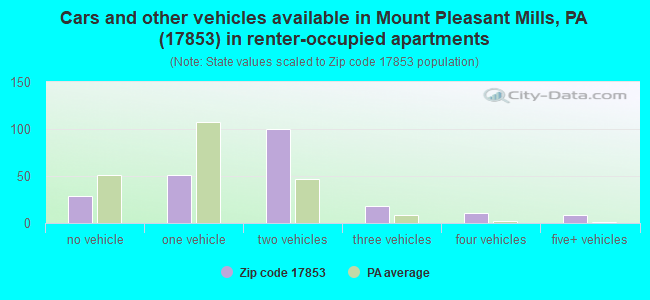
Houses and condos: 1,204 Renter-occupied apartments: 216
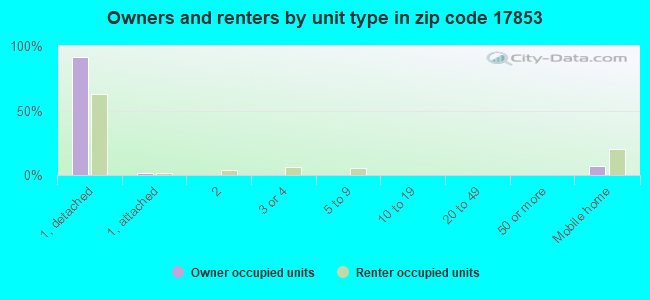
% of renters here:
19%
State:
31%
March 2022 cost of living index in zip code 17853: 92.4 (less than average, U.S. average is 100)
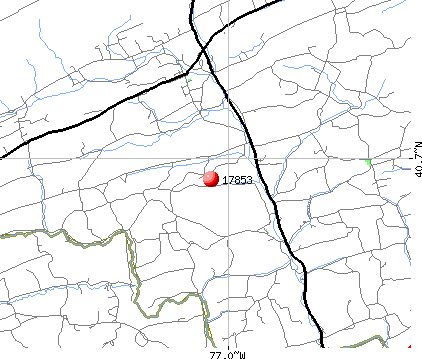
Land area: 42.3 sq. mi. Water area: 0.1 sq. mi.
Population density: 75 people per square mile
(very low).
OSM Map
General Map
Google Map
MSN Map
OSM Map
General Map
Google Map
MSN Map
OSM Map
General Map
Google Map
MSN Map
OSM Map
General Map
Google Map
MSN Map
Please wait while loading the map...
Real estate property taxes paid for housing units in 2022:
This zip code:
1.0% ($2,302)
Pennsylvania:
1.3% ($3,094)
Median real estate property taxes paid for housing units with mortgages in 2022: $2,381 (1.0%) Median real estate property taxes paid for housing units with no mortgage in 2022: $2,200 (1.1%)
Business Search- 14 Million verified businesses
Males: 1,559
(49.3%)
Females: 1,601
(50.7%)
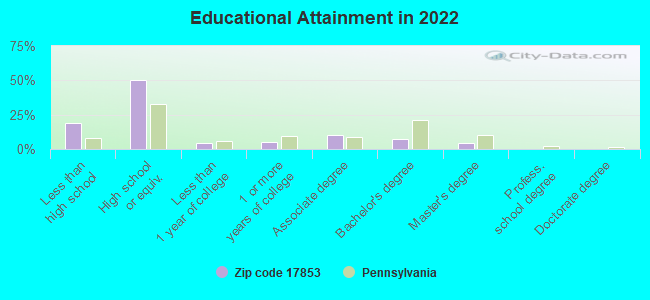
For population 25 years and over in 17853:
High school or higher: 78.9%
Bachelor's degree or higher: 11.4%
Graduate or professional degree: 4.4%
Unemployed: 1.5%
Mean travel time to work (commute): 29.3 minutes
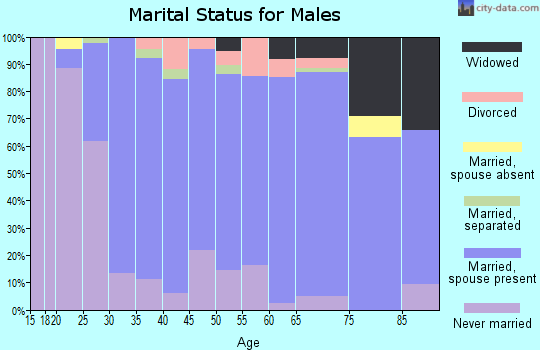
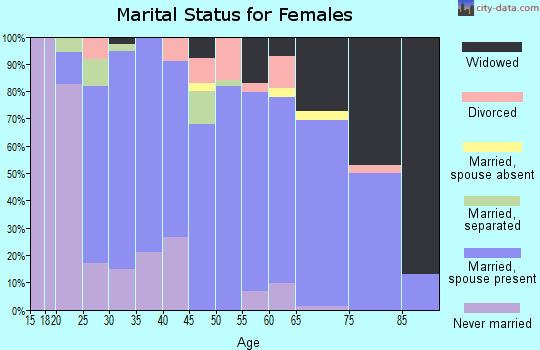
For population 15 years and over in 17853:
Never married: 23.8%
Now married: 67.1%
Separated: 1.2%
Widowed: 3.4%
Divorced: 4.5%
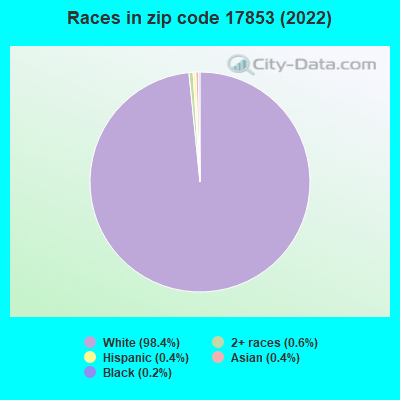
Zip code 17853 compared to state average:
Unemployed percentage below state average.
Black race population percentage significantly below state average.
Hispanic race population percentage significantly below state average.
Foreign-born population percentage significantly below state average.
Renting percentage below state average.
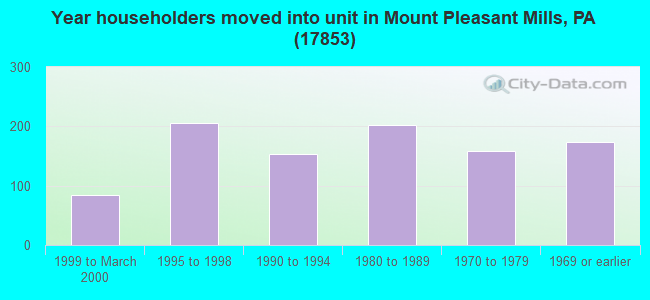
Length of stay since moving in significantly above state average.
Number of college students below state average.
Percentage of population with a bachelor's degree or higher significantly below state average.
Averages for the 2020 tax year for zip code 17853, filed in 2021:
Average Adjusted Gross Income (AGI) in 2020: $52,342 (Individual Income Tax Returns)
Here:
$52,342
State:
$75,707
Salary/wage: $42,983 (reported on 73.6% of returns)
Here:
$42,983
State:
$62,806
(% of AGI for various income ranges: 1472.3% for AGIs below $25k, 4333.8% for AGIs $25k-50k, 6687.3% for AGIs $50k-75k, 9270.0% for AGIs $75k-100k, 18546.2% for AGIs $100k-200k)
Taxable interest for individuals: $1,969 (reported on 33.1% of returns)
This zip code:
$1,969
Pennsylvania:
$1,633
(% of AGI for various income ranges: 45.5% for AGIs below $25k, 55.4% for AGIs $25k-50k, 86.7% for AGIs $50k-75k, 77.8% for AGIs $75k-100k, 665.0% for AGIs $100k-200k)
Ordinary dividends: $1,788 (reported on 17.6% of returns)
Here:
$1,788
State:
$7,382
(% of AGI for various income ranges: 35.5% for AGIs below $25k, 31.2% for AGIs $25k-50k, 24.7% for AGIs $50k-75k, 118.9% for AGIs $75k-100k, 210.0% for AGIs $100k-200k)
Net capital gain/loss in AGI: +$10,314 (reported on 14.2% of returns)
Here:
+$10,314
State:
+$23,522
(% of AGI for various income ranges: 5.5% for AGIs below $25k, 74.2% for AGIs $25k-50k, 113.3% for AGIs $50k-75k, 212.2% for AGIs $75k-100k, 2018.8% for AGIs $100k-200k)
Profit/loss from business: +$13,481 (reported on 20.9% of returns)
Here:
+$13,481
State:
+$16,274
(% of AGI for various income ranges: 232.7% for AGIs below $25k, 318.8% for AGIs $25k-50k, 576.7% for AGIs $50k-75k, 650.0% for AGIs $75k-100k, 1815.0% for AGIs $100k-200k)
Taxable individual retirement arrangement distribution: $11,321 (reported on 9.5% of returns)
17853:
$11,321
Pennsylvania:
$18,583
(% of AGI for various income ranges: 128.2% for AGIs below $25k, 82.5% for AGIs $25k-50k, 336.7% for AGIs $50k-75k, 750.0% for AGIs $100k-200k)
Total itemized deductions: $32,600 (reported on 1.4% of returns)
Here:
$32,600
State:
$34,850
(% of AGI for various income ranges: 815.0% for AGIs $100k-200k)
Charity contributions: $15,450 (reported on 1.4% of returns)
Here:
$15,450
State:
$12,392
(% of AGI for various income ranges: 386.2% for AGIs $100k-200k)
Taxes paid: $9,800 (reported on 1.4% of returns)
17853:
$9,800
State:
$8,200
(% of AGI for various income ranges: 245.0% for AGIs $100k-200k)
Earned income credit: $2,041 (reported on 11.5% of returns)
Here:
$2,041
State:
$2,100
(% of AGI for various income ranges: 65.9% for AGIs below $25k, 84.2% for AGIs $25k-50k)
Percentage of individuals using paid preparers for their 2020 taxes: 92.6%
Here:
93%
State:
92%
(% for various income ranges: 91.5% for AGIs below $25k, 95.1% for AGIs $25k-50k, 96.2% for AGIs $50k-75k, 87.5% for AGIs $75k-100k, 93.3% for AGIs $100k-200k, 66.7% for AGIs over 200k)
Averages for the 2012 tax year for zip code 17853, filed in 2013:
Average Adjusted Gross Income (AGI) in 2012: $40,222 (Individual Income Tax Returns)
Here:
$40,222
State:
$61,346
Salary/wage: $36,194 (reported on 75.7% of returns)
Here:
$36,194
State:
$51,902
(% of AGI for various income ranges: 59.4% for AGIs below $25k, 70.1% for AGIs $25k-50k, 74.0% for AGIs $50k-75k, 74.6% for AGIs $75k-100k, 56.2% for AGIs $100k-200k)
Taxable interest for individuals: $1,343 (reported on 37.9% of returns)
This zip code:
$1,343
Pennsylvania:
$1,588
(% of AGI for various income ranges: 2.6% for AGIs below $25k, 1.3% for AGIs $25k-50k, 0.9% for AGIs $50k-75k, 0.7% for AGIs $75k-100k, 1.4% for AGIs $100k-200k)
Ordinary dividends: $1,458 (reported on 18.6% of returns)
Here:
$1,458
State:
$5,827
(% of AGI for various income ranges: 1.0% for AGIs below $25k, 0.3% for AGIs $25k-50k, 0.7% for AGIs $50k-75k, 0.7% for AGIs $75k-100k, 1.1% for AGIs $100k-200k)
Net capital gain/loss in AGI: +$5,047 (reported on 10.7% of returns)
Here:
+$5,047
State:
+$14,495
(% of AGI for various income ranges: 1.1% for AGIs below $25k, 0.6% for AGIs $25k-50k, 0.4% for AGIs $50k-75k, 2.2% for AGIs $75k-100k, 3.1% for AGIs $100k-200k)
Profit/loss from business: +$10,609 (reported on 23.6% of returns)
Here:
+$10,609
State:
+$16,268
(% of AGI for various income ranges: 13.5% for AGIs below $25k, 5.8% for AGIs $25k-50k, 4.0% for AGIs $50k-75k, 11.3% for AGIs $75k-100k)
Taxable individual retirement arrangement distribution: $9,567 (reported on 8.6% of returns)
17853:
$9,567
Pennsylvania:
$14,550
(% of AGI for various income ranges: 3.7% for AGIs below $25k, 2.3% for AGIs $25k-50k, 3.9% for AGIs $50k-75k)
Total itemized deductions: $18,758 (25% of AGI, reported on 17.1% of returns)
Here:
$18,758
State:
$23,538
Here:
25.1% of AGI
State:
18.4% of AGI
(% of AGI for various income ranges: 3.6% for AGIs below $25k, 5.5% for AGIs $25k-50k, 7.1% for AGIs $50k-75k, 10.6% for AGIs $75k-100k, 13.0% for AGIs $100k-200k)
Charity contributions: $4,261 (reported on 12.9% of returns)
Here:
$4,261
State:
$4,025
(% of AGI for various income ranges: 0.9% for AGIs $25k-50k, 0.9% for AGIs $50k-75k, 1.9% for AGIs $75k-100k, 3.1% for AGIs $100k-200k)
Taxes paid: $6,367 (reported on 17.1% of returns)
17853:
$6,367
State:
$9,982
(% of AGI for various income ranges: 1.8% for AGIs $25k-50k, 2.2% for AGIs $50k-75k, 3.5% for AGIs $75k-100k, 5.7% for AGIs $100k-200k)
Earned income credit: $1,965 (reported on 14.3% of returns)
Here:
$1,965
State:
$2,106
(% of AGI for various income ranges: 3.4% for AGIs below $25k, 1.1% for AGIs $25k-50k)
Percentage of individuals using paid preparers for their 2012 taxes: 71.4%
Here:
71%
State:
53%
(% for various income ranges: 67.9% for AGIs below $25k, 69.0% for AGIs $25k-50k, 78.3% for AGIs $50k-75k, 75.0% for AGIs $75k-100k, 85.7% for AGIs $100k-200k)
Averages for the 2004 tax year for zip code 17853, filed in 2005:
Average Adjusted Gross Income (AGI) in 2004: $37,264 (Individual Income Tax Returns)
Here:
$37,264
State:
$48,049
Salary/wage: $33,346 (reported on 80.0% of returns)
Here:
$33,346
State:
$42,646
(% of AGI for various income ranges: 75.3% for AGIs below $10k, 67.9% for AGIs $10k-25k, 79.0% for AGIs $25k-50k, 80.3% for AGIs $50k-75k, 79.0% for AGIs $75k-100k, 39.9% for AGIs over 100k)
Taxable interest for individuals: $1,362 (reported on 48.2% of returns)
This zip code:
$1,362
Pennsylvania:
$1,657
(% of AGI for various income ranges: 7.4% for AGIs below $10k, 2.4% for AGIs $10k-25k, 1.1% for AGIs $25k-50k, 1.6% for AGIs $50k-75k, 1.3% for AGIs $75k-100k, 2.6% for AGIs over 100k)
Taxable dividends: $1,136 (reported on 19.4% of returns)
Here:
$1,136
State:
$3,566
(% of AGI for various income ranges: 1.3% for AGIs below $10k, 0.7% for AGIs $10k-25k, 0.3% for AGIs $25k-50k, 1.0% for AGIs $50k-75k, 0.4% for AGIs $75k-100k, 0.6% for AGIs over 100k)
Net capital gain/loss: +$7,611 (reported on 14.9% of returns)
Here:
+$7,611
State:
+$9,716
(% of AGI for various income ranges: -0.5% for AGIs below $10k, 1.3% for AGIs $10k-25k, 0.8% for AGIs $25k-50k, 1.6% for AGIs $50k-75k, 0.2% for AGIs $75k-100k, 13.4% for AGIs over 100k)
Profit/loss from business: +$11,993 (reported on 21.1% of returns)
Here:
+$11,993
State:
+$14,267
(% of AGI for various income ranges: 6.3% for AGIs below $10k, 12.4% for AGIs $10k-25k, 5.8% for AGIs $25k-50k, 2.7% for AGIs $50k-75k, 5.9% for AGIs $75k-100k, 12.0% for AGIs over 100k)
Profit/loss from farming: +$3,590 (reported on 7.5% of returns)
Here:
+$3,590
State:
+$274
(% of AGI for various income ranges: -1.3% for AGIs below $10k, 2.8% for AGIs $10k-25k, 1.7% for AGIs $25k-50k, -0.8% for AGIs $75k-100k)
IRA payment deduction: $2,643 (reported on 3.2% of returns)
17853:
$2,643
Pennsylvania:
$2,903
Total itemized deductions: $15,145 (19% of AGI, reported on 16.5% of returns)
Here:
$15,145
State:
$18,804
Here:
19.0% of AGI
State:
19.5% of AGI
(% of AGI for various income ranges: 4.3% for AGIs $10k-25k, 4.3% for AGIs $25k-50k, 9.2% for AGIs $50k-75k, 9.8% for AGIs $75k-100k, 7.9% for AGIs over 100k)
Charity contributions deductions: $3,740 (4% of AGI, reported on 12.7% of returns)
Here:
$3,740
State:
$3,337
Here:
4.4% of AGI
State:
3.3% of AGI
(% of AGI for various income ranges: 1.1% for AGIs $10k-25k, 0.5% for AGIs $25k-50k, 1.5% for AGIs $50k-75k, 1.0% for AGIs $75k-100k, 3.1% for AGIs over 100k)
Total tax: $4,830 (reported on 75.7% of returns)
17853:
$4,830
State:
$8,008
(% of AGI for various income ranges: 4.3% for AGIs below $10k, 4.7% for AGIs $10k-25k, 6.3% for AGIs $25k-50k, 7.9% for AGIs $50k-75k, 11.2% for AGIs $75k-100k, 22.6% for AGIs over 100k)
Earned income credit: $1,252 (reported on 11.3% of returns)
Here:
$1,252
State:
$1,643
Percentage of individuals using paid preparers for their 2004 taxes: 69.5%
Here:
69%
State:
56%
(% for various income ranges: 62.5% for AGIs below $10k, 71.1% for AGIs $10k-25k, 70.3% for AGIs $25k-50k, 69.5% for AGIs $50k-75k, 70.7% for AGIs $75k-100k, 97.0% for AGIs over 100k)
Household received Food Stamps/SNAP in the past 12 months: 72 Household did not receive Food Stamps/SNAP in the past 12 months: 1,050
Women who had a birth in the past 12 months: 30 (32 now married, 0 unmarried) Women who did not have a birth in the past 12 months: 629 (344 now married, 282 unmarried)
Housing units in zip code 17853 with a mortgage: 463 (59 second mortgage, 3 home equity loan, 51 both second mortgage and home equity loan) Houses without a mortgage: 131
Median monthly owner costs for units with a mortgage: $1,114 Median monthly owner costs for units without a mortgage: $500
Residents with income below the poverty level in 2022:
This zip code:
4.0%
Whole state:
11.8%
Residents with income below 50% of the poverty level in 2022:
This zip code:
3.1%
Whole state:
6.1%
Median number of rooms in houses and condos:
Here:
6.7
State:
6.8
Median number of rooms in apartments:
Here:
5.3
State:
4.3
Notable locations in this zip code not listed on our city pages
Churches in zip code 17853 include: Grubbs Church (A), Arbogast Church (B), Saint Johns Church (C), Leiningers Church (D), Saint Thomas Church (E), Emanuel Church (F), Daniels Church (G), Dresslers Church (H), Bethel Church (I). Display/hide their locations on the map
Size of family households: 481 2-persons, 151 3-persons, 112 4-persons, 92 5-persons, 16 6-persons, 44 7-or-more-persons
Size of nonfamily households: 200 1-person, 26 2-persons
707 married couples with children.
41 single-parent households (14 men, 27 women).
89.4% of residents of 17853 zip code speak English at home.
0.6% of residents speak Spanish at home (100% not at all).
9.3% of residents speak other Indo-European language at home (44% very well, 52% well, 4% not well).
0.3% of residents speak Asian or Pacific Island language at home (10% very well, 90% well).
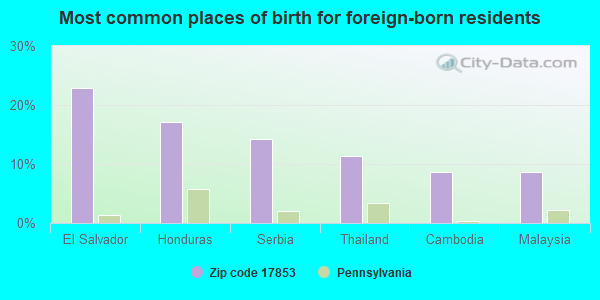
Foreign born population: 35 (1.1%) (54.0% of them are naturalized citizens)
This zip code:
1.1%
Whole state:
7.5%
23%El Salvador
17%Honduras
14%Serbia
11%Thailand
9%Cambodia
9%Malaysia
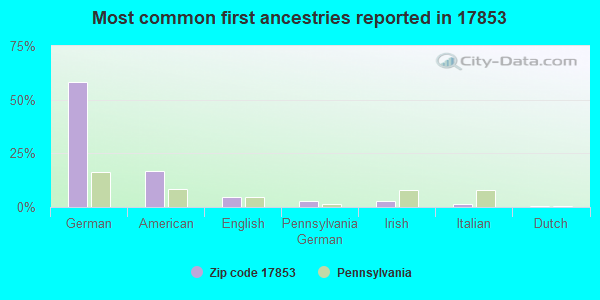
58%German
17%American
4%English
3%Pennsylvania German
3%Irish
1%Italian
1%Dutch
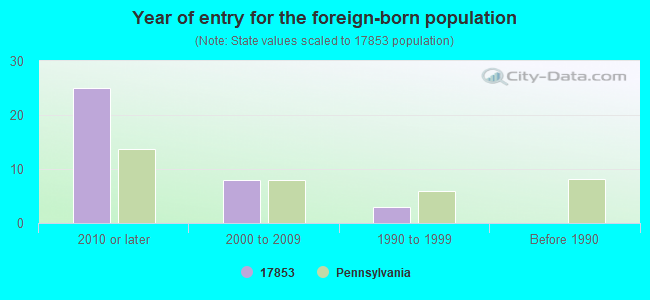
Year of entry for the foreign-born population
252010 or later
82000 to 2009
31990 to 1999
0Before 1990
Housing units lacking complete plumbing facilities: 1.0% Housing units lacking complete kitchen facilities: 0.8%
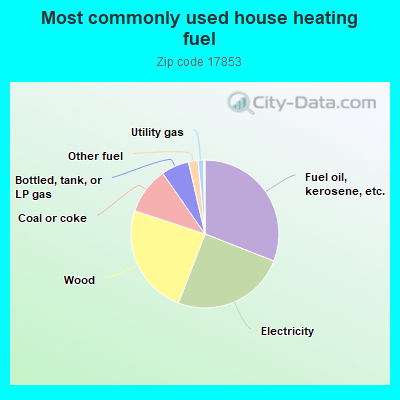
31.1%Fuel oil, kerosene, etc.
25.0%Electricity
24.3%Wood
10.3%Coal or coke
6.1%Bottled, tank, or LP gas
2.1%Other fuel
1.2%Utility gas
Population in 1990: 1,876. Population change in the 1990s: +929 (+49.5%).
Place of birth for U.S.-born residents:
This state: 2,898
Northeast: 25
Midwest: 36
South: 90
West: 50
76% of the 17853 zip code residents lived in the same house 5 years ago. Out of people who lived in different houses, 68% lived in this county. Out of people who lived in different counties, 50% lived in Pennsylvania.
95% of the 17853 zip code residents lived in the same house 1 year ago. Out of people who lived in different houses, 64% moved from this county. Out of people who lived in different houses, 24% moved from different county within same state. Out of people who lived in different houses, 9% moved from different state. Out of people who lived in different houses, 5% moved from abroad.
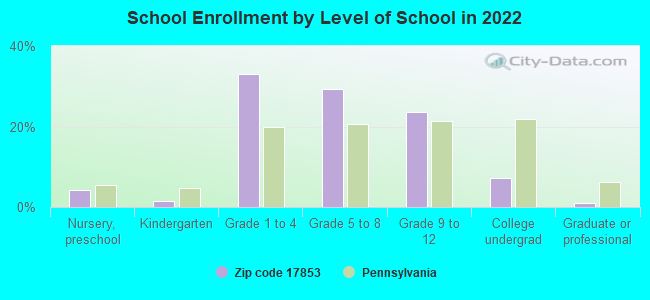
Private vs. public school enrollment:
Students in private schools in grades 1 to 8 (elementary and middle school): 270
Here:
62.7%
Pennsylvania:
15.7%
Students in private schools in grades 9 to 12 (high school): 62
Here:
39.9%
Pennsylvania:
13.4%
Students in private undergraduate colleges: 9
Here:
20.5%
Pennsylvania:
39.8%
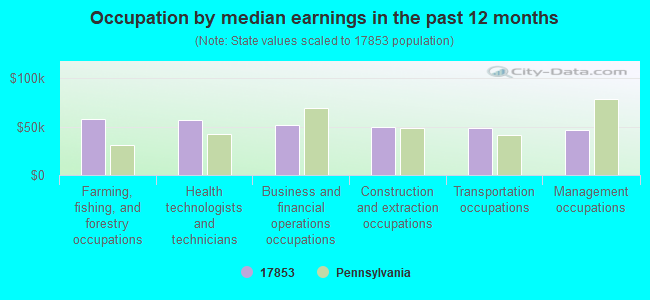
Occupation by median earnings in the past 12 months ($)
57,565Farming, fishing, and forestry occupations
57,293Health technologists and technicians
51,934Business and financial operations occupations
49,645Construction and extraction occupations
48,131Transportation occupations
46,105Management occupations
Top industries in this zip code by the number of employees in 2005:
Health Care and Social Assistance: Offices of Physicians (except Mental Health Specialists) (20-49 employees: 1 establishment, 1-4 employees: 1 establishment)
Accommodation and Food Services: Full-Service Restaurants (10-19: 1, 1-4: 2)
Fatal accident statistics in 2014:
Fatal accident count: 1
Vehicles involved in fatal accidents: 2
Fatal accidents caused by drunken drivers: 0
Fatalities: 1
Persons involved in fatal accidents: 3
Pedestrians involved in fatal accidents: 0
Fatal accident statistics in 2011:
Fatal accident count: 1
Vehicles involved in fatal accidents: 2
Fatal accidents caused by drunken drivers: 0
Fatalities: 1
Persons involved in fatal accidents: 3
Pedestrians involved in fatal accidents: 0
Most common first names in zip code 17853 among deceased individuals
Name
Count
Lived (average)
John
16
77.2 years
Mary
14
71.9 years
George
13
72.6 years
William
13
73.6 years
Walter
12
73.4 years
Dorothy
11
74.8 years
Paul
10
70.8 years
Robert
10
72.9 years
Betty
8
73.7 years
Charles
8
73.2 years
Most common last names in zip code 17853 among deceased individuals
Last name
Count
Lived (average)
Shaffer
15
81.1 years
Goodling
14
77.2 years
Hoffman
11
73.3 years
Kerstetter
11
76.3 years
Portzline
9
73.0 years
Minium
9
78.2 years
Feltman
8
70.1 years
Arbogast
8
86.0 years
Martin
8
77.1 years
Maneval
8
75.1 years
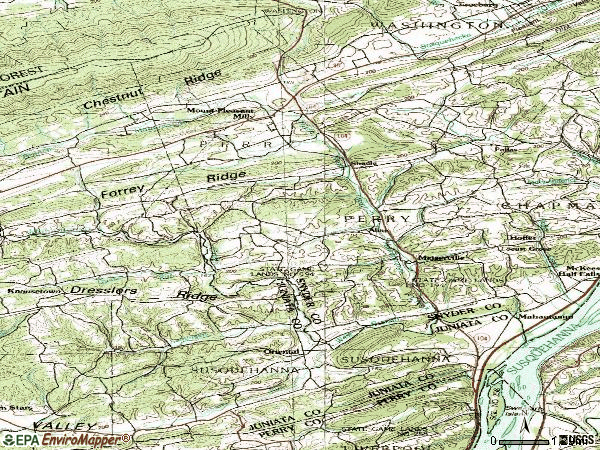
Discuss Mount Pleasant Mills, Pennsylvania (PA) on our hugely popular Pennsylvania forum.
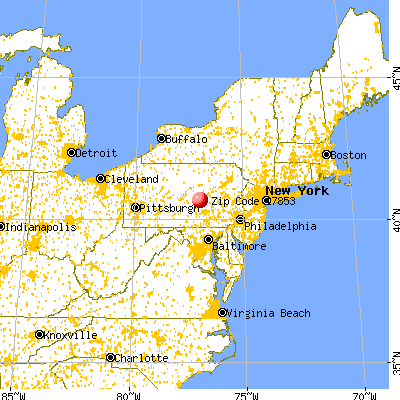


 Nearest zip codes: 17827, 17045, 17864, 17861, 17842, 17086.