Estimated zip code population in 2022: 2,141 Zip code population in 2010: 2,499 Zip code population in 2000: 2,426
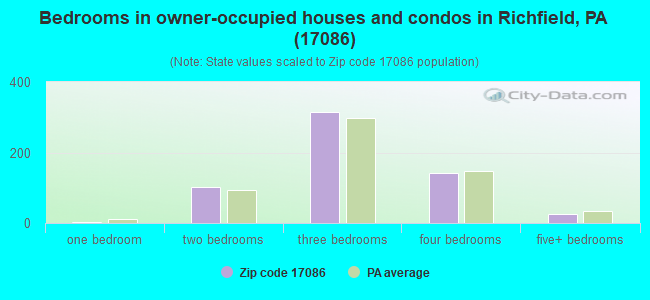
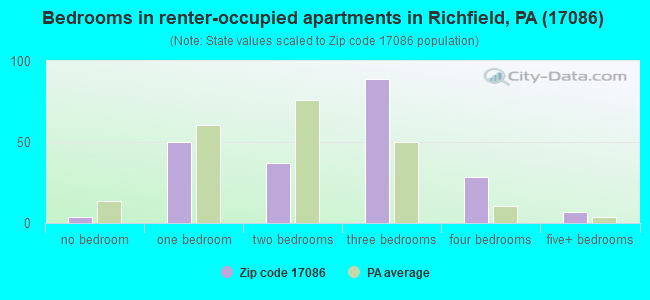
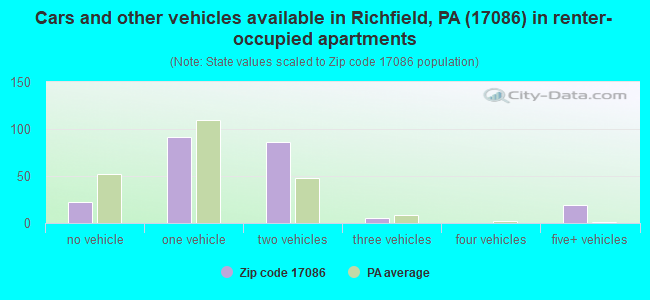
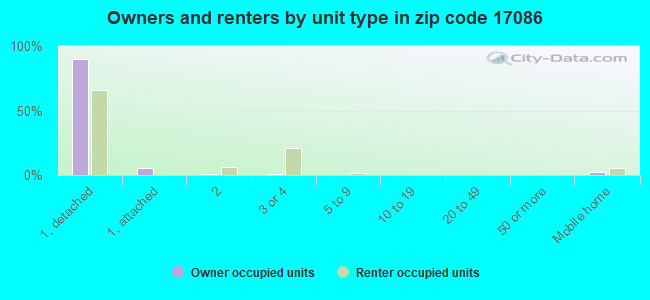
Houses and condos: 942 Renter-occupied apartments: 218
% of renters here:
27%
State:
31%
March 2022 cost of living index in zip code 17086: 90.7 (less than average, U.S. average is 100)
Land area: 38.2 sq. mi. Water area: 0.0 sq. mi.
Population density: 56 people per square mile
(very low).
OSM Map
General Map
Google Map
MSN Map
OSM Map
General Map
Google Map
MSN Map
OSM Map
General Map
Google Map
MSN Map
OSM Map
General Map
Google Map
MSN Map
Please wait while loading the map...
Real estate property taxes paid for housing units in 2022:
This zip code:
1.0% ($1,869)
Pennsylvania:
1.3% ($3,094)
Median real estate property taxes paid for housing units with mortgages in 2022: $1,889 (1.1%) Median real estate property taxes paid for housing units with no mortgage in 2022: $1,848 (1.0%)
Business Search- 14 Million verified businesses
Males: 1,054
(49.2%)
Females: 1,086
(50.8%)
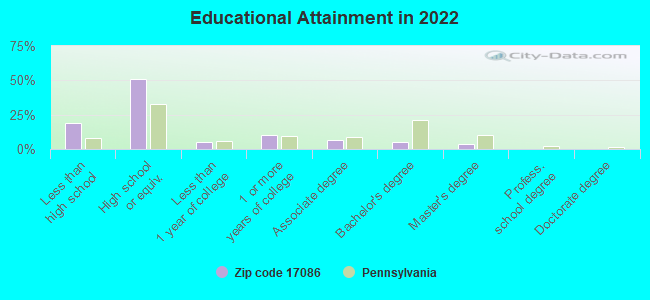
For population 25 years and over in 17086:
High school or higher: 79.1%
Bachelor's degree or higher: 9.0%
Graduate or professional degree: 4.1%
Unemployed: 2.2%
Mean travel time to work (commute): 33.2 minutes
For population 15 years and over in 17086:
Never married: 28.2%
Now married: 56.8%
Separated: 1.1%
Widowed: 8.6%
Divorced: 5.3%
Zip code 17086 compared to state average:
Unemployed percentage below state average.
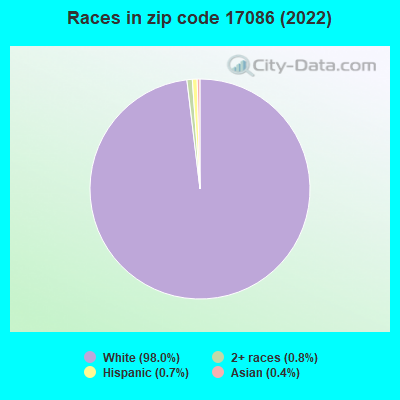
Black race population percentage significantly below state average.
Hispanic race population percentage significantly below state average.
Median age above state average.
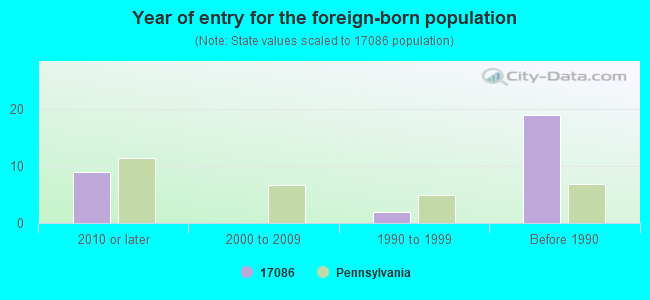
Foreign-born population percentage significantly below state average.
Length of stay since moving in significantly above state average.
Number of college students below state average.
Percentage of population with a bachelor's degree or higher significantly below state average.
Averages for the 2020 tax year for zip code 17086, filed in 2021:
Average Adjusted Gross Income (AGI) in 2020: $52,846 (Individual Income Tax Returns)
Here:
$52,846
State:
$75,707
Salary/wage: $43,367 (reported on 76.4% of returns)
Here:
$43,367
State:
$62,806
(% of AGI for various income ranges: 1338.8% for AGIs below $25k, 3567.4% for AGIs $25k-50k, 7189.2% for AGIs $50k-75k, 11107.1% for AGIs $75k-100k, 23862.5% for AGIs $100k-200k)
Taxable interest for individuals: $2,278 (reported on 36.4% of returns)
This zip code:
$2,278
Pennsylvania:
$1,633
(% of AGI for various income ranges: 55.9% for AGIs below $25k, 61.7% for AGIs $25k-50k, 38.3% for AGIs $50k-75k, 117.1% for AGIs $75k-100k, 1365.0% for AGIs $100k-200k)
Ordinary dividends: $2,300 (reported on 18.2% of returns)
Here:
$2,300
State:
$7,382
(% of AGI for various income ranges: 56.5% for AGIs below $25k, 24.3% for AGIs $25k-50k, 75.8% for AGIs $50k-75k, 64.3% for AGIs $75k-100k, 430.0% for AGIs $100k-200k)
Net capital gain/loss in AGI: +$7,818 (reported on 15.5% of returns)
Here:
+$7,818
State:
+$23,522
(% of AGI for various income ranges: 36.5% for AGIs below $25k, 34.3% for AGIs $25k-50k, 177.5% for AGIs $50k-75k, 191.4% for AGIs $75k-100k, 2102.5% for AGIs $100k-200k)
Profit/loss from business: +$12,855 (reported on 18.2% of returns)
Here:
+$12,855
State:
+$16,274
(% of AGI for various income ranges: 175.3% for AGIs below $25k, 189.6% for AGIs $25k-50k, 515.8% for AGIs $50k-75k, 582.9% for AGIs $75k-100k, 2025.0% for AGIs $100k-200k)
Taxable individual retirement arrangement distribution: $10,167 (reported on 10.9% of returns)
17086:
$10,167
Pennsylvania:
$18,583
(% of AGI for various income ranges: 150.6% for AGIs below $25k, 99.1% for AGIs $25k-50k, 130.0% for AGIs $50k-75k, 828.6% for AGIs $75k-100k)
Total itemized deductions: $31,900 (reported on 2.7% of returns)
Here:
$31,900
State:
$34,850
(% of AGI for various income ranges: 2392.5% for AGIs $100k-200k)
Charity contributions: $23,850 (reported on 1.8% of returns)
Here:
$23,850
State:
$12,392
(% of AGI for various income ranges: 1192.5% for AGIs $100k-200k)
Taxes paid: $7,300 (reported on 2.7% of returns)
17086:
$7,300
State:
$8,200
(% of AGI for various income ranges: 547.5% for AGIs $100k-200k)
Earned income credit: $1,925 (reported on 10.9% of returns)
Here:
$1,925
State:
$2,100
(% of AGI for various income ranges: 55.3% for AGIs below $25k, 59.6% for AGIs $25k-50k)
Percentage of individuals using paid preparers for their 2020 taxes: 95.5%
Here:
95%
State:
92%
(% for various income ranges: 91.7% for AGIs below $25k, 96.8% for AGIs $25k-50k, 94.7% for AGIs $50k-75k, 100.0% for AGIs $75k-100k, 122.2% for AGIs $100k-200k, 0.0% for AGIs over 200k)
Averages for the 2012 tax year for zip code 17086, filed in 2013:
Average Adjusted Gross Income (AGI) in 2012: $43,131 (Individual Income Tax Returns)
Here:
$43,131
State:
$61,346
Salary/wage: $37,778 (reported on 76.9% of returns)
Here:
$37,778
State:
$51,902
(% of AGI for various income ranges: 58.4% for AGIs below $25k, 75.0% for AGIs $25k-50k, 77.5% for AGIs $50k-75k, 68.2% for AGIs $75k-100k, 50.2% for AGIs $100k-200k)
Taxable interest for individuals: $1,470 (reported on 45.2% of returns)
This zip code:
$1,470
Pennsylvania:
$1,588
(% of AGI for various income ranges: 4.4% for AGIs below $25k, 1.3% for AGIs $25k-50k, 0.6% for AGIs $50k-75k, 0.8% for AGIs $75k-100k, 2.1% for AGIs $100k-200k)
Ordinary dividends: $2,005 (reported on 20.2% of returns)
Here:
$2,005
State:
$5,827
(% of AGI for various income ranges: 1.9% for AGIs below $25k, 0.8% for AGIs $25k-50k, 0.4% for AGIs $50k-75k, 1.7% for AGIs $75k-100k, 0.8% for AGIs $100k-200k)
Net capital gain/loss in AGI: +$5,508 (reported on 12.5% of returns)
Here:
+$5,508
State:
+$14,495
(% of AGI for various income ranges: 0.4% for AGIs below $25k, 0.3% for AGIs $25k-50k, 0.4% for AGIs $50k-75k, 8.8% for AGIs $75k-100k)
Profit/loss from business: +$10,480 (reported on 19.2% of returns)
Here:
+$10,480
State:
+$16,268
(% of AGI for various income ranges: 8.3% for AGIs below $25k, 4.1% for AGIs $25k-50k, 4.7% for AGIs $50k-75k, 10.2% for AGIs $75k-100k)
Taxable individual retirement arrangement distribution: $6,673 (reported on 10.6% of returns)
17086:
$6,673
Pennsylvania:
$14,550
(% of AGI for various income ranges: 4.4% for AGIs below $25k, 1.5% for AGIs $25k-50k, 3.0% for AGIs $50k-75k)
Total itemized deductions: $18,216 (21% of AGI, reported on 18.3% of returns)
Here:
$18,216
State:
$23,538
Here:
21.1% of AGI
State:
18.4% of AGI
(% of AGI for various income ranges: 6.9% for AGIs $25k-50k, 7.4% for AGIs $50k-75k, 10.2% for AGIs $75k-100k, 10.6% for AGIs $100k-200k)
Charity contributions: $6,514 (reported on 13.5% of returns)
Here:
$6,514
State:
$4,025
(% of AGI for various income ranges: 1.2% for AGIs $25k-50k, 1.6% for AGIs $50k-75k, 2.7% for AGIs $75k-100k, 3.9% for AGIs $100k-200k)
Taxes paid: $5,947 (reported on 18.3% of returns)
17086:
$5,947
State:
$9,982
(% of AGI for various income ranges: 1.4% for AGIs $25k-50k, 2.1% for AGIs $50k-75k, 3.8% for AGIs $75k-100k, 4.4% for AGIs $100k-200k)
Earned income credit: $1,887 (reported on 14.4% of returns)
Here:
$1,887
State:
$2,106
(% of AGI for various income ranges: 3.5% for AGIs below $25k, 1.2% for AGIs $25k-50k)
Percentage of individuals using paid preparers for their 2012 taxes: 70.2%
Here:
70%
State:
53%
(% for various income ranges: 70.0% for AGIs below $25k, 63.3% for AGIs $25k-50k, 75.0% for AGIs $50k-75k, 75.0% for AGIs $75k-100k, 83.3% for AGIs $100k-200k)
Averages for the 2004 tax year for zip code 17086, filed in 2005:
Average Adjusted Gross Income (AGI) in 2004: $35,612 (Individual Income Tax Returns)
Here:
$35,612
State:
$48,049
Salary/wage: $33,063 (reported on 81.7% of returns)
Here:
$33,063
State:
$42,646
(% of AGI for various income ranges: 116.7% for AGIs below $10k, 62.5% for AGIs $10k-25k, 81.6% for AGIs $25k-50k, 86.3% for AGIs $50k-75k, 81.2% for AGIs $75k-100k, 48.2% for AGIs over 100k)
Taxable interest for individuals: $1,431 (reported on 52.5% of returns)
This zip code:
$1,431
Pennsylvania:
$1,657
(% of AGI for various income ranges: 17.6% for AGIs below $10k, 5.3% for AGIs $10k-25k, 1.9% for AGIs $25k-50k, 0.8% for AGIs $50k-75k, 0.5% for AGIs $75k-100k, 2.2% for AGIs over 100k)
Taxable dividends: $1,436 (reported on 22.3% of returns)
Here:
$1,436
State:
$3,566
(% of AGI for various income ranges: 4.2% for AGIs below $10k, 0.7% for AGIs $10k-25k, 0.8% for AGIs $25k-50k, 0.6% for AGIs $50k-75k, 0.3% for AGIs $75k-100k, 1.8% for AGIs over 100k)
Net capital gain/loss: +$4,926 (reported on 13.5% of returns)
Here:
+$4,926
State:
+$9,716
(% of AGI for various income ranges: -1.5% for AGIs below $10k, 2.2% for AGIs $10k-25k, 0.5% for AGIs $25k-50k, 1.0% for AGIs $50k-75k, 0.4% for AGIs $75k-100k, 7.7% for AGIs over 100k)
Profit/loss from business: +$11,276 (reported on 18.4% of returns)
Here:
+$11,276
State:
+$14,267
(% of AGI for various income ranges: 26.4% for AGIs below $10k, 5.6% for AGIs $10k-25k, 5.1% for AGIs $25k-50k, 3.4% for AGIs $50k-75k, 20.0% for AGIs $75k-100k)
IRA payment deduction: $2,689 (reported on 4.5% of returns)
17086:
$2,689
Pennsylvania:
$2,903
Total itemized deductions: $14,136 (21% of AGI, reported on 21.1% of returns)
Here:
$14,136
State:
$18,804
Here:
21.1% of AGI
State:
19.5% of AGI
(% of AGI for various income ranges: 5.2% for AGIs $10k-25k, 7.0% for AGIs $25k-50k, 8.8% for AGIs $50k-75k, 12.3% for AGIs $75k-100k, 11.4% for AGIs over 100k)
Charity contributions deductions: $4,315 (6% of AGI, reported on 18.0% of returns)
Here:
$4,315
State:
$3,337
Here:
6.1% of AGI
State:
3.3% of AGI
(% of AGI for various income ranges: 1.0% for AGIs $10k-25k, 1.4% for AGIs $25k-50k, 1.4% for AGIs $50k-75k, 3.4% for AGIs $75k-100k, 5.5% for AGIs over 100k)
Total tax: $4,146 (reported on 75.0% of returns)
17086:
$4,146
State:
$8,008
(% of AGI for various income ranges: 5.3% for AGIs below $10k, 4.5% for AGIs $10k-25k, 6.3% for AGIs $25k-50k, 8.3% for AGIs $50k-75k, 10.3% for AGIs $75k-100k, 17.7% for AGIs over 100k)
Earned income credit: $1,380 (reported on 12.8% of returns)
Here:
$1,380
State:
$1,643
Percentage of individuals using paid preparers for their 2004 taxes: 66.1%
Here:
66%
State:
56%
(% for various income ranges: 60.8% for AGIs below $10k, 67.5% for AGIs $10k-25k, 67.7% for AGIs $25k-50k, 64.2% for AGIs $50k-75k, 68.2% for AGIs $75k-100k, 75.8% for AGIs over 100k)
Household received Food Stamps/SNAP in the past 12 months: 52 Household did not receive Food Stamps/SNAP in the past 12 months: 749
Women who had a birth in the past 12 months: 38 (22 now married, 14 unmarried) Women who did not have a birth in the past 12 months: 396 (193 now married, 201 unmarried)
Housing units in zip code 17086 with a mortgage: 288 (27 second mortgage, 26 both second mortgage and home equity loan) Houses without a mortgage: 14
Median monthly owner costs for units with a mortgage: $1,178 Median monthly owner costs for units without a mortgage: $490
Residents with income below the poverty level in 2022:
This zip code:
7.2%
Whole state:
11.8%
Residents with income below 50% of the poverty level in 2022:
This zip code:
4.3%
Whole state:
6.1%
Median number of rooms in houses and condos:
Here:
6.7
State:
6.8
Median number of rooms in apartments:
Here:
5.3
State:
4.3
Notable locations in this zip code not listed on our city pages
In group quarters: 39 (-1 institutionalized population)
Size of family households: 247 2-persons, 126 3-persons, 56 4-persons, 86 5-persons, 17 6-persons, 13 7-or-more-persons
Size of nonfamily households: 224 1-person, 32 2-persons
319 married couples with children.
67 single-parent households (49 men, 18 women).
96.3% of residents of 17086 zip code speak English at home.
0.1% of residents speak Spanish at home (100% well).
3.0% of residents speak other Indo-European language at home (63% very well, 37% well).
0.3% of residents speak Asian or Pacific Island language at home (100% very well).
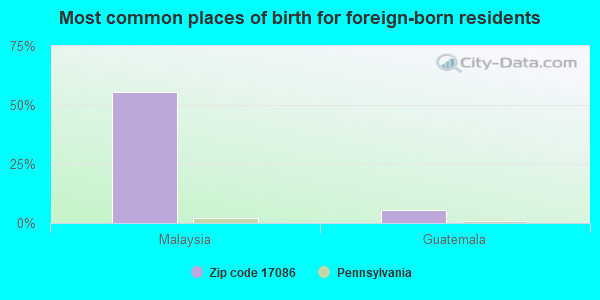
Foreign born population: 18 (0.9%) (56.6% of them are naturalized citizens)
This zip code:
0.9%
Whole state:
7.5%
56%Malaysia
6%Guatemala
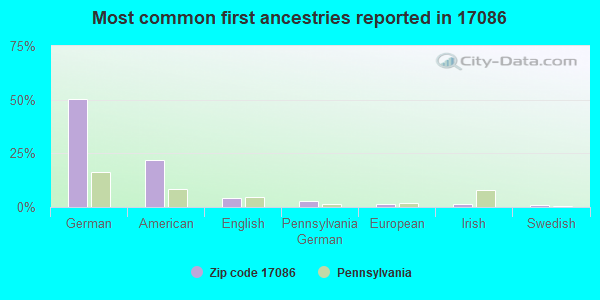
50%German
22%American
4%English
3%Pennsylvania German
1%European
1%Irish
1%Swedish
Year of entry for the foreign-born population
92010 or later
02000 to 2009
21990 to 1999
19Before 1990
Housing units lacking complete plumbing facilities: 3.8% Housing units lacking complete kitchen facilities: 4.3%
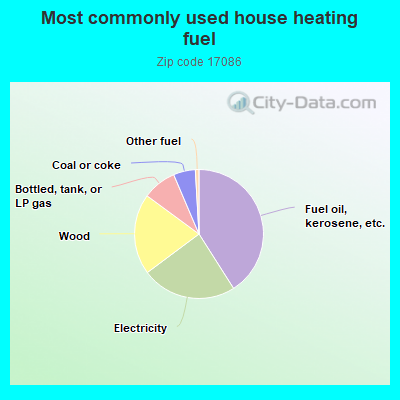
41.0%Fuel oil, kerosene, etc.
23.8%Electricity
20.3%Wood
8.5%Bottled, tank, or LP gas
5.5%Coal or coke
0.9%Other fuel
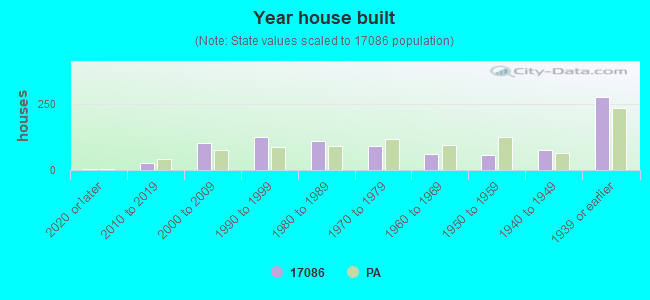
Population in 1990: 1,673. Population change in the 1990s: +753 (+45.0%).
Place of birth for U.S.-born residents:
This state: 1,885
Northeast: 89
Midwest: 46
South: 26
West: 47
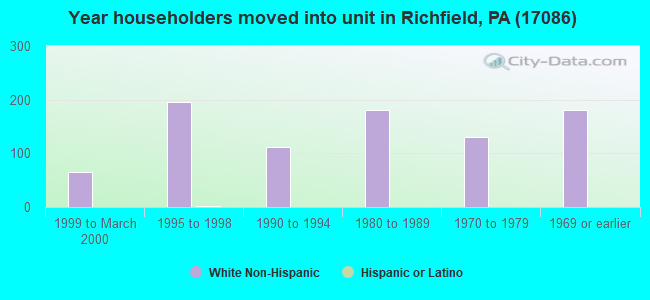
73% of the 17086 zip code residents lived in the same house 5 years ago. Out of people who lived in different houses, 52% lived in this county. Out of people who lived in different counties, 50% lived in Pennsylvania.
95% of the 17086 zip code residents lived in the same house 1 year ago. Out of people who lived in different houses, 56% moved from this county. Out of people who lived in different houses, 38% moved from different county within same state. Out of people who lived in different houses, 8% moved from abroad.
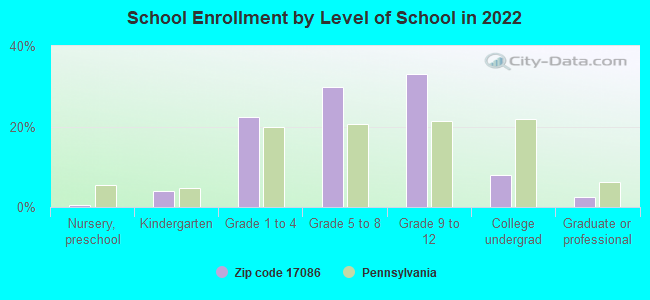
Private vs. public school enrollment:
Students in private schools in grades 1 to 8 (elementary and middle school): 65
Here:
37.2%
Pennsylvania:
15.7%
Students in private schools in grades 9 to 12 (high school): 19
Here:
17.5%
Pennsylvania:
13.4%
Students in private undergraduate colleges: 11
Here:
44.0%
Pennsylvania:
39.8%
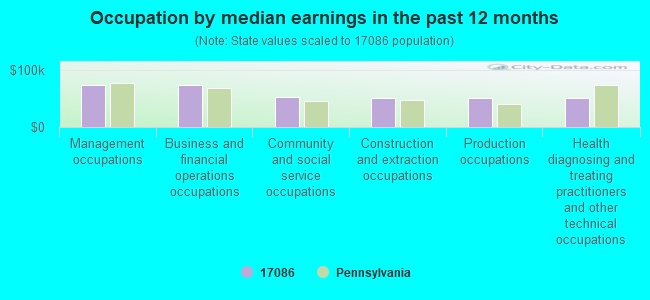
Occupation by median earnings in the past 12 months ($)
74,262Management occupations
73,726Business and financial operations occupations
53,177Community and social service occupations
51,697Construction and extraction occupations
51,200Production occupations
50,771Health diagnosing and treating practitioners and other technical occupations
Top industries in this zip code by the number of employees in 2005:
Health Care and Social Assistance: Nursing Care Facilities (50-99 employees: 1 establishment)
Accommodation and Food Services: Full-Service Restaurants (20-49: 1, 5-9: 1)

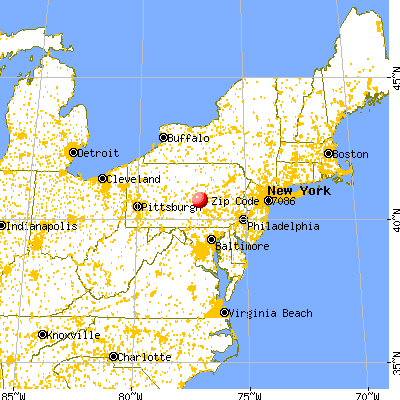


 Nearest zip codes: 17861, 17813, 17853, 17812, 17094, 17842.