Estimated zip code population in 2022: 2,437 Zip code population in 2010: 2,528 Zip code population in 2000: 2,568
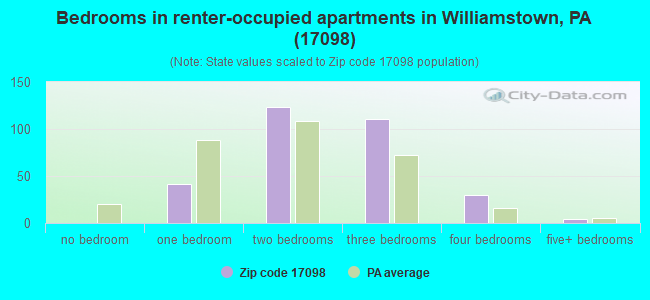
Houses and condos: 1,170 Renter-occupied apartments: 314
% of renters here:
29%
State:
31%
March 2022 cost of living index in zip code 17098: 93.3 (less than average, U.S. average is 100)
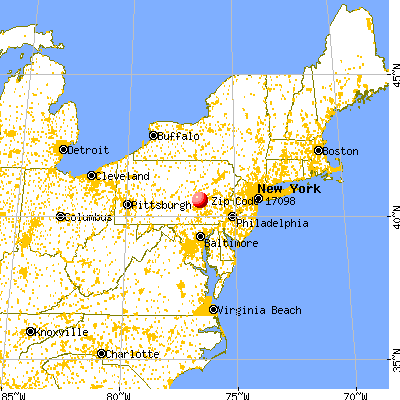
Land area: 9.7 sq. mi. Water area: 0.0 sq. mi.
Population density: 250 people per square mile
(very low).
OSM Map
General Map
Google Map
MSN Map
OSM Map
General Map
Google Map
MSN Map
OSM Map
General Map
Google Map
MSN Map
OSM Map
General Map
Google Map
MSN Map
Please wait while loading the map...
Real estate property taxes paid for housing units in 2022:
This zip code:
1.1% ($1,239)
Pennsylvania:
1.3% ($3,094)
Median real estate property taxes paid for housing units with mortgages in 2022: $1,223 (1.1%) Median real estate property taxes paid for housing units with no mortgage in 2022: $1,262 (1.1%)
Business Search- 14 Million verified businesses
Males: 1,196
(49.1%)
Females: 1,240
(50.9%)
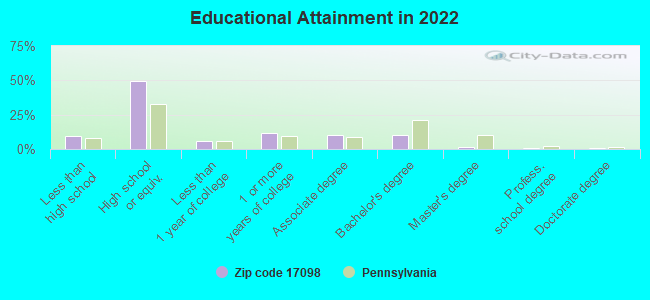
For population 25 years and over in 17098:
High school or higher: 88.8%
Bachelor's degree or higher: 12.7%
Graduate or professional degree: 2.4%
Unemployed: 8.7%
Mean travel time to work (commute): 34.2 minutes
For population 15 years and over in 17098:
Never married: 39.3%
Now married: 40.3%
Separated: 2.3%
Widowed: 7.6%
Divorced: 10.6%
Zip code 17098 compared to state average:
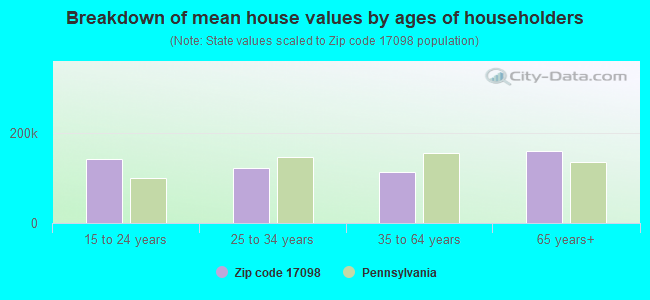
Median house value below state average.
Unemployed percentage above state average.
Black race population percentage significantly below state average.
Foreign-born population percentage significantly below state average.
Length of stay since moving in significantly above state average.
House age above state average.
Percentage of population with a bachelor's degree or higher significantly below state average.
Averages for the 2020 tax year for zip code 17098, filed in 2021:
Average Adjusted Gross Income (AGI) in 2020: $47,346 (Individual Income Tax Returns)
Here:
$47,346
State:
$75,707
Salary/wage: $40,887 (reported on 79.8% of returns)
Here:
$40,887
State:
$62,806
(% of AGI for various income ranges: 930.7% for AGIs below $25k, 3221.7% for AGIs $25k-50k, 5354.4% for AGIs $50k-75k, 7050.0% for AGIs $75k-100k, 12426.7% for AGIs $100k-200k)
Taxable interest for individuals: $823 (reported on 21.8% of returns)
This zip code:
$823
Pennsylvania:
$1,633
(% of AGI for various income ranges: 11.7% for AGIs below $25k, 22.4% for AGIs $25k-50k, 30.0% for AGIs $50k-75k, 49.0% for AGIs $75k-100k, 20.0% for AGIs $100k-200k)
Ordinary dividends: $876 (reported on 14.3% of returns)
Here:
$876
State:
$7,382
(% of AGI for various income ranges: 7.9% for AGIs below $25k, 10.7% for AGIs $25k-50k, 28.7% for AGIs $50k-75k, 28.0% for AGIs $75k-100k, 23.3% for AGIs $100k-200k)
Net capital gain/loss in AGI: +$1,410 (reported on 8.4% of returns)
Here:
+$1,410
State:
+$23,522
(% of AGI for various income ranges: 9.3% for AGIs below $25k, 67.5% for AGIs $50k-75k, 6.7% for AGIs $100k-200k)
Profit/loss from business: +$1,867 (reported on 5.0% of returns)
Here:
+$1,867
State:
+$16,274
(% of AGI for various income ranges: 32.4% for AGIs below $25k, 11.2% for AGIs $50k-75k)
Taxable individual retirement arrangement distribution: $13,085 (reported on 10.9% of returns)
17098:
$13,085
Pennsylvania:
$18,583
(% of AGI for various income ranges: 80.3% for AGIs below $25k, 111.0% for AGIs $25k-50k, 211.2% for AGIs $50k-75k, 808.0% for AGIs $75k-100k)
Earned income credit: $1,914 (reported on 17.6% of returns)
Here:
$1,914
State:
$2,100
(% of AGI for various income ranges: 73.8% for AGIs below $25k, 64.8% for AGIs $25k-50k)
Percentage of individuals using paid preparers for their 2020 taxes: 93.3%
Here:
93%
State:
92%
(% for various income ranges: 90.0% for AGIs below $25k, 97.1% for AGIs $25k-50k, 95.0% for AGIs $50k-75k, 91.7% for AGIs $75k-100k, 92.3% for AGIs $100k-200k)
Averages for the 2012 tax year for zip code 17098, filed in 2013:
Average Adjusted Gross Income (AGI) in 2012: $40,624 (Individual Income Tax Returns)
Here:
$40,624
State:
$61,346
Salary/wage: $37,026 (reported on 83.6% of returns)
Here:
$37,026
State:
$51,902
(% of AGI for various income ranges: 68.6% for AGIs below $25k, 81.8% for AGIs $25k-50k, 76.4% for AGIs $50k-75k, 72.2% for AGIs $75k-100k, 76.5% for AGIs $100k-200k)
Taxable interest for individuals: $809 (reported on 30.2% of returns)
This zip code:
$809
Pennsylvania:
$1,588
(% of AGI for various income ranges: 1.3% for AGIs below $25k, 0.8% for AGIs $25k-50k, 0.3% for AGIs $50k-75k, 0.8% for AGIs $75k-100k, 0.1% for AGIs $100k-200k)
Ordinary dividends: $933 (reported on 18.1% of returns)
Here:
$933
State:
$5,827
(% of AGI for various income ranges: 1.2% for AGIs below $25k, 0.4% for AGIs $25k-50k, 0.4% for AGIs $50k-75k, 0.4% for AGIs $75k-100k)
Profit/loss from business: +$2,950 (reported on 6.9% of returns)
Here:
+$2,950
State:
+$16,268
(% of AGI for various income ranges: 3.4% for AGIs below $25k, 0.9% for AGIs $25k-50k)
Taxable individual retirement arrangement distribution: $8,177 (reported on 11.2% of returns)
17098:
$8,177
Pennsylvania:
$14,550
(% of AGI for various income ranges: 3.4% for AGIs below $25k, 2.0% for AGIs $25k-50k, 2.2% for AGIs $50k-75k, 4.1% for AGIs $75k-100k)
Total itemized deductions: $14,675 (23% of AGI, reported on 13.8% of returns)
Here:
$14,675
State:
$23,538
Here:
23.1% of AGI
State:
18.4% of AGI
(% of AGI for various income ranges: 5.5% for AGIs $25k-50k, 4.9% for AGIs $50k-75k, 4.6% for AGIs $75k-100k, 8.1% for AGIs $100k-200k)
Charity contributions: $2,578 (reported on 7.8% of returns)
Here:
$2,578
State:
$4,025
(% of AGI for various income ranges: 0.5% for AGIs below $25k, 0.7% for AGIs $50k-75k, 0.7% for AGIs $75k-100k, 0.8% for AGIs $100k-200k)
Taxes paid: $4,194 (reported on 13.8% of returns)
17098:
$4,194
State:
$9,982
(% of AGI for various income ranges: 1.2% for AGIs $25k-50k, 1.5% for AGIs $50k-75k, 1.7% for AGIs $75k-100k, 2.4% for AGIs $100k-200k)
Earned income credit: $2,037 (reported on 16.4% of returns)
Here:
$2,037
State:
$2,106
(% of AGI for various income ranges: 4.8% for AGIs below $25k, 0.9% for AGIs $25k-50k)
Percentage of individuals using paid preparers for their 2012 taxes: 63.8%
Here:
64%
State:
53%
(% for various income ranges: 60.0% for AGIs below $25k, 63.9% for AGIs $25k-50k, 68.4% for AGIs $50k-75k, 70.0% for AGIs $75k-100k, 66.7% for AGIs $100k-200k)
Averages for the 2004 tax year for zip code 17098, filed in 2005:
Average Adjusted Gross Income (AGI) in 2004: $35,824 (Individual Income Tax Returns)
Here:
$35,824
State:
$48,049
Salary/wage: $34,665 (reported on 82.9% of returns)
Here:
$34,665
State:
$42,646
(% of AGI for various income ranges: 74.4% for AGIs below $10k, 68.4% for AGIs $10k-25k, 83.9% for AGIs $25k-50k, 80.2% for AGIs $50k-75k, 88.0% for AGIs $75k-100k, 70.8% for AGIs over 100k)
Taxable interest for individuals: $1,065 (reported on 40.9% of returns)
This zip code:
$1,065
Pennsylvania:
$1,657
(% of AGI for various income ranges: 4.0% for AGIs below $10k, 1.6% for AGIs $10k-25k, 1.2% for AGIs $25k-50k, 0.7% for AGIs $50k-75k, 2.0% for AGIs $75k-100k, 0.3% for AGIs over 100k)
Taxable dividends: $615 (reported on 23.8% of returns)
Here:
$615
State:
$3,566
(% of AGI for various income ranges: 1.1% for AGIs below $10k, 0.6% for AGIs $10k-25k, 0.4% for AGIs $25k-50k, 0.4% for AGIs $50k-75k, 0.2% for AGIs $75k-100k, 0.4% for AGIs over 100k)
Net capital gain/loss: +$2,045 (reported on 11.4% of returns)
Here:
+$2,045
State:
+$9,716
(% of AGI for various income ranges: -1.0% for AGIs below $10k, 0.9% for AGIs $10k-25k, 0.0% for AGIs $25k-50k, 0.0% for AGIs $50k-75k, 0.1% for AGIs $75k-100k, 4.9% for AGIs over 100k)
Profit/loss from business: +$4,565 (reported on 9.2% of returns)
Here:
+$4,565
State:
+$14,267
(% of AGI for various income ranges: 2.8% for AGIs below $10k, 2.2% for AGIs $10k-25k, 1.9% for AGIs $25k-50k, 0.8% for AGIs $50k-75k)
IRA payment deduction: $1,545 (reported on 1.9% of returns)
17098:
$1,545
Pennsylvania:
$2,903
Total itemized deductions: $12,451 (20% of AGI, reported on 14.8% of returns)
Here:
$12,451
State:
$18,804
Here:
19.9% of AGI
State:
19.5% of AGI
(% of AGI for various income ranges: 3.4% for AGIs $10k-25k, 4.7% for AGIs $25k-50k, 4.8% for AGIs $50k-75k, 6.9% for AGIs $75k-100k, 7.6% for AGIs over 100k)
Charity contributions deductions: $1,763 (3% of AGI, reported on 11.9% of returns)
Here:
$1,763
State:
$3,337
Here:
2.7% of AGI
State:
3.3% of AGI
(% of AGI for various income ranges: 0.6% for AGIs $25k-50k, 0.5% for AGIs $50k-75k, 0.5% for AGIs $75k-100k, 1.4% for AGIs over 100k)
Total tax: $4,086 (reported on 78.3% of returns)
17098:
$4,086
State:
$8,008
(% of AGI for various income ranges: 2.2% for AGIs below $10k, 4.4% for AGIs $10k-25k, 7.6% for AGIs $25k-50k, 9.3% for AGIs $50k-75k, 10.5% for AGIs $75k-100k, 15.9% for AGIs over 100k)
Earned income credit: $1,451 (reported on 13.1% of returns)
Here:
$1,451
State:
$1,643
Percentage of individuals using paid preparers for their 2004 taxes: 64.6%
Here:
65%
State:
56%
(% for various income ranges: 57.8% for AGIs below $10k, 72.4% for AGIs $10k-25k, 62.3% for AGIs $25k-50k, 70.5% for AGIs $50k-75k, 58.5% for AGIs $75k-100k, 52.8% for AGIs over 100k)
Household received Food Stamps/SNAP in the past 12 months: 243 Household did not receive Food Stamps/SNAP in the past 12 months: 836
Women who had a birth in the past 12 months: 7 (3 now married, 3 unmarried) Women who did not have a birth in the past 12 months: 574 (174 now married, 402 unmarried)
Housing units in zip code 17098 with a mortgage: 383 (44 second mortgage, 31 both second mortgage and home equity loan) Houses without a mortgage: 21
Median monthly owner costs for units with a mortgage: $1,043 Median monthly owner costs for units without a mortgage: $442
Residents with income below the poverty level in 2022:
This zip code:
19.1%
Whole state:
11.8%
Residents with income below 50% of the poverty level in 2022:
This zip code:
9.1%
Whole state:
6.1%
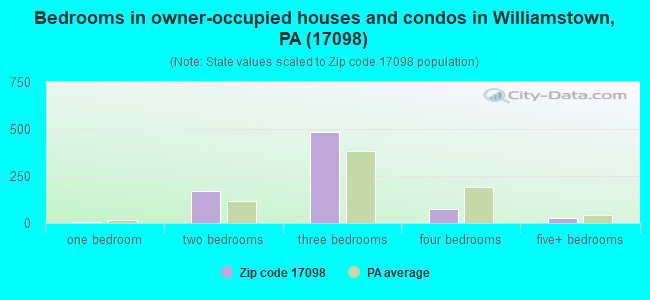
Median number of rooms in houses and condos:
Here:
6.5
State:
6.8
Median number of rooms in apartments:
Here:
5.2
State:
4.3
Notable locations in this zip code not listed on our city pages
Size of family households: 280 2-persons, 234 3-persons, 30 4-persons, 61 5-persons, 24 6-persons, 5 7-or-more-persons
Size of nonfamily households: 320 1-person, 121 2-persons
210 married couples with children.
246 single-parent households (46 men, 200 women).
95.2% of residents of 17098 zip code speak English at home.
3.8% of residents speak Spanish at home (73% very well, 27% not well).
0.3% of residents speak Asian or Pacific Island language at home (33% very well, 67% well).
0.1% of residents speak other language at home (100% well).
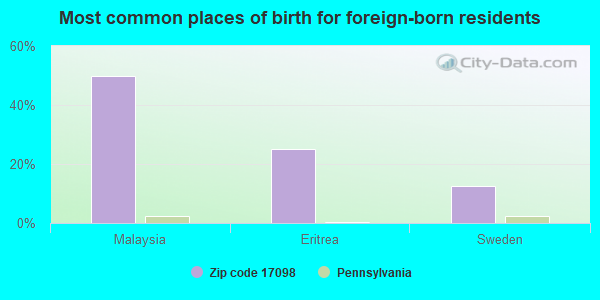
Foreign born population: 8 (0.3%) (75.8% of them are naturalized citizens)
This zip code:
0.3%
Whole state:
7.5%
50%Malaysia
25%Eritrea
12%Sweden
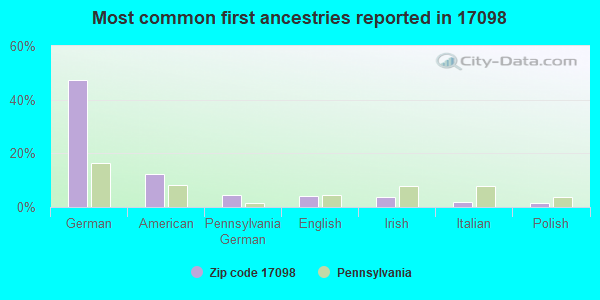
47%German
12%American
5%Pennsylvania German
4%English
4%Irish
2%Italian
2%Polish
Year of entry for the foreign-born population
432010 or later
42000 to 2009
191990 to 1999
8Before 1990
Facilities with environmental interests located in this zip code:
AMP WILLIAMSTOWN CONNECTOR PLT (700 W BROAD STREET in WILLIAMSTOWN, PA)
STATE MASTER (Pennsylvania database) - RCRIS-PAD041895749, HAZARDOUS WASTE PROGRAM National Pollutant Discharge Elimination System NON-MAJOR (Tracking pollutant discharge elimination systems) - permit HAZARDOUS WASTE BIENNIAL REPORTER (Resource Conservation and Recovery Act (tracking hazardous waste)) Large Quantity Generators, more that 1000 kg of hazardous waste/month (Resource Conservation and Recovery Act (tracking hazardous waste)) - notification TRI REPORTER (Tracking of toxic chemicals releasing facilities) Business SIC classification: CURRENT-CARRYING WIRING DEVICES; ELECTRONIC CONNECTORS; ELECTRONIC COMPONENTS Business NAICS classification: OTHER ELECTRONIC COMPONENT MANUFACTURING.; CURRENT-CARRYING WIRING DEVICE MANUFACTURING. Organizations: AMP INCORPORATED (CONTACT/OPERATOR)
Alternative names: A M P INC, AMP INC. BLDG. 14, C/O AMP BLDG. 277, TYCO ELECTRONICS CORP, TYCO ELECTRONICS CORP. BUILDING 014, TYCO ELECTRONICS CORP - WILLIA
Housing units lacking complete plumbing facilities: 1.9% Housing units lacking complete kitchen facilities: 2.7%
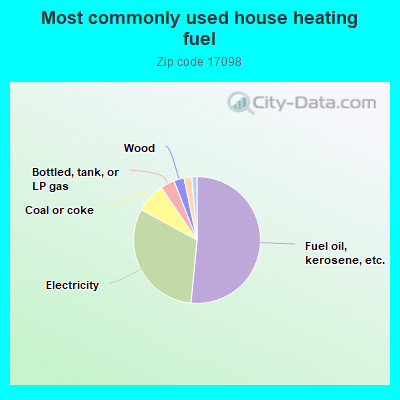
51.7%Fuel oil, kerosene, etc.
31.5%Electricity
7.6%Coal or coke
3.6%Bottled, tank, or LP gas
2.6%Wood
2.0%Other fuel
1.3%Utility gas
Population in 1990: 2,655.
Place of birth for U.S.-born residents:
This state: 2,000
Northeast: 197
Midwest: 18
South: 77
West: 59
70% of the 17098 zip code residents lived in the same house 5 years ago. Out of people who lived in different houses, 61% lived in this county. Out of people who lived in different counties, 50% lived in Pennsylvania.
90% of the 17098 zip code residents lived in the same house 1 year ago. Out of people who lived in different houses, 57% moved from this county. Out of people who lived in different houses, 17% moved from different county within same state. Out of people who lived in different houses, 24% moved from different state.
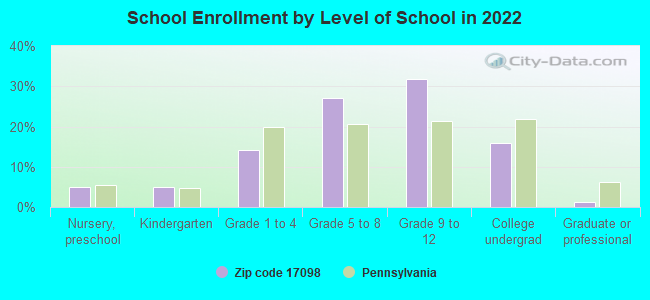
Private vs. public school enrollment:
Students in private schools in grades 1 to 8 (elementary and middle school): 33
Here:
15.0%
Pennsylvania:
15.7%
Students in private schools in grades 9 to 12 (high school): 51
Here:
29.6%
Pennsylvania:
13.4%
Students in private undergraduate colleges: 4
Here:
4.8%
Pennsylvania:
39.8%
Occupation by median earnings in the past 12 months ($)
76,818Health diagnosing and treating practitioners and other technical occupations
75,350Architecture and engineering occupations
64,276Business and financial operations occupations
61,956Law enforcement workers including supervisors
59,614Computer and mathematical occupations
58,667Management occupations
Top industries in this zip code by the number of employees in 2005:
Other Services (except Public Administration): Civic and Social Organizations (10-19 employees: 1 establishment)
Other Services (except Public Administration): Religious Organizations (5-9: 1, 1-4: 1)
Finance and Insurance: Commercial Banking (5-9: 1)
Finance and Insurance: Insurance Agencies and Brokerages (5-9: 1)
Health Care and Social Assistance: Child Day Care Services (5-9: 1)
Construction: All Other Specialty Trade Contractors (1-4: 1)
Health Care and Social Assistance: Offices of Chiropractors (1-4: 1)
Fatal accident statistics in 2010:
Fatal accident count: 1
Vehicles involved in fatal accidents: 2
Fatal accidents caused by drunken drivers: 0
Fatalities: 1
Persons involved in fatal accidents: 3
Pedestrians involved in fatal accidents: 0
Home Mortgage Disclosure Act Aggregated Statistics For Year 2009 (Based on 2 full tracts)
A) FHA, FSA/RHS & VA Home Purchase Loans
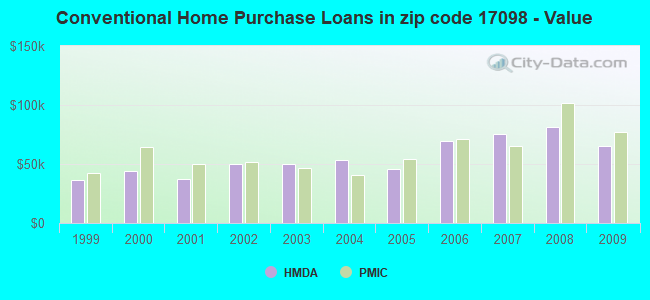
B) Conventional Home Purchase Loans
C) Refinancings
D) Home Improvement Loans
F) Non-occupant Loans on < 5 Family Dwellings (A B C & D)
G) Loans On Manufactured Home Dwelling (A B C & D)
Number
Average Value
Number
Average Value
Number
Average Value
Number
Average Value
Number
Average Value
Number
Average Value
LOANS ORIGINATED
22
$67,428
20
$65,474
44
$94,871
32
$32,237
12
$60,309
4
$82,468
APPLICATIONS APPROVED, NOT ACCEPTED
0
$0
0
$0
2
$75,970
2
$9,995
0
$0
0
$0
APPLICATIONS DENIED
0
$0
12
$56,478
40
$81,518
10
$52,979
2
$52,980
0
$0
APPLICATIONS WITHDRAWN
0
$0
0
$0
22
$75,152
0
$0
0
$0
0
$0
FILES CLOSED FOR INCOMPLETENESS
0
$0
0
$0
2
$111,955
0
$0
0
$0
0
$0
Aggregated Statistics For Year 2008 (Based on 2 full tracts)
A) FHA, FSA/RHS & VA Home Purchase Loans
B) Conventional Home Purchase Loans
C) Refinancings
D) Home Improvement Loans
E) Loans on Dwellings For 5+ Families
F) Non-occupant Loans on < 5 Family Dwellings (A B C & D)
G) Loans On Manufactured Home Dwelling (A B C & D)
Number
Average Value
Number
Average Value
Number
Average Value
Number
Average Value
Number
Average Value
Number
Average Value
Number
Average Value
LOANS ORIGINATED
10
$98,161
34
$81,556
66
$65,974
40
$34,236
4
$162,435
18
$76,303
0
$0
APPLICATIONS APPROVED, NOT ACCEPTED
2
$83,965
0
$0
4
$53,978
10
$27,789
0
$0
0
$0
0
$0
APPLICATIONS DENIED
2
$69,970
8
$44,732
86
$78,155
18
$30,877
0
$0
2
$59,975
6
$40,317
APPLICATIONS WITHDRAWN
2
$50,980
0
$0
16
$108,831
4
$94,962
0
$0
0
$0
0
$0
FILES CLOSED FOR INCOMPLETENESS
0
$0
0
$0
2
$120,950
2
$130,950
0
$0
0
$0
0
$0
Aggregated Statistics For Year 2007 (Based on 2 full tracts)
A) FHA, FSA/RHS & VA Home Purchase Loans
B) Conventional Home Purchase Loans
C) Refinancings
D) Home Improvement Loans
F) Non-occupant Loans on < 5 Family Dwellings (A B C & D)
G) Loans On Manufactured Home Dwelling (A B C & D)
Number
Average Value
Number
Average Value
Number
Average Value
Number
Average Value
Number
Average Value
Number
Average Value
LOANS ORIGINATED
12
$78,302
62
$75,389
68
$55,537
26
$34,986
12
$49,313
2
$19,990
APPLICATIONS APPROVED, NOT ACCEPTED
2
$72,970
0
$0
22
$81,876
6
$29,988
2
$99,960
0
$0
APPLICATIONS DENIED
0
$0
18
$56,200
132
$81,195
34
$46,158
2
$3,000
8
$85,716
APPLICATIONS WITHDRAWN
0
$0
10
$73,970
42
$102,626
6
$74,970
0
$0
0
$0
FILES CLOSED FOR INCOMPLETENESS
0
$0
6
$66,640
10
$90,764
2
$14,995
0
$0
0
$0
Aggregated Statistics For Year 2006 (Based on 2 full tracts)
A) FHA, FSA/RHS & VA Home Purchase Loans
B) Conventional Home Purchase Loans
C) Refinancings
D) Home Improvement Loans
F) Non-occupant Loans on < 5 Family Dwellings (A B C & D)
G) Loans On Manufactured Home Dwelling (A B C & D)
Number
Average Value
Number
Average Value
Number
Average Value
Number
Average Value
Number
Average Value
Number
Average Value
LOANS ORIGINATED
14
$76,255
64
$69,847
82
$70,167
46
$31,900
24
$41,817
2
$51,980
APPLICATIONS APPROVED, NOT ACCEPTED
0
$0
4
$62,475
8
$60,975
4
$25,990
4
$42,482
0
$0
APPLICATIONS DENIED
0
$0
14
$77,541
122
$82,606
42
$55,168
6
$38,318
0
$0
APPLICATIONS WITHDRAWN
0
$0
4
$74,470
32
$62,162
10
$96,361
0
$0
0
$0
FILES CLOSED FOR INCOMPLETENESS
0
$0
2
$79,970
8
$82,966
0
$0
0
$0
0
$0
Aggregated Statistics For Year 2005 (Based on 2 full tracts)
A) FHA, FSA/RHS & VA Home Purchase Loans
B) Conventional Home Purchase Loans
C) Refinancings
D) Home Improvement Loans
E) Loans on Dwellings For 5+ Families
F) Non-occupant Loans on < 5 Family Dwellings (A B C & D)
G) Loans On Manufactured Home Dwelling (A B C & D)
Number
Average Value
Number
Average Value
Number
Average Value
Number
Average Value
Number
Average Value
Number
Average Value
Number
Average Value
LOANS ORIGINATED
6
$86,632
56
$46,053
102
$58,094
54
$35,319
2
$179,930
26
$48,135
0
$0
APPLICATIONS APPROVED, NOT ACCEPTED
0
$0
4
$65,972
14
$79,825
8
$27,989
0
$0
0
$0
2
$41,985
APPLICATIONS DENIED
0
$0
14
$49,266
142
$74,745
20
$35,086
0
$0
8
$31,488
6
$66,640
APPLICATIONS WITHDRAWN
2
$32,985
10
$41,783
72
$69,833
10
$32,987
0
$0
2
$51,980
2
$79,970
FILES CLOSED FOR INCOMPLETENESS
0
$0
0
$0
24
$106,124
2
$47,980
0
$0
2
$64,975
0
$0
Aggregated Statistics For Year 2004 (Based on 2 full tracts)
A) FHA, FSA/RHS & VA Home Purchase Loans
B) Conventional Home Purchase Loans
C) Refinancings
D) Home Improvement Loans
E) Loans on Dwellings For 5+ Families
F) Non-occupant Loans on < 5 Family Dwellings (A B C & D)
G) Loans On Manufactured Home Dwelling (A B C & D)
Number
Average Value
Number
Average Value
Number
Average Value
Number
Average Value
Number
Average Value
Number
Average Value
Number
Average Value
LOANS ORIGINATED
6
$56,643
54
$53,719
112
$57,281
38
$24,832
2
$231,905
20
$57,077
6
$18,992
APPLICATIONS APPROVED, NOT ACCEPTED
0
$0
6
$51,313
14
$63,831
2
$49,980
0
$0
2
$59,975
0
$0
APPLICATIONS DENIED
0
$0
14
$46,410
96
$66,536
24
$37,902
0
$0
4
$70,972
0
$0
APPLICATIONS WITHDRAWN
2
$55,980
6
$87,298
78
$72,407
4
$35,485
0
$0
6
$59,643
2
$139,945
FILES CLOSED FOR INCOMPLETENESS
0
$0
2
$63,975
8
$54,728
4
$108,958
0
$0
0
$0
0
$0
Aggregated Statistics For Year 2003 (Based on 2 full tracts)
B) Conventional Home Purchase Loans
C) Refinancings
D) Home Improvement Loans
F) Non-occupant Loans on < 5 Family Dwellings (A B C & D)
Number
Average Value
Number
Average Value
Number
Average Value
Number
Average Value
LOANS ORIGINATED
52
$49,865
118
$66,584
38
$27,042
10
$41,583
APPLICATIONS APPROVED, NOT ACCEPTED
4
$50,480
18
$87,743
8
$24,240
2
$67,975
APPLICATIONS DENIED
22
$51,161
86
$69,925
14
$13,138
4
$29,488
APPLICATIONS WITHDRAWN
6
$70,305
88
$74,970
6
$26,323
0
$0
FILES CLOSED FOR INCOMPLETENESS
4
$80,968
14
$86,537
0
$0
0
$0
Aggregated Statistics For Year 2002 (Based on 2 full tracts)
A) FHA, FSA/RHS & VA Home Purchase Loans
B) Conventional Home Purchase Loans
C) Refinancings
D) Home Improvement Loans
F) Non-occupant Loans on < 5 Family Dwellings (A B C & D)
Number
Average Value
Number
Average Value
Number
Average Value
Number
Average Value
Number
Average Value
LOANS ORIGINATED
2
$72,970
32
$50,230
94
$64,676
36
$23,768
2
$15,995
APPLICATIONS APPROVED, NOT ACCEPTED
0
$0
2
$16,995
24
$62,725
6
$30,655
0
$0
APPLICATIONS DENIED
0
$0
6
$33,987
74
$71,161
18
$13,550
0
$0
APPLICATIONS WITHDRAWN
0
$0
0
$0
64
$65,880
0
$0
2
$39,985
FILES CLOSED FOR INCOMPLETENESS
0
$0
2
$235,905
20
$103,758
0
$0
2
$28,990
Aggregated Statistics For Year 2001 (Based on 2 full tracts)
A) FHA, FSA/RHS & VA Home Purchase Loans
B) Conventional Home Purchase Loans
C) Refinancings
D) Home Improvement Loans
F) Non-occupant Loans on < 5 Family Dwellings (A B C & D)
Number
Average Value
Number
Average Value
Number
Average Value
Number
Average Value
Number
Average Value
LOANS ORIGINATED
6
$83,967
30
$37,118
114
$52,488
36
$26,267
10
$34,986
APPLICATIONS APPROVED, NOT ACCEPTED
0
$0
4
$32,988
24
$56,478
2
$19,990
2
$54,980
APPLICATIONS DENIED
0
$0
2
$31,985
92
$62,714
24
$22,407
4
$42,982
APPLICATIONS WITHDRAWN
2
$20,990
6
$59,310
70
$69,287
4
$1,000
4
$37,485
FILES CLOSED FOR INCOMPLETENESS
0
$0
0
$0
12
$63,475
0
$0
0
$0
Aggregated Statistics For Year 2000 (Based on 2 full tracts)
A) FHA, FSA/RHS & VA Home Purchase Loans
B) Conventional Home Purchase Loans
C) Refinancings
D) Home Improvement Loans
E) Loans on Dwellings For 5+ Families
F) Non-occupant Loans on < 5 Family Dwellings (A B C & D)
Number
Average Value
Number
Average Value
Number
Average Value
Number
Average Value
Number
Average Value
Number
Average Value
LOANS ORIGINATED
16
$58,851
36
$43,927
54
$60,198
32
$13,744
2
$174,930
2
$12,995
APPLICATIONS APPROVED, NOT ACCEPTED
0
$0
0
$0
16
$33,487
8
$26,490
0
$0
0
$0
APPLICATIONS DENIED
0
$0
6
$43,317
70
$53,550
24
$20,242
0
$0
2
$69,970
APPLICATIONS WITHDRAWN
2
$34,985
2
$62,975
22
$39,530
0
$0
0
$0
0
$0
FILES CLOSED FOR INCOMPLETENESS
0
$0
0
$0
16
$56,478
0
$0
0
$0
0
$0
Aggregated Statistics For Year 1999 (Based on 1 full tract)
A) FHA, FSA/RHS & VA Home Purchase Loans
B) Conventional Home Purchase Loans
C) Refinancings
D) Home Improvement Loans
F) Non-occupant Loans on < 5 Family Dwellings (A B C & D)
Detailed PMIC statistics for the following Tracts:0249.00
2006 - 2018 National Fire Incident Reporting System (NFIRS) incidents
Based on the data from the years 2006 - 2018 the average number of fire incidents per year is 8. The highest number of fires - 19 took place in 2017, and the least - 2 in 2007. The data has a growing trend.
When looking into fire subcategories, the most reports belonged to: Structure Fires (81.9%), and Outside Fires (15.2%).
Fire incident types reported to NFIRS in Zip Code 17098


 Nearest zip codes: 17978, 17097, 17968, 17980, 17030, 17941.


 Based on the data from the years 2006 - 2018 the average number of fire incidents per year is 8. The highest number of fires - 19 took place in 2017, and the least - 2 in 2007. The data has a growing trend.
 When looking into fire subcategories, the most reports belonged to: Structure Fires (81.9%), and Outside Fires (15.2%).