Estimated zip code population in 2022: 770 Zip code population in 2010: 925 Zip code population in 2000: 906
Houses and condos: 432 Renter-occupied apartments: 54
% of renters here:
17%
State:
31%
March 2022 cost of living index in zip code 17097: 93.8 (less than average, U.S. average is 100)
Land area: 3.0 sq. mi. Water area: 0.0 sq. mi.
Population density: 255 people per square mile
(very low).
OSM Map
General Map
Google Map
MSN Map
OSM Map
General Map
Google Map
MSN Map
OSM Map
General Map
Google Map
MSN Map
OSM Map
General Map
Google Map
MSN Map
Please wait while loading the map...
Real estate property taxes paid for housing units in 2022:
This zip code:
1.2% ($1,041)
Pennsylvania:
1.3% ($3,094)
Median real estate property taxes paid for housing units with mortgages in 2022: $954 (0.9%) Median real estate property taxes paid for housing units with no mortgage in 2022: $1,111 (1.4%)
Business Search- 14 Million verified businesses
Males: 413
(53.6%)
Females: 357
(46.4%)
For population 25 years and over in 17097:
High school or higher: 81.4%
Bachelor's degree or higher: 7.0%
Graduate or professional degree: 2.6%
Unemployed: 7.4%
Mean travel time to work (commute): 36.4 minutes
For population 15 years and over in 17097:
Never married: 28.7%
Now married: 57.9%
Separated: 0.0%
Widowed: 4.0%
Divorced: 9.4%
Zip code 17097 compared to state average:
Median house value significantly below state average.
Unemployed percentage above state average.
Black race population percentage significantly below state average.
Hispanic race population percentage significantly below state average.
Median age below state average.
Foreign-born population percentage significantly below state average.
Renting percentage below state average.
Length of stay since moving in below state average.
House age above state average.
Number of college students below state average.
Percentage of population with a bachelor's degree or higher significantly below state average.
Averages for the 2004 tax year for zip code 17097, filed in 2005:
Average Adjusted Gross Income (AGI) in 2004: $34,156 (Individual Income Tax Returns)
Here:
$34,156
State:
$48,049
Salary/wage: $33,538 (reported on 83.2% of returns)
Here:
$33,538
State:
$42,646
(% of AGI for various income ranges: 60.3% for AGIs below $10k, 68.4% for AGIs $10k-25k, 82.7% for AGIs $25k-50k, 87.2% for AGIs $50k-75k, 82.6% for AGIs $75k-100k)
Taxable interest for individuals: $645 (reported on 44.0% of returns)
This zip code:
$645
Pennsylvania:
$1,657
(% of AGI for various income ranges: 3.0% for AGIs below $10k, 3.0% for AGIs $10k-25k, 0.6% for AGIs $25k-50k, 0.4% for AGIs $50k-75k, 0.2% for AGIs $75k-100k)
Taxable dividends: $398 (reported on 21.2% of returns)
Here:
$398
State:
$3,566
(% of AGI for various income ranges: 2.1% for AGIs below $10k, 0.2% for AGIs $10k-25k, 0.3% for AGIs $25k-50k, 0.2% for AGIs $50k-75k)
Net capital gain/loss: +$471 (reported on 8.2% of returns)
Here:
+$471
State:
+$9,716
Profit/loss from business: +$1,889 (reported on 8.7% of returns)
Here:
+$1,889
State:
+$14,267
Total itemized deductions: $11,783 (19% of AGI, reported on 11.1% of returns)
Here:
$11,783
State:
$18,804
Here:
18.6% of AGI
State:
19.5% of AGI
Charity contributions deductions: $2,032 (3% of AGI, reported on 7.5% of returns)
Here:
$2,032
State:
$3,337
Here:
2.9% of AGI
State:
3.3% of AGI
Total tax: $3,443 (reported on 77.6% of returns)
17097:
$3,443
State:
$8,008
(% of AGI for various income ranges: 2.4% for AGIs below $10k, 4.2% for AGIs $10k-25k, 6.2% for AGIs $25k-50k, 9.4% for AGIs $50k-75k, 12.2% for AGIs $75k-100k)
Earned income credit: $1,232 (reported on 13.5% of returns)
Here:
$1,232
State:
$1,643
Percentage of individuals using paid preparers for their 2004 taxes: 64.2%
Here:
64%
State:
56%
(% for various income ranges: 71.0% for AGIs below $10k, 65.4% for AGIs $10k-25k, 60.8% for AGIs $25k-50k, 61.6% for AGIs $50k-75k, 66.7% for AGIs $75k-100k)
Household received Food Stamps/SNAP in the past 12 months: 45 Household did not receive Food Stamps/SNAP in the past 12 months: 272
Women who had a birth in the past 12 months: 22 (17 now married, 5 unmarried) Women who did not have a birth in the past 12 months: 114 (36 now married, 78 unmarried)
Housing units in zip code 17097 with a mortgage: 127 (3 second mortgage, 3 both second mortgage and home equity loan) Houses without a mortgage: 19
Median monthly owner costs for units with a mortgage: $1,085 Median monthly owner costs for units without a mortgage: $515
Residents with income below the poverty level in 2022:
This zip code:
13.8%
Whole state:
11.8%
Residents with income below 50% of the poverty level in 2022:
This zip code:
4.2%
Whole state:
6.1%
Median number of rooms in houses and condos:
Here:
6.4
State:
6.8
Median number of rooms in apartments:
Here:
6.9
State:
4.3
Notable locations in this zip code not listed on our city pages
Size of family households: 142 2-persons, 37 3-persons, 25 4-persons, 13 5-persons, 18 7-or-more-persons
Size of nonfamily households: 67 1-person, 13 2-persons, 2 3-persons
135 married couples with children.
83 single-parent households (7 men, 76 women).
99.3% of residents of 17097 zip code speak English at home.
Foreign born population: 22 (2.9%) (100.0% of them are naturalized citizens)
This zip code:
2.9%
Whole state:
7.5%
100%Malaysia
43%German
24%American
11%Irish
5%Pennsylvania German
3%English
3%Scottish
2%Polish
Year of entry for the foreign-born population
102010 or later
112000 to 2009
01990 to 1999
0Before 1990
Housing units lacking complete plumbing facilities: 7.7% Housing units lacking complete kitchen facilities: 12.7%
56.8%Fuel oil, kerosene, etc.
18.4%Coal or coke
16.5%Electricity
6.1%Bottled, tank, or LP gas
2.9%Wood
Population in 1990: 1,702.
Place of birth for U.S.-born residents:
This state: 716
Northeast: 10
South: 14
West: 1
71% of the 17097 zip code residents lived in the same house 5 years ago. Out of people who lived in different houses, 62% lived in this county. Out of people who lived in different counties, 50% lived in Pennsylvania.
100% of the 17097 zip code residents lived in the same house 1 year ago. Out of people who lived in different houses, 150% moved from this county.
Private vs. public school enrollment:
Students in private schools in grades 1 to 8 (elementary and middle school): 18
Here:
19.5%
Pennsylvania:
15.7%
Students in private schools in grades 9 to 12 (high school): 16
Here:
32.8%
Pennsylvania:
13.4%
Students in private undergraduate colleges: 4
Here:
35.2%
Pennsylvania:
39.8%
Occupation by median earnings in the past 12 months ($)
69,964Installation, maintenance, and repair occupations
45,953Construction and extraction occupations
44,800Material moving occupations
42,198Production occupations
32,913Office and administrative support occupations
30,616Sales and related occupations
Top industries in this zip code by the number of employees in 2005:
Wholesale Trade: Coal and Other Mineral and Ore Merchant Wholesalers (20-49 employees: 1 establishment)
Other Services (except Public Administration): Cemeteries and Crematories (1-4: 1)
Mining: Support Activities for Oil and Gas Operations (1-4: 1)
Other Services (except Public Administration): General Automotive Repair (1-4: 1)
Construction: New Single-Family Housing Construction (except Operative Builders) (1-4: 1)
Home Mortgage Disclosure Act Aggregated Statistics For Year 2009 (Based on 2 partial tracts)
A) FHA, FSA/RHS & VA Home Purchase Loans
B) Conventional Home Purchase Loans
C) Refinancings
D) Home Improvement Loans
F) Non-occupant Loans on < 5 Family Dwellings (A B C & D)
G) Loans On Manufactured Home Dwelling (A B C & D)
Number
Average Value
Number
Average Value
Number
Average Value
Number
Average Value
Number
Average Value
Number
Average Value
LOANS ORIGINATED
7
$88,101
3
$49,817
22
$74,011
9
$27,047
5
$55,862
1
$65,260
APPLICATIONS APPROVED, NOT ACCEPTED
1
$63,950
0
$0
3
$73,743
1
$650
0
$0
0
$0
APPLICATIONS DENIED
2
$65,915
1
$49,600
23
$87,902
4
$31,815
1
$26,100
1
$73,090
APPLICATIONS WITHDRAWN
1
$54,170
2
$33,285
12
$67,163
0
$0
1
$46,990
0
$0
FILES CLOSED FOR INCOMPLETENESS
1
$95,930
0
$0
0
$0
0
$0
0
$0
0
$0
Aggregated Statistics For Year 2008 (Based on 2 partial tracts)
A) FHA, FSA/RHS & VA Home Purchase Loans
B) Conventional Home Purchase Loans
C) Refinancings
D) Home Improvement Loans
E) Loans on Dwellings For 5+ Families
F) Non-occupant Loans on < 5 Family Dwellings (A B C & D)
Number
Average Value
Number
Average Value
Number
Average Value
Number
Average Value
Number
Average Value
Number
Average Value
LOANS ORIGINATED
6
$90,277
10
$221,884
25
$74,527
16
$30,346
1
$78,310
6
$297,042
APPLICATIONS APPROVED, NOT ACCEPTED
1
$82,230
1
$60,690
5
$83,924
1
$20,880
0
$0
1
$79,620
APPLICATIONS DENIED
1
$58,080
5
$33,804
31
$85,301
12
$45,791
0
$0
4
$43,398
APPLICATIONS WITHDRAWN
1
$49,600
2
$37,850
12
$72,602
1
$56,780
0
$0
1
$34,590
FILES CLOSED FOR INCOMPLETENESS
0
$0
0
$0
1
$125,300
1
$30,020
0
$0
0
$0
Aggregated Statistics For Year 2007 (Based on 2 partial tracts)
A) FHA, FSA/RHS & VA Home Purchase Loans
B) Conventional Home Purchase Loans
C) Refinancings
D) Home Improvement Loans
F) Non-occupant Loans on < 5 Family Dwellings (A B C & D)
G) Loans On Manufactured Home Dwelling (A B C & D)
Number
Average Value
Number
Average Value
Number
Average Value
Number
Average Value
Number
Average Value
Number
Average Value
LOANS ORIGINATED
5
$80,662
17
$79,195
28
$68,546
27
$27,796
10
$77,659
2
$45,680
APPLICATIONS APPROVED, NOT ACCEPTED
0
$0
3
$47,423
5
$96,324
1
$16,970
0
$0
0
$0
APPLICATIONS DENIED
1
$63,300
5
$69,568
29
$85,086
14
$54,492
0
$0
1
$32,630
APPLICATIONS WITHDRAWN
0
$0
3
$99,630
11
$90,415
3
$83,967
0
$0
0
$0
FILES CLOSED FOR INCOMPLETENESS
0
$0
2
$53,185
3
$88,537
1
$125,300
0
$0
0
$0
Aggregated Statistics For Year 2006 (Based on 2 partial tracts)
A) FHA, FSA/RHS & VA Home Purchase Loans
B) Conventional Home Purchase Loans
C) Refinancings
D) Home Improvement Loans
E) Loans on Dwellings For 5+ Families
F) Non-occupant Loans on < 5 Family Dwellings (A B C & D)
G) Loans On Manufactured Home Dwelling (A B C & D)
Number
Average Value
Number
Average Value
Number
Average Value
Number
Average Value
Number
Average Value
Number
Average Value
Number
Average Value
LOANS ORIGINATED
5
$55,862
24
$56,586
34
$58,369
19
$37,233
1
$76,350
7
$30,393
1
$650
APPLICATIONS APPROVED, NOT ACCEPTED
0
$0
3
$61,343
2
$42,095
1
$30,670
0
$0
0
$0
0
$0
APPLICATIONS DENIED
0
$0
8
$68,605
42
$73,899
16
$48,822
0
$0
4
$60,040
1
$18,930
APPLICATIONS WITHDRAWN
1
$34,590
2
$58,080
17
$76,930
2
$42,420
0
$0
1
$123,990
0
$0
FILES CLOSED FOR INCOMPLETENESS
0
$0
2
$67,870
7
$87,076
1
$84,840
0
$0
0
$0
0
$0
Aggregated Statistics For Year 2005 (Based on 2 partial tracts)
A) FHA, FSA/RHS & VA Home Purchase Loans
B) Conventional Home Purchase Loans
C) Refinancings
D) Home Improvement Loans
E) Loans on Dwellings For 5+ Families
F) Non-occupant Loans on < 5 Family Dwellings (A B C & D)
G) Loans On Manufactured Home Dwelling (A B C & D)
Number
Average Value
Number
Average Value
Number
Average Value
Number
Average Value
Number
Average Value
Number
Average Value
Number
Average Value
LOANS ORIGINATED
1
$46,990
26
$62,700
42
$62,308
22
$19,964
1
$261,040
4
$61,835
3
$65,260
APPLICATIONS APPROVED, NOT ACCEPTED
0
$0
1
$24,150
8
$88,020
1
$21,540
0
$0
1
$65,910
0
$0
APPLICATIONS DENIED
0
$0
3
$55,253
46
$60,734
22
$36,961
0
$0
4
$52,698
3
$54,167
APPLICATIONS WITHDRAWN
0
$0
3
$40,680
18
$91,328
4
$63,465
0
$0
1
$16,320
0
$0
FILES CLOSED FOR INCOMPLETENESS
0
$0
0
$0
6
$68,305
1
$16,320
0
$0
1
$26,100
0
$0
Aggregated Statistics For Year 2004 (Based on 2 partial tracts)
A) FHA, FSA/RHS & VA Home Purchase Loans
B) Conventional Home Purchase Loans
C) Refinancings
D) Home Improvement Loans
F) Non-occupant Loans on < 5 Family Dwellings (A B C & D)
G) Loans On Manufactured Home Dwelling (A B C & D)
Number
Average Value
Number
Average Value
Number
Average Value
Number
Average Value
Number
Average Value
Number
Average Value
LOANS ORIGINATED
2
$107,680
24
$73,472
42
$56,932
23
$25,253
7
$52,301
2
$74,070
APPLICATIONS APPROVED, NOT ACCEPTED
0
$0
2
$47,315
8
$58,652
3
$29,803
0
$0
0
$0
APPLICATIONS DENIED
0
$0
5
$41,374
43
$69,616
10
$32,499
3
$42,637
1
$24,800
APPLICATIONS WITHDRAWN
0
$0
3
$25,887
31
$79,091
2
$22,190
1
$74,400
0
$0
FILES CLOSED FOR INCOMPLETENESS
0
$0
1
$80,270
12
$55,688
1
$48,290
1
$78,310
0
$0
Aggregated Statistics For Year 2003 (Based on 2 partial tracts)
A) FHA, FSA/RHS & VA Home Purchase Loans
B) Conventional Home Purchase Loans
C) Refinancings
D) Home Improvement Loans
E) Loans on Dwellings For 5+ Families
F) Non-occupant Loans on < 5 Family Dwellings (A B C & D)
Number
Average Value
Number
Average Value
Number
Average Value
Number
Average Value
Number
Average Value
Number
Average Value
LOANS ORIGINATED
3
$63,737
14
$52,301
65
$50,953
23
$26,813
0
$0
10
$56,385
APPLICATIONS APPROVED, NOT ACCEPTED
0
$0
1
$25,450
3
$77,443
1
$25,450
0
$0
0
$0
APPLICATIONS DENIED
1
$62,650
5
$35,894
34
$73,341
3
$14,573
1
$29,370
2
$26,430
APPLICATIONS WITHDRAWN
0
$0
3
$26,973
29
$65,192
1
$20,880
0
$0
1
$15,010
FILES CLOSED FOR INCOMPLETENESS
1
$49,600
1
$16,320
3
$42,420
1
$32,630
0
$0
2
$39,480
Aggregated Statistics For Year 2002 (Based on 2 partial tracts)
A) FHA, FSA/RHS & VA Home Purchase Loans
B) Conventional Home Purchase Loans
C) Refinancings
D) Home Improvement Loans
F) Non-occupant Loans on < 5 Family Dwellings (A B C & D)
Number
Average Value
Number
Average Value
Number
Average Value
Number
Average Value
Number
Average Value
LOANS ORIGINATED
5
$47,900
11
$52,505
64
$52,167
16
$19,374
6
$39,482
APPLICATIONS APPROVED, NOT ACCEPTED
0
$0
3
$65,477
8
$64,281
3
$19,577
1
$40,460
APPLICATIONS DENIED
0
$0
5
$52,470
30
$54,884
7
$11,467
1
$31,320
APPLICATIONS WITHDRAWN
0
$0
1
$37,200
23
$50,562
1
$71,790
1
$37,200
FILES CLOSED FOR INCOMPLETENESS
0
$0
1
$55,470
3
$40,243
0
$0
1
$36,550
Aggregated Statistics For Year 2001 (Based on 2 partial tracts)
A) FHA, FSA/RHS & VA Home Purchase Loans
B) Conventional Home Purchase Loans
C) Refinancings
D) Home Improvement Loans
F) Non-occupant Loans on < 5 Family Dwellings (A B C & D)
Number
Average Value
Number
Average Value
Number
Average Value
Number
Average Value
Number
Average Value
LOANS ORIGINATED
3
$57,210
22
$37,109
49
$51,662
29
$17,553
9
$50,468
APPLICATIONS APPROVED, NOT ACCEPTED
0
$0
1
$53,510
4
$45,030
3
$21,970
1
$8,480
APPLICATIONS DENIED
1
$42,420
3
$49,380
33
$49,578
11
$13,942
0
$0
APPLICATIONS WITHDRAWN
0
$0
2
$40,790
24
$63,003
3
$16,097
1
$45,030
FILES CLOSED FOR INCOMPLETENESS
0
$0
0
$0
3
$45,247
0
$0
0
$0
Aggregated Statistics For Year 2000 (Based on 2 partial tracts)
A) FHA, FSA/RHS & VA Home Purchase Loans
B) Conventional Home Purchase Loans
C) Refinancings
D) Home Improvement Loans
F) Non-occupant Loans on < 5 Family Dwellings (A B C & D)
Number
Average Value
Number
Average Value
Number
Average Value
Number
Average Value
Number
Average Value
LOANS ORIGINATED
5
$76,484
14
$52,021
18
$41,621
22
$17,472
5
$40,852
APPLICATIONS APPROVED, NOT ACCEPTED
0
$0
4
$40,135
4
$59,875
1
$16,320
1
$39,160
APPLICATIONS DENIED
0
$0
1
$24,150
23
$41,199
13
$16,365
2
$65,585
APPLICATIONS WITHDRAWN
0
$0
3
$43,943
8
$41,032
3
$28,280
1
$49,600
FILES CLOSED FOR INCOMPLETENESS
0
$0
0
$0
4
$46,498
0
$0
0
$0
Aggregated Statistics For Year 1999 (Based on 1 partial tract)
A) FHA, FSA/RHS & VA Home Purchase Loans
B) Conventional Home Purchase Loans
C) Refinancings
D) Home Improvement Loans
F) Non-occupant Loans on < 5 Family Dwellings (A B C & D)

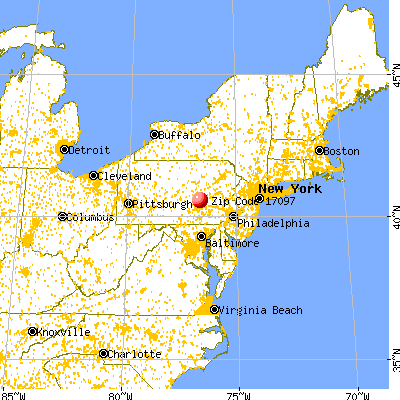


 Nearest zip codes: 17098, 17030, 17980, 17978, 17048, 17968.


