Estimated zip code population in 2022: 3,140 Zip code population in 2010: 3,360 Zip code population in 2000: 3,132
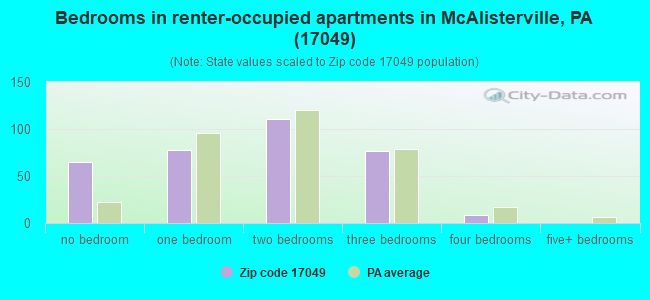
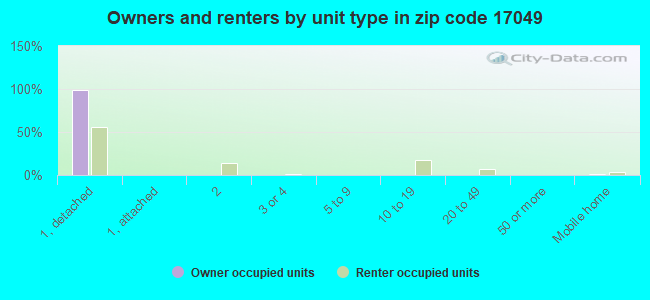
Houses and condos: 1,300 Renter-occupied apartments: 334
% of renters here:
30%
State:
31%
March 2022 cost of living index in zip code 17049: 91.0 (less than average, U.S. average is 100)
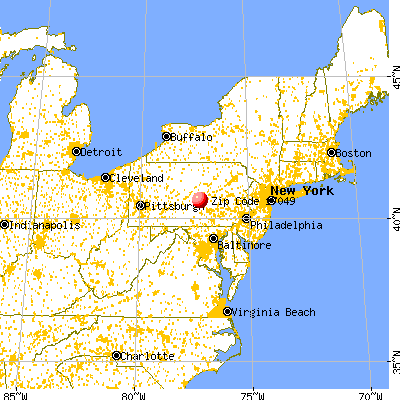
Land area: 40.0 sq. mi. Water area: 0.0 sq. mi.
Population density: 78 people per square mile
(very low).
OSM Map
General Map
Google Map
MSN Map
OSM Map
General Map
Google Map
MSN Map
OSM Map
General Map
Google Map
MSN Map
OSM Map
General Map
Google Map
MSN Map
Please wait while loading the map...
Real estate property taxes paid for housing units in 2022:
This zip code:
1.0% ($1,946)
Pennsylvania:
1.3% ($3,094)
Median real estate property taxes paid for housing units with mortgages in 2022: $1,881 (1.0%) Median real estate property taxes paid for housing units with no mortgage in 2022: $2,086 (1.0%)
Business Search- 14 Million verified businesses
Males: 1,625
(51.7%)
Females: 1,515
(48.3%)
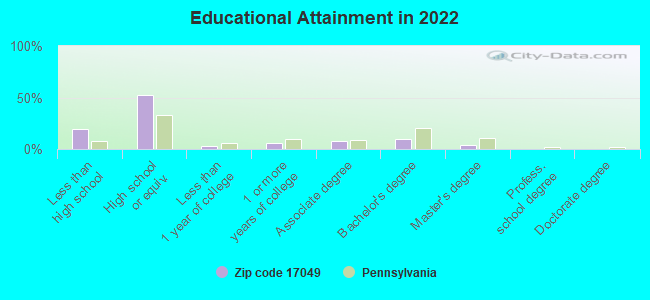
For population 25 years and over in 17049:
High school or higher: 78.0%
Bachelor's degree or higher: 12.5%
Graduate or professional degree: 3.4%
Unemployed: 1.2%
Mean travel time to work (commute): 34.1 minutes
For population 15 years and over in 17049:
Never married: 24.2%
Now married: 58.2%
Separated: 0.0%
Widowed: 6.2%
Divorced: 11.3%
Zip code 17049 compared to state average:
Unemployed percentage significantly below state average.
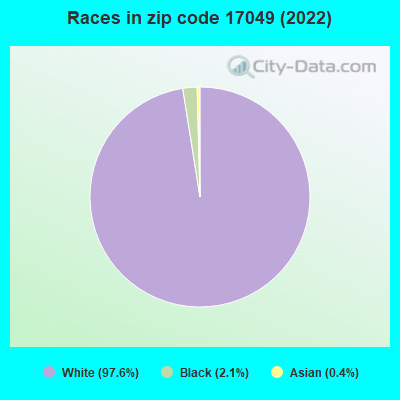
Black race population percentage significantly below state average.
Hispanic race population percentage significantly below state average.
Foreign-born population percentage below state average.
Length of stay since moving in significantly below state average.
Number of college students significantly below state average.
Percentage of population with a bachelor's degree or higher significantly below state average.
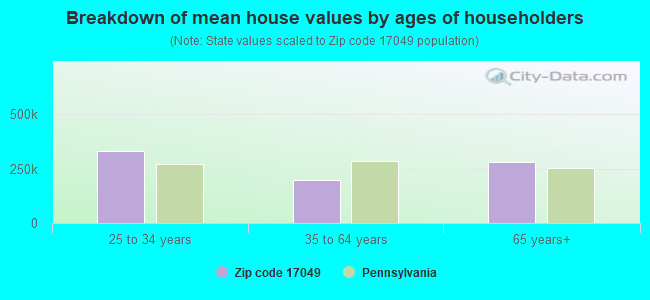
Estimated median house/condo value in 2022: $203,064
17049:
$203,064
Pennsylvania:
$245,500
According to our research of Pennsylvania and other state lists, there were 5 registered sex offenders living in 17049 zip code as of May 26, 2024. The ratio of all residents to sex offenders in zip code 17049 is 660 to 1. The ratio of registered sex offenders to all residents in this zip code is near the state average.
Median resident age:
This zip code:
38.1 years
Pennsylvania median age:
40.9 years
Average household size:
This zip code:
2.8 people
Pennsylvania:
2.4 people
Averages for the 2020 tax year for zip code 17049, filed in 2021:
Average Adjusted Gross Income (AGI) in 2020: $60,771 (Individual Income Tax Returns)
Here:
$60,771
State:
$75,707
Salary/wage: $46,207 (reported on 76.5% of returns)
Here:
$46,207
State:
$62,806
(% of AGI for various income ranges: 1112.9% for AGIs below $25k, 3677.2% for AGIs $25k-50k, 6234.4% for AGIs $50k-75k, 8514.2% for AGIs $75k-100k, 14764.5% for AGIs $100k-200k)
Taxable interest for individuals: $3,200 (reported on 39.2% of returns)
This zip code:
$3,200
Pennsylvania:
$1,633
(% of AGI for various income ranges: 64.3% for AGIs below $25k, 50.4% for AGIs $25k-50k, 55.6% for AGIs $50k-75k, 79.2% for AGIs $75k-100k, 130.0% for AGIs $100k-200k)
Ordinary dividends: $2,565 (reported on 22.2% of returns)
Here:
$2,565
State:
$7,382
(% of AGI for various income ranges: 48.9% for AGIs below $25k, 40.4% for AGIs $25k-50k, 45.0% for AGIs $50k-75k, 108.3% for AGIs $75k-100k, 384.5% for AGIs $100k-200k)
Net capital gain/loss in AGI: +$9,568 (reported on 16.3% of returns)
Here:
+$9,568
State:
+$23,522
(% of AGI for various income ranges: 9.3% for AGIs below $25k, 85.6% for AGIs $25k-50k, 144.4% for AGIs $50k-75k, 193.3% for AGIs $75k-100k, 290.9% for AGIs $100k-200k)
Profit/loss from business: +$17,007 (reported on 19.0% of returns)
Here:
+$17,007
State:
+$16,274
(% of AGI for various income ranges: 140.0% for AGIs below $25k, 251.2% for AGIs $25k-50k, 600.0% for AGIs $50k-75k, 614.2% for AGIs $75k-100k, 1904.5% for AGIs $100k-200k)
Taxable individual retirement arrangement distribution: $9,968 (reported on 12.4% of returns)
17049:
$9,968
Pennsylvania:
$18,583
(% of AGI for various income ranges: 109.6% for AGIs below $25k, 130.8% for AGIs $25k-50k, 262.8% for AGIs $50k-75k, 282.5% for AGIs $75k-100k, 407.3% for AGIs $100k-200k)
Total itemized deductions: $43,450 (reported on 2.6% of returns)
Here:
$43,450
State:
$34,850
(% of AGI for various income ranges: 1580.0% for AGIs $100k-200k)
Charity contributions: $38,367 (reported on 2.0% of returns)
Here:
$38,367
State:
$12,392
(% of AGI for various income ranges: 1046.4% for AGIs $100k-200k)
Taxes paid: $6,550 (reported on 2.6% of returns)
17049:
$6,550
State:
$8,200
(% of AGI for various income ranges: 238.2% for AGIs $100k-200k)
Earned income credit: $1,927 (reported on 9.8% of returns)
Here:
$1,927
State:
$2,100
(% of AGI for various income ranges: 53.9% for AGIs below $25k, 55.2% for AGIs $25k-50k)
Percentage of individuals using paid preparers for their 2020 taxes: 93.5%
Here:
93%
State:
92%
(% for various income ranges: 90.2% for AGIs below $25k, 94.3% for AGIs $25k-50k, 96.3% for AGIs $50k-75k, 94.1% for AGIs $75k-100k, 94.7% for AGIs $100k-200k, 100.0% for AGIs over 200k)
Averages for the 2012 tax year for zip code 17049, filed in 2013:
Average Adjusted Gross Income (AGI) in 2012: $46,707 (Individual Income Tax Returns)
Here:
$46,707
State:
$61,346
Salary/wage: $37,945 (reported on 78.2% of returns)
Here:
$37,945
State:
$51,902
(% of AGI for various income ranges: 63.0% for AGIs below $25k, 69.2% for AGIs $25k-50k, 72.2% for AGIs $50k-75k, 73.8% for AGIs $75k-100k, 49.6% for AGIs $100k-200k)
Taxable interest for individuals: $1,832 (reported on 48.3% of returns)
This zip code:
$1,832
Pennsylvania:
$1,588
(% of AGI for various income ranges: 3.7% for AGIs below $25k, 1.3% for AGIs $25k-50k, 0.9% for AGIs $50k-75k, 0.7% for AGIs $75k-100k, 2.9% for AGIs $100k-200k)
Ordinary dividends: $2,224 (reported on 22.4% of returns)
Here:
$2,224
State:
$5,827
(% of AGI for various income ranges: 2.0% for AGIs below $25k, 1.5% for AGIs $25k-50k, 1.0% for AGIs $50k-75k, 0.7% for AGIs $75k-100k, 0.7% for AGIs $100k-200k)
Net capital gain/loss in AGI: +$4,832 (reported on 12.9% of returns)
Here:
+$4,832
State:
+$14,495
(% of AGI for various income ranges: 0.8% for AGIs $25k-50k, 1.1% for AGIs $50k-75k, 2.0% for AGIs $75k-100k, 2.0% for AGIs $100k-200k)
Profit/loss from business: +$12,969 (reported on 19.7% of returns)
Here:
+$12,969
State:
+$16,268
(% of AGI for various income ranges: 9.3% for AGIs below $25k, 7.5% for AGIs $25k-50k, 4.3% for AGIs $50k-75k, 2.2% for AGIs $75k-100k, 5.3% for AGIs $100k-200k)
Taxable individual retirement arrangement distribution: $7,347 (reported on 12.9% of returns)
17049:
$7,347
Pennsylvania:
$14,550
(% of AGI for various income ranges: 4.9% for AGIs below $25k, 2.4% for AGIs $25k-50k, 1.8% for AGIs $50k-75k, 4.2% for AGIs $75k-100k)
Total itemized deductions: $19,638 (22% of AGI, reported on 21.8% of returns)
Here:
$19,638
State:
$23,538
Here:
21.5% of AGI
State:
18.4% of AGI
(% of AGI for various income ranges: 4.8% for AGIs below $25k, 6.1% for AGIs $25k-50k, 7.5% for AGIs $50k-75k, 11.0% for AGIs $75k-100k, 12.6% for AGIs $100k-200k)
Charity contributions: $6,095 (reported on 15.0% of returns)
Here:
$6,095
State:
$4,025
(% of AGI for various income ranges: 1.3% for AGIs $25k-50k, 1.7% for AGIs $50k-75k, 2.0% for AGIs $75k-100k, 3.1% for AGIs $100k-200k)
Taxes paid: $5,245 (reported on 21.1% of returns)
17049:
$5,245
State:
$9,982
(% of AGI for various income ranges: 0.8% for AGIs below $25k, 1.3% for AGIs $25k-50k, 2.0% for AGIs $50k-75k, 3.4% for AGIs $75k-100k, 3.3% for AGIs $100k-200k)
Earned income credit: $1,990 (reported on 14.3% of returns)
Here:
$1,990
State:
$2,106
(% of AGI for various income ranges: 3.7% for AGIs below $25k, 1.1% for AGIs $25k-50k)
Percentage of individuals using paid preparers for their 2012 taxes: 67.3%
Here:
67%
State:
53%
(% for various income ranges: 64.4% for AGIs below $25k, 67.5% for AGIs $25k-50k, 69.6% for AGIs $50k-75k, 75.0% for AGIs $75k-100k, 69.2% for AGIs $100k-200k)
Averages for the 2004 tax year for zip code 17049, filed in 2005:
Average Adjusted Gross Income (AGI) in 2004: $39,921 (Individual Income Tax Returns)
Here:
$39,921
State:
$48,049
Salary/wage: $35,664 (reported on 80.1% of returns)
Here:
$35,664
State:
$42,646
(% of AGI for various income ranges: 100.3% for AGIs below $10k, 65.8% for AGIs $10k-25k, 75.7% for AGIs $25k-50k, 81.4% for AGIs $50k-75k, 81.6% for AGIs $75k-100k, 52.0% for AGIs over 100k)
Taxable interest for individuals: $2,145 (reported on 55.5% of returns)
This zip code:
$2,145
Pennsylvania:
$1,657
(% of AGI for various income ranges: 8.0% for AGIs below $10k, 5.3% for AGIs $10k-25k, 1.7% for AGIs $25k-50k, 1.6% for AGIs $50k-75k, 0.7% for AGIs $75k-100k, 5.8% for AGIs over 100k)
Taxable dividends: $2,175 (reported on 25.7% of returns)
Here:
$2,175
State:
$3,566
(% of AGI for various income ranges: 5.5% for AGIs below $10k, 1.2% for AGIs $10k-25k, 1.0% for AGIs $25k-50k, 0.8% for AGIs $50k-75k, 0.2% for AGIs $75k-100k, 2.9% for AGIs over 100k)
Net capital gain/loss: +$6,221 (reported on 14.9% of returns)
Here:
+$6,221
State:
+$9,716
(% of AGI for various income ranges: 2.4% for AGIs below $10k, 1.6% for AGIs $10k-25k, 0.7% for AGIs $25k-50k, 1.8% for AGIs $50k-75k, 0.9% for AGIs $75k-100k, 5.8% for AGIs over 100k)
Profit/loss from business: +$12,550 (reported on 18.6% of returns)
Here:
+$12,550
State:
+$14,267
(% of AGI for various income ranges: 10.9% for AGIs below $10k, 7.5% for AGIs $10k-25k, 8.3% for AGIs $25k-50k, 3.6% for AGIs $50k-75k, 5.8% for AGIs $75k-100k, 4.1% for AGIs over 100k)
Profit/loss from farming: +$2,129 (reported on 5.0% of returns)
Here:
+$2,129
State:
+$274
(% of AGI for various income ranges: -1.1% for AGIs below $10k, -1.0% for AGIs $10k-25k, 1.0% for AGIs $25k-50k, 0.4% for AGIs $50k-75k)
IRA payment deduction: $3,107 (reported on 4.0% of returns)
17049:
$3,107
Pennsylvania:
$2,903
Self-employed pension: $12,100 (reported on 0.7% of returns)
Here:
$12,100
Pennsylvania:
$14,674
Total itemized deductions: $16,323 (22% of AGI, reported on 21.3% of returns)
Here:
$16,323
State:
$18,804
Here:
22.1% of AGI
State:
19.5% of AGI
(% of AGI for various income ranges: 7.8% for AGIs $10k-25k, 7.0% for AGIs $25k-50k, 9.3% for AGIs $50k-75k, 11.7% for AGIs $75k-100k, 9.6% for AGIs over 100k)
Charity contributions deductions: $5,936 (8% of AGI, reported on 17.8% of returns)
Here:
$5,936
State:
$3,337
Here:
7.5% of AGI
State:
3.3% of AGI
(% of AGI for various income ranges: 1.1% for AGIs $10k-25k, 1.3% for AGIs $25k-50k, 2.3% for AGIs $50k-75k, 3.1% for AGIs $75k-100k, 5.2% for AGIs over 100k)
Total tax: $6,012 (reported on 74.3% of returns)
17049:
$6,012
State:
$8,008
(% of AGI for various income ranges: 3.2% for AGIs below $10k, 4.6% for AGIs $10k-25k, 7.1% for AGIs $25k-50k, 8.3% for AGIs $50k-75k, 11.9% for AGIs $75k-100k, 21.9% for AGIs over 100k)
Earned income credit: $1,448 (reported on 12.3% of returns)
Here:
$1,448
State:
$1,643
Percentage of individuals using paid preparers for their 2004 taxes: 62.9%
Here:
63%
State:
56%
(% for various income ranges: 58.0% for AGIs below $10k, 61.5% for AGIs $10k-25k, 65.7% for AGIs $25k-50k, 59.5% for AGIs $50k-75k, 62.5% for AGIs $75k-100k, 91.8% for AGIs over 100k)
Household received Food Stamps/SNAP in the past 12 months: 117 Household did not receive Food Stamps/SNAP in the past 12 months: 1,008
Women who had a birth in the past 12 months: 67 (72 now married, 0 unmarried) Women who did not have a birth in the past 12 months: 488 (236 now married, 250 unmarried)
Housing units in zip code 17049 with a mortgage: 481 (14 second mortgage, 1 home equity loan, 13 both second mortgage and home equity loan) Houses without a mortgage: 113
Median monthly owner costs for units with a mortgage: $1,253 Median monthly owner costs for units without a mortgage: $529
Residents with income below the poverty level in 2022:
This zip code:
6.5%
Whole state:
11.8%
Residents with income below 50% of the poverty level in 2022:
This zip code:
5.7%
Whole state:
6.1%
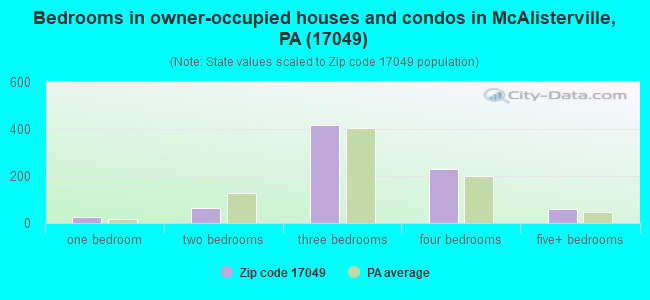
Median number of rooms in houses and condos:
Here:
6.6
State:
6.8
Median number of rooms in apartments:
Here:
4.3
State:
4.3
Notable locations in this zip code not listed on our city pages
In group quarters: 12 (-1 institutionalized population)
Size of family households: 368 2-persons, 181 3-persons, 85 4-persons, 49 5-persons, 19 6-persons, 76 7-or-more-persons
Size of nonfamily households: 322 1-person, 24 2-persons
806 married couples with children.
139 single-parent households (139 women).
73.4% of residents of 17049 zip code speak English at home.
26.0% of residents speak other Indo-European language at home (88% very well, 9% well, 3% not well).
0.3% of residents speak other language at home (100% well).
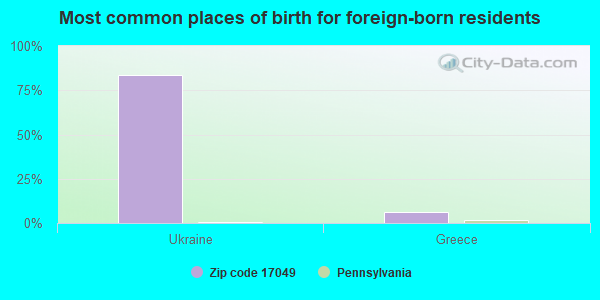
Foreign born population: 115 (3.7%) (36.7% of them are naturalized citizens)
This zip code:
3.7%
Whole state:
7.5%
84%Ukraine
6%Greece
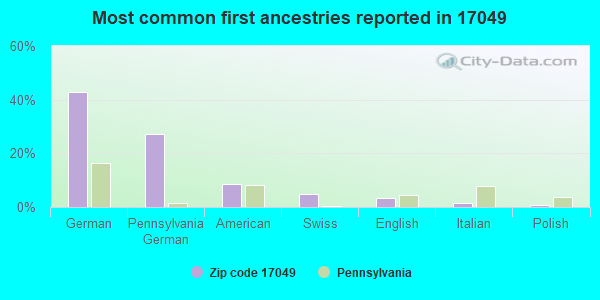
43%German
27%Pennsylvania German
9%American
5%Swiss
3%English
1%Italian
1%Polish
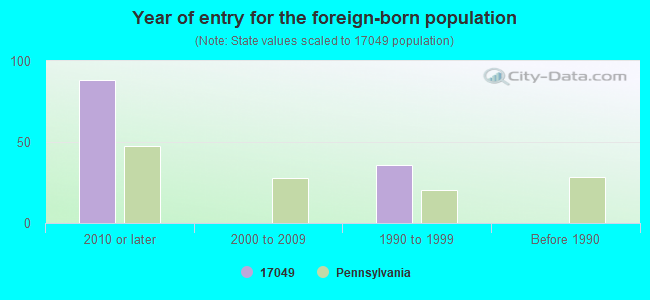
Year of entry for the foreign-born population
882010 or later
02000 to 2009
361990 to 1999
0Before 1990
Housing units lacking complete plumbing facilities: 2.8% Housing units lacking complete kitchen facilities: 2.5%
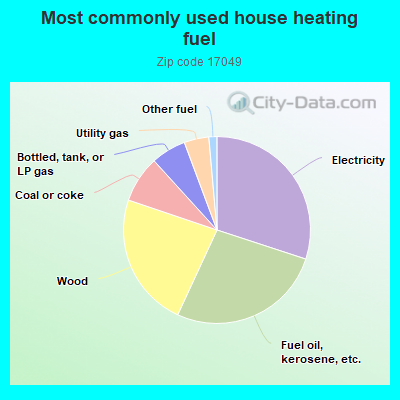
30.2%Electricity
27.0%Fuel oil, kerosene, etc.
23.4%Wood
8.1%Coal or coke
6.1%Bottled, tank, or LP gas
4.3%Utility gas
1.4%Other fuel
Population in 1990: 3,073. Population change in the 1990s: +59 (+1.9%).
Place of birth for U.S.-born residents:
This state: 2,796
Northeast: 82
Midwest: 8
South: 112
65% of the 17049 zip code residents lived in the same house 5 years ago. Out of people who lived in different houses, 68% lived in this county. Out of people who lived in different counties, 50% lived in Pennsylvania.
97% of the 17049 zip code residents lived in the same house 1 year ago. Out of people who lived in different houses, 106% moved from this county. Out of people who lived in different houses, 2% moved from different state.
Private vs. public school enrollment:
Students in private schools in grades 1 to 8 (elementary and middle school): 334
Here:
77.2%
Pennsylvania:
15.7%
Students in private schools in grades 9 to 12 (high school): 10
Here:
5.5%
Pennsylvania:
13.4%
Students in private undergraduate colleges:
Here:
0.0%
Pennsylvania:
39.8%
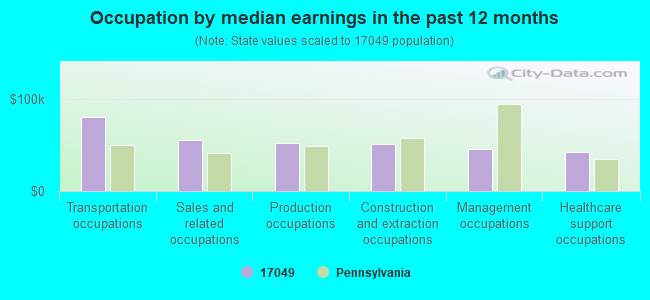
Occupation by median earnings in the past 12 months ($)
80,690Transportation occupations
56,130Sales and related occupations
52,490Production occupations
51,339Construction and extraction occupations
45,589Management occupations
43,112Healthcare support occupations
Top industries in this zip code by the number of employees in 2005:
Other Services (except Public Administration): Religious Organizations (20-49 employees: 1 establishment, 1-4 employees: 6 establishments)
Construction: Highway, Street, and Bridge Construction (20-49: 1)
Educational Services: Elementary and Secondary Schools (20-49: 1)
Accommodation and Food Services: Full-Service Restaurants (20-49: 1)
Educational Services: Sports and Recreation Instruction (20-49: 1)
Wholesale Trade: Farm and Garden Machinery and Equipment Merchant Wholesalers (20-49: 1)
Administrative and Support and Waste Management and Remediation Services: Solid Waste Collection (20-49: 1)
2007 - 2018 National Fire Incident Reporting System (NFIRS) incidents
According to the data from the years 2007 - 2018 the average number of fires per year is 13. The highest number of reported fire incidents - 37 took place in 2017, and the least - 0 in 2009. The data has a rising trend.
When looking into fire subcategories, the most reports belonged to: Structure Fires (65.4%), and Outside Fires (23.3%).
Fire incident types reported to NFIRS in Zip Code 17049


 Nearest zip codes: 17076, 17812, 17094, 17841, 17062, 17086.


 According to the data from the years 2007 - 2018 the average number of fires per year is 13. The highest number of reported fire incidents - 37 took place in 2017, and the least - 0 in 2009. The data has a rising trend.
 When looking into fire subcategories, the most reports belonged to: Structure Fires (65.4%), and Outside Fires (23.3%).