Estimated zip code population in 2022: 2,065 Zip code population in 2010: 1,934 Zip code population in 2000: 2,089
Houses and condos: 1,116 Renter-occupied apartments: 159
% of renters here:
18%
State:
31%
March 2022 cost of living index in zip code 16259: 90.8 (less than average, U.S. average is 100)
Land area: 46.4 sq. mi. Water area: 1.6 sq. mi.
Population density: 45 people per square mile
(very low).
OSM Map
General Map
Google Map
MSN Map
OSM Map
General Map
Google Map
MSN Map
OSM Map
General Map
Google Map
MSN Map
OSM Map
General Map
Google Map
MSN Map
Please wait while loading the map...
Real estate property taxes paid for housing units in 2022:
This zip code:
1.1% ($1,618)
Pennsylvania:
1.3% ($3,094)
Median real estate property taxes paid for housing units with mortgages in 2022: $2,034 (1.2%) Median real estate property taxes paid for housing units with no mortgage in 2022: $1,356 (1.0%)
Business Search- 14 Million verified businesses
Males: 1,031
(49.9%)
Females: 1,034
(50.1%)
For population 25 years and over in 16259:
High school or higher: 89.1%
Bachelor's degree or higher: 7.2%
Graduate or professional degree: 1.9%
Unemployed: 5.5%
Mean travel time to work (commute): 35.4 minutes
For population 15 years and over in 16259:
Never married: 22.6%
Now married: 56.5%
Separated: 2.5%
Widowed: 8.8%
Divorced: 9.5%
Zip code 16259 compared to state average:
Median house value below state average.
Black race population percentage significantly below state average.
Hispanic race population percentage significantly below state average.
Median age above state average.
Foreign-born population percentage significantly below state average.
Renting percentage below state average.
Length of stay since moving in significantly above state average.
Number of college students below state average.
Percentage of population with a bachelor's degree or higher significantly below state average.
Estimated median house/condo value in 2022: $144,348
16259:
$144,348
Pennsylvania:
$245,500
According to our research of Pennsylvania and other state lists, there were 3 registered sex offenders living in 16259 zip code as of May 28, 2024. The ratio of all residents to sex offenders in zip code 16259 is 630 to 1. The ratio of registered sex offenders to all residents in this zip code is near the state average.
Median resident age:
This zip code:
46.5 years
Pennsylvania median age:
40.9 years
Average household size:
This zip code:
2.3 people
Pennsylvania:
2.4 people
Averages for the 2020 tax year for zip code 16259, filed in 2021:
Average Adjusted Gross Income (AGI) in 2020: $53,003 (Individual Income Tax Returns)
Here:
$53,003
State:
$75,707
Salary/wage: $49,422 (reported on 78.2% of returns)
Here:
$49,422
State:
$62,806
(% of AGI for various income ranges: 976.7% for AGIs below $25k, 3004.3% for AGIs $25k-50k, 5570.9% for AGIs $50k-75k, 9330.0% for AGIs $75k-100k, 16101.2% for AGIs $100k-200k)
Taxable interest for individuals: $735 (reported on 26.4% of returns)
This zip code:
$735
Pennsylvania:
$1,633
(% of AGI for various income ranges: 35.0% for AGIs below $25k, 19.5% for AGIs $25k-50k, 10.0% for AGIs $50k-75k, 17.1% for AGIs $75k-100k, 52.5% for AGIs $100k-200k)
Ordinary dividends: $1,450 (reported on 13.8% of returns)
Here:
$1,450
State:
$7,382
(% of AGI for various income ranges: 18.3% for AGIs below $25k, 16.7% for AGIs $25k-50k, 24.5% for AGIs $50k-75k, 98.8% for AGIs $100k-200k)
Net capital gain/loss in AGI: +$4,888 (reported on 9.2% of returns)
Here:
+$4,888
State:
+$23,522
(% of AGI for various income ranges: 26.7% for AGIs $25k-50k, 61.8% for AGIs $50k-75k, 333.8% for AGIs $100k-200k)
Profit/loss from business: +$5,912 (reported on 9.2% of returns)
Here:
+$5,912
State:
+$16,274
(% of AGI for various income ranges: 56.1% for AGIs below $25k, 82.9% for AGIs $25k-50k, 180.0% for AGIs $50k-75k)
Taxable individual retirement arrangement distribution: $14,700 (reported on 10.3% of returns)
16259:
$14,700
Pennsylvania:
$18,583
(% of AGI for various income ranges: 88.3% for AGIs below $25k, 112.4% for AGIs $25k-50k, 217.3% for AGIs $50k-75k, 984.3% for AGIs $75k-100k)
Earned income credit: $1,930 (reported on 11.5% of returns)
Here:
$1,930
State:
$2,100
(% of AGI for various income ranges: 61.1% for AGIs below $25k, 39.5% for AGIs $25k-50k)
Percentage of individuals using paid preparers for their 2020 taxes: 92.0%
Here:
92%
State:
92%
(% for various income ranges: 88.5% for AGIs below $25k, 92.0% for AGIs $25k-50k, 92.9% for AGIs $50k-75k, 90.0% for AGIs $75k-100k, 100.0% for AGIs $100k-200k)
Averages for the 2012 tax year for zip code 16259, filed in 2013:
Average Adjusted Gross Income (AGI) in 2012: $43,058 (Individual Income Tax Returns)
Here:
$43,058
State:
$61,346
Salary/wage: $39,775 (reported on 83.0% of returns)
Here:
$39,775
State:
$51,902
(% of AGI for various income ranges: 67.9% for AGIs below $25k, 81.1% for AGIs $25k-50k, 80.6% for AGIs $50k-75k, 78.5% for AGIs $75k-100k, 69.8% for AGIs $100k-200k)
Taxable interest for individuals: $1,440 (reported on 28.4% of returns)
This zip code:
$1,440
Pennsylvania:
$1,588
(% of AGI for various income ranges: 1.7% for AGIs below $25k, 0.6% for AGIs $25k-50k, 0.9% for AGIs $50k-75k, 0.2% for AGIs $75k-100k, 1.5% for AGIs $100k-200k)
Ordinary dividends: $943 (reported on 15.9% of returns)
Here:
$943
State:
$5,827
(% of AGI for various income ranges: 1.2% for AGIs below $25k, 0.1% for AGIs $25k-50k, 0.4% for AGIs $50k-75k, 0.5% for AGIs $75k-100k)
Net capital gain/loss in AGI: +$4,400 (reported on 6.8% of returns)
Here:
+$4,400
State:
+$14,495
Profit/loss from business: +$7,044 (reported on 10.2% of returns)
Here:
+$7,044
State:
+$16,268
Taxable individual retirement arrangement distribution: $10,467 (reported on 6.8% of returns)
16259:
$10,467
Pennsylvania:
$14,550
Total itemized deductions: $18,700 (22% of AGI, reported on 14.8% of returns)
Here:
$18,700
State:
$23,538
Here:
22.4% of AGI
State:
18.4% of AGI
(% of AGI for various income ranges: 6.0% for AGIs $25k-50k, 3.5% for AGIs $50k-75k, 8.0% for AGIs $75k-100k, 12.6% for AGIs $100k-200k)
Charity contributions: $3,600 (reported on 9.1% of returns)
Here:
$3,600
State:
$4,025
(% of AGI for various income ranges: 1.1% for AGIs $25k-50k, 1.1% for AGIs $75k-100k, 1.5% for AGIs $100k-200k)
Taxes paid: $6,754 (reported on 14.8% of returns)
16259:
$6,754
State:
$9,982
(% of AGI for various income ranges: 1.4% for AGIs $25k-50k, 0.9% for AGIs $50k-75k, 2.3% for AGIs $75k-100k, 6.3% for AGIs $100k-200k)
Earned income credit: $2,020 (reported on 17.0% of returns)
Here:
$2,020
State:
$2,106
(% of AGI for various income ranges: 5.4% for AGIs below $25k, 1.0% for AGIs $25k-50k)
Percentage of individuals using paid preparers for their 2012 taxes: 53.4%
Here:
53%
State:
53%
(% for various income ranges: 48.6% for AGIs below $25k, 54.5% for AGIs $25k-50k, 55.6% for AGIs $50k-75k, 50.0% for AGIs $75k-100k, 80.0% for AGIs $100k-200k)
Averages for the 2004 tax year for zip code 16259, filed in 2005:
Average Adjusted Gross Income (AGI) in 2004: $31,167 (Individual Income Tax Returns)
Here:
$31,167
State:
$48,049
Salary/wage: $29,784 (reported on 84.5% of returns)
Here:
$29,784
State:
$42,646
(% of AGI for various income ranges: 112.6% for AGIs below $10k, 70.3% for AGIs $10k-25k, 85.6% for AGIs $25k-50k, 88.3% for AGIs $50k-75k, 109.7% for AGIs $75k-100k)
Taxable interest for individuals: $1,268 (reported on 42.1% of returns)
This zip code:
$1,268
Pennsylvania:
$1,657
(% of AGI for various income ranges: 6.1% for AGIs below $10k, 3.0% for AGIs $10k-25k, 1.5% for AGIs $25k-50k, 0.8% for AGIs $50k-75k, 0.5% for AGIs $75k-100k, 3.7% for AGIs over 100k)
Taxable dividends: $444 (reported on 14.5% of returns)
Here:
$444
State:
$3,566
(% of AGI for various income ranges: 1.9% for AGIs below $10k, 0.3% for AGIs $10k-25k, 0.1% for AGIs $25k-50k, 0.2% for AGIs $50k-75k, 0.3% for AGIs $75k-100k)
Net capital gain/loss: +$2,508 (reported on 7.0% of returns)
Here:
+$2,508
State:
+$9,716
(% of AGI for various income ranges: 0.3% for AGIs $10k-25k, 0.1% for AGIs $25k-50k, 0.2% for AGIs $50k-75k, 3.5% for AGIs $75k-100k)
Profit/loss from business: +$2,778 (reported on 11.4% of returns)
Here:
+$2,778
State:
+$14,267
(% of AGI for various income ranges: 3.6% for AGIs below $10k, 5.3% for AGIs $10k-25k, 0.4% for AGIs $25k-50k, -0.3% for AGIs $50k-75k)
IRA payment deduction: $2,000 (reported on 2.1% of returns)
16259:
$2,000
Pennsylvania:
$2,903
Total itemized deductions: $14,664 (24% of AGI, reported on 12.7% of returns)
Here:
$14,664
State:
$18,804
Here:
23.6% of AGI
State:
19.5% of AGI
(% of AGI for various income ranges: 2.6% for AGIs $10k-25k, 4.7% for AGIs $25k-50k, 7.8% for AGIs $50k-75k, 8.7% for AGIs $75k-100k, 10.7% for AGIs over 100k)
Charity contributions deductions: $2,390 (4% of AGI, reported on 9.5% of returns)
Here:
$2,390
State:
$3,337
Here:
3.7% of AGI
State:
3.3% of AGI
Total tax: $3,366 (reported on 70.1% of returns)
16259:
$3,366
State:
$8,008
(% of AGI for various income ranges: 2.3% for AGIs below $10k, 3.9% for AGIs $10k-25k, 5.7% for AGIs $25k-50k, 7.6% for AGIs $50k-75k, 11.0% for AGIs $75k-100k, 20.0% for AGIs over 100k)
Earned income credit: $1,628 (reported on 18.0% of returns)
Here:
$1,628
State:
$1,643
Percentage of individuals using paid preparers for their 2004 taxes: 56.9%
Here:
57%
State:
56%
(% for various income ranges: 50.3% for AGIs below $10k, 58.8% for AGIs $10k-25k, 57.9% for AGIs $25k-50k, 56.5% for AGIs $50k-75k, 63.2% for AGIs $75k-100k, 78.6% for AGIs over 100k)
Household received Food Stamps/SNAP in the past 12 months: 110 Household did not receive Food Stamps/SNAP in the past 12 months: 795
Women who had a birth in the past 12 months: 21 (22 now married, 0 unmarried) Women who did not have a birth in the past 12 months: 416 (174 now married, 242 unmarried)
Housing units in zip code 16259 with a mortgage: 353 (37 second mortgage, 8 home equity loan, 23 both second mortgage and home equity loan) Houses without a mortgage: 13
Median monthly owner costs for units with a mortgage: $1,160 Median monthly owner costs for units without a mortgage: $359
Residents with income below the poverty level in 2022:
This zip code:
8.8%
Whole state:
11.8%
Residents with income below 50% of the poverty level in 2022:
This zip code:
4.0%
Whole state:
6.1%
Median number of rooms in houses and condos:
Here:
6.2
State:
6.8
Median number of rooms in apartments:
Here:
5.1
State:
4.3
Notable locations in this zip code not listed on our city pages
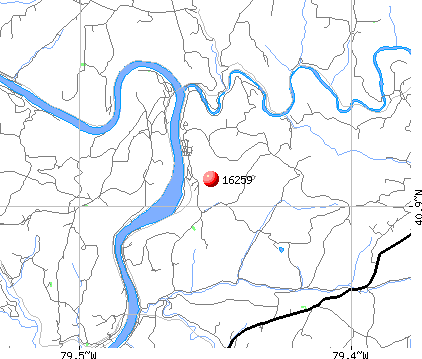
Notable locations in zip code 16259: Chickasaw (A), Widnoon Station (B), Henley Station (C), Pine Furnace Station (D), Grays Eddy (E), Pine Township Volunteer Fire Company (F). Display/hide their locations on the map
Lakes and reservoirs: Rainbow Lake (A), Allegheny River Pool Eight (B), Pond Five (C), Pond One (D), Pond Two (E), Allegheny River Pool Nine (F). Display/hide their locations on the map
Streams, rivers, and creeks: Wiskey Creek (A), Hays Run (B), Mast Run (C), Mahoning Creek (D), Scrubgrass Creek (E), Bullock Run (F), Rock Run (G), Pine Creek (H). Display/hide their locations on the map
In group quarters: 4 (-1 institutionalized population)
Size of family households: 318 2-persons, 104 3-persons, 118 4-persons, 80 5-persons, 2 6-persons, 2 7-or-more-persons
Size of nonfamily households: 234 1-person, 34 2-persons, 9 3-persons
254 married couples with children.
72 single-parent households (10 men, 62 women).
97.4% of residents of 16259 zip code speak English at home.
1.6% of residents speak Spanish at home (69% very well, 31% well).
0.2% of residents speak other Indo-European language at home (25% very well, 75% well).
0.2% of residents speak Asian or Pacific Island language at home (100% very well).
Foreign born population: 5 (0.2%) (41.0% of them are naturalized citizens)
This zip code:
0.2%
Whole state:
7.5%
32%German
14%American
11%English
10%Irish
5%Italian
3%Eastern European
3%Scottish
Year of entry for the foreign-born population
02010 or later
22000 to 2009
11990 to 1999
19Before 1990
Housing units lacking complete plumbing facilities: 4.8% Housing units lacking complete kitchen facilities: 4.3%
60.9%Utility gas
10.0%Bottled, tank, or LP gas
9.5%Fuel oil, kerosene, etc.
9.1%Electricity
6.4%Other fuel
4.1%Wood
Population in 1990: 1,654. Population change in the 1990s: +435 (+26.3%).
Place of birth for U.S.-born residents:
This state: 1,848
Northeast: 33
Midwest: 48
South: 69
West: 22
75% of the 16259 zip code residents lived in the same house 5 years ago. Out of people who lived in different houses, 74% lived in this county. Out of people who lived in different counties, 50% lived in Pennsylvania.
98% of the 16259 zip code residents lived in the same house 1 year ago. Out of people who lived in different houses, 47% moved from this county. Out of people who lived in different houses, 64% moved from different county within same state.
Private vs. public school enrollment:
Students in private schools in grades 1 to 8 (elementary and middle school): 5
Here:
2.9%
Pennsylvania:
15.7%
Students in private schools in grades 9 to 12 (high school): 17
Here:
16.0%
Pennsylvania:
13.4%
Students in private undergraduate colleges: 10
Here:
22.7%
Pennsylvania:
39.8%
Occupation by median earnings in the past 12 months ($)
65,598Management occupations
64,322Health diagnosing and treating practitioners and other technical occupations
60,711Personal care and service occupations
58,491Law enforcement workers including supervisors
57,851Construction and extraction occupations
56,621Farming, fishing, and forestry occupations
Top industries in this zip code by the number of employees in 2005:
Mining: Support Activities for Oil and Gas Operations (5-9 employees: 1 establishment)
Other Services (except Public Administration): Religious Organizations (1-4: 3)
Construction: Residential Remodelers (1-4: 1)
Wholesale Trade: Home Furnishing Merchant Wholesalers (1-4: 1)
Construction: Site Preparation Contractors (1-4: 1)
Accommodation and Food Services: Recreational and Vacation Camps (except Campgrounds) (1-4: 1)
People in group quarters in 2000:
7 people in other noninstitutional group quarters
Home Mortgage Disclosure Act Aggregated Statistics For Year 2009 (Based on 4 partial tracts)
A) FHA, FSA/RHS & VA Home Purchase Loans
B) Conventional Home Purchase Loans
C) Refinancings
D) Home Improvement Loans
F) Non-occupant Loans on < 5 Family Dwellings (A B C & D)
G) Loans On Manufactured Home Dwelling (A B C & D)
Number
Average Value
Number
Average Value
Number
Average Value
Number
Average Value
Number
Average Value
Number
Average Value
LOANS ORIGINATED
5
$91,392
18
$84,338
57
$95,932
18
$22,903
6
$67,482
3
$59,470
APPLICATIONS APPROVED, NOT ACCEPTED
0
$0
1
$166,570
2
$60,440
5
$5,334
0
$0
1
$67,240
APPLICATIONS DENIED
2
$157,745
5
$140,052
38
$116,090
6
$36,585
0
$0
7
$74,654
APPLICATIONS WITHDRAWN
2
$226,350
3
$55,357
15
$104,657
3
$14,210
0
$0
2
$110,315
FILES CLOSED FOR INCOMPLETENESS
0
$0
0
$0
1
$91,750
0
$0
0
$0
0
$0
Aggregated Statistics For Year 2008 (Based on 4 partial tracts)
A) FHA, FSA/RHS & VA Home Purchase Loans
B) Conventional Home Purchase Loans
C) Refinancings
D) Home Improvement Loans
F) Non-occupant Loans on < 5 Family Dwellings (A B C & D)
G) Loans On Manufactured Home Dwelling (A B C & D)
Number
Average Value
Number
Average Value
Number
Average Value
Number
Average Value
Number
Average Value
Number
Average Value
LOANS ORIGINATED
4
$84,695
10
$69,874
47
$81,250
19
$19,366
1
$115,750
5
$68,824
APPLICATIONS APPROVED, NOT ACCEPTED
0
$0
2
$34,670
3
$64,303
0
$0
1
$16,810
1
$52,530
APPLICATIONS DENIED
2
$100,930
7
$68,411
46
$83,118
15
$73,127
0
$0
5
$104,576
APPLICATIONS WITHDRAWN
1
$49,410
1
$53,640
15
$86,435
2
$8,255
1
$53,640
0
$0
FILES CLOSED FOR INCOMPLETENESS
0
$0
2
$161,650
2
$69,170
0
$0
0
$0
0
$0
Aggregated Statistics For Year 2007 (Based on 4 partial tracts)
A) FHA, FSA/RHS & VA Home Purchase Loans
B) Conventional Home Purchase Loans
C) Refinancings
D) Home Improvement Loans
F) Non-occupant Loans on < 5 Family Dwellings (A B C & D)
G) Loans On Manufactured Home Dwelling (A B C & D)
Number
Average Value
Number
Average Value
Number
Average Value
Number
Average Value
Number
Average Value
Number
Average Value
LOANS ORIGINATED
3
$63,277
28
$64,675
67
$60,494
36
$38,889
5
$59,026
8
$46,108
APPLICATIONS APPROVED, NOT ACCEPTED
0
$0
5
$56,354
12
$51,883
1
$65,640
0
$0
2
$65,790
APPLICATIONS DENIED
0
$0
7
$68,920
60
$76,692
24
$44,270
2
$67,240
9
$59,277
APPLICATIONS WITHDRAWN
0
$0
3
$52,463
25
$81,962
3
$43,027
0
$0
1
$15,530
FILES CLOSED FOR INCOMPLETENESS
0
$0
1
$106,580
1
$63,520
0
$0
0
$0
0
$0
Aggregated Statistics For Year 2006 (Based on 4 partial tracts)
A) FHA, FSA/RHS & VA Home Purchase Loans
B) Conventional Home Purchase Loans
C) Refinancings
D) Home Improvement Loans
E) Loans on Dwellings For 5+ Families
F) Non-occupant Loans on < 5 Family Dwellings (A B C & D)
G) Loans On Manufactured Home Dwelling (A B C & D)
Number
Average Value
Number
Average Value
Number
Average Value
Number
Average Value
Number
Average Value
Number
Average Value
Number
Average Value
LOANS ORIGINATED
4
$74,068
27
$87,428
60
$63,453
41
$25,136
1
$176,450
9
$90,780
14
$31,166
APPLICATIONS APPROVED, NOT ACCEPTED
0
$0
5
$107,894
19
$95,824
2
$88,560
0
$0
0
$0
3
$103,483
APPLICATIONS DENIED
0
$0
7
$51,430
63
$67,821
20
$21,888
0
$0
2
$62,445
6
$64,882
APPLICATIONS WITHDRAWN
0
$0
5
$64,184
15
$81,525
0
$0
0
$0
0
$0
0
$0
FILES CLOSED FOR INCOMPLETENESS
0
$0
1
$85,400
1
$123,520
1
$49,410
0
$0
0
$0
0
$0
Aggregated Statistics For Year 2005 (Based on 4 partial tracts)
A) FHA, FSA/RHS & VA Home Purchase Loans
B) Conventional Home Purchase Loans
C) Refinancings
D) Home Improvement Loans
F) Non-occupant Loans on < 5 Family Dwellings (A B C & D)
G) Loans On Manufactured Home Dwelling (A B C & D)
Number
Average Value
Number
Average Value
Number
Average Value
Number
Average Value
Number
Average Value
Number
Average Value
LOANS ORIGINATED
1
$158,100
24
$77,161
66
$67,989
39
$35,888
4
$73,065
4
$83,522
APPLICATIONS APPROVED, NOT ACCEPTED
0
$0
3
$75,673
11
$72,624
5
$14,708
0
$0
1
$146,030
APPLICATIONS DENIED
1
$83,000
6
$61,613
59
$61,089
20
$24,326
6
$7,852
4
$51,480
APPLICATIONS WITHDRAWN
1
$70,580
2
$95,380
29
$93,114
4
$32,722
1
$33,170
3
$76,813
FILES CLOSED FOR INCOMPLETENESS
0
$0
0
$0
4
$72,580
1
$7,060
0
$0
0
$0
Aggregated Statistics For Year 2004 (Based on 4 partial tracts)
A) FHA, FSA/RHS & VA Home Purchase Loans
B) Conventional Home Purchase Loans
C) Refinancings
D) Home Improvement Loans
F) Non-occupant Loans on < 5 Family Dwellings (A B C & D)
G) Loans On Manufactured Home Dwelling (A B C & D)
Detailed PMIC statistics for the following Tracts:9802.00
, 9806.00
2003 - 2018 National Fire Incident Reporting System (NFIRS) incidents
According to the data from the years 2003 - 2018 the average number of fire incidents per year is 8. The highest number of fire incidents - 23 took place in 2005, and the least - 1 in 2009. The data has an increasing trend.
When looking into fire subcategories, the most incidents belonged to: Outside Fires (43.8%), and Structure Fires (40.5%).
Fire incident types reported to NFIRS in Zip Code 16259

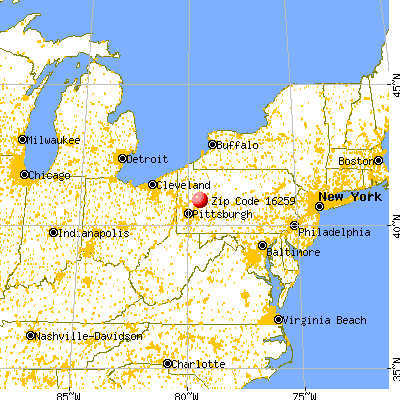


 Nearest zip codes: 16210, 16223, 16253, 16248, 16242, 16201.


 According to the data from the years 2003 - 2018 the average number of fire incidents per year is 8. The highest number of fire incidents - 23 took place in 2005, and the least - 1 in 2009. The data has an increasing trend.
 When looking into fire subcategories, the most incidents belonged to: Outside Fires (43.8%), and Structure Fires (40.5%).