Armstrong County, Pennsylvania (PA)
County owner-occupied free and clear houses and condos in 2010: 10,386
County owner-occupied houses and condos in 2000: 22,417
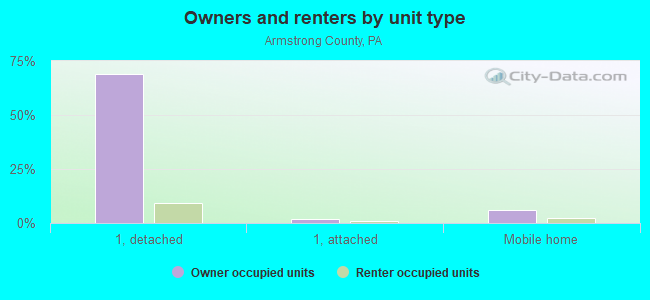
Renter-occupied apartments: 7,045 (it was 6,588 in 2000)
| % of renters here: | 23% |
| State: | 30% |
Land area: 654 sq. mi.
Water area: 10.5 sq. mi.
Population density: 99 people per square mile (average).
Industries providing employment: Educational, health and social services (25.3%), Manufacturing (15.7%), Retail trade (11.4%).
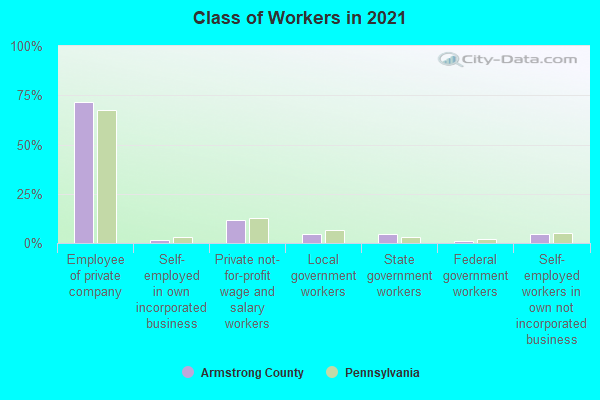
Type of workers:
- Private wage or salary: 84%
- Government: 11%
- Self-employed, not incorporated: 5%
- Unpaid family work: 0%
- OSM Map
- General Map
- Google Map
- MSN Map

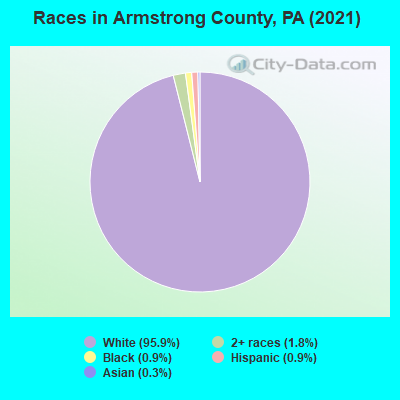
- 61,71495.4%White Non-Hispanic Alone
- 1,4312.2%Two or more races
- 6701.0%Black Non-Hispanic Alone
- 5920.9%Hispanic or Latino
- 2430.4%Asian alone
- 190.03%Some other race alone
- 80.01%American Indian and Alaska Native alone
| Median resident age: | 47.1 years |
| Pennsylvania median age: | 40.9 years |
| Males: 32,619 | |
| Females: 32,128 |

 | Pittsburgh MSA municipal population data (2020) (125 replies) |
| City Population Breakdown by Neighborhood 2000-2010; Predictions for 2010-2020? (305 replies) |
| Pittsburgh MSA gains 86,000+ people overnight! (27 replies) |
| Pittsburgh Metro and City keep loosing population (270 replies) |
| Pittsburgh area tornadoes… (41 replies) |
| Pittsburgh Area Municipal Estimates (17 replies) |
| Armstrong County: | 2.0 people |
| Pennsylvania: | 2 people |
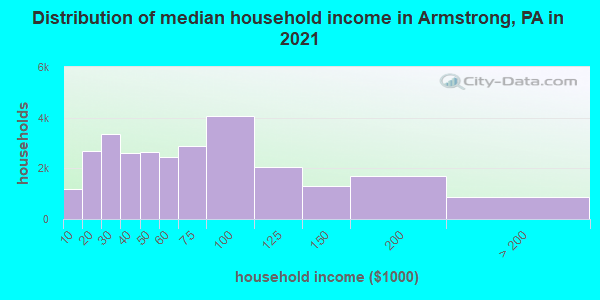
Estimated median household income in 2022: $57,500 ($31,557 in 1999)
| This county: | $57,500 |
| Pennsylvania: | $71,798 |
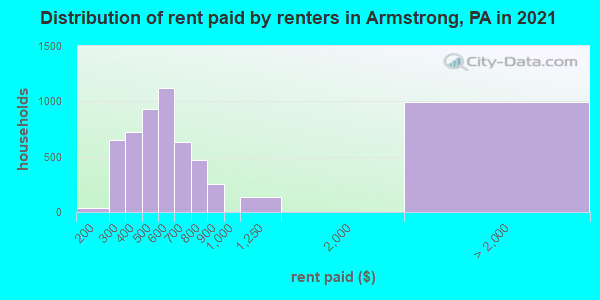
Median contract rent in 2022 for apartments: $599 (lower quartile is $419, upper quartile is $775)
| This county: | $599 |
| State: | $922 |
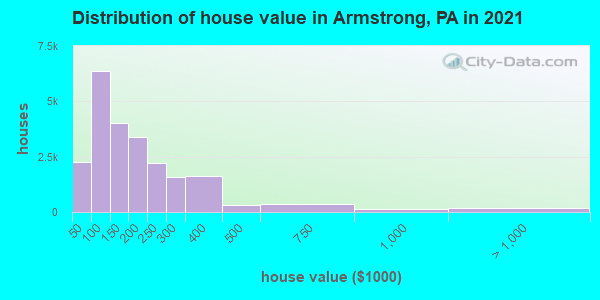
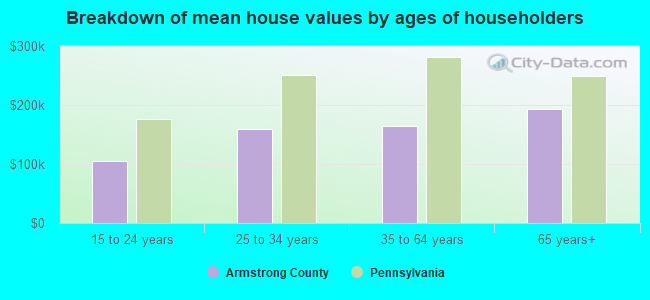
Estimated median house or condo value in 2022: $137,700 (it was $63,800 in 2000)
| Armstrong: | $137,700 |
| Pennsylvania: | $245,500 |
Mean price in 2022:
Median monthly housing costs for homes and condos with a mortgage: $1,131Detached houses: $185,358
Here: $185,358 State: $317,202 Townhouses or other attached units: $395,444
Here: $395,444 State: $254,369 In 2-unit structures: $137,008
Here: $137,008 State: $249,182 In 3-to-4-unit structures: $88,600
Here: $88,600 State: $297,446 In 5-or-more-unit structures: $295,998
Here: $295,998 State: $320,068 Mobile homes: $112,060
Here: $112,060 State: $92,414 Occupied boats, RVs, vans, etc.: $116,766
Here: $116,766 State: $563,750
Median monthly housing costs for units without a mortgage: $442
Institutionalized population: 500
Health of residents in Armstrong County based on CDC Behavioral Risk Factor Surveillance System Survey Questionnaires from 2013 to 2021:
General health status score of residents in this county from 1 (poor) to 5 (excellent) is 3.5. This is about average.74.1% of residents exercised in the past month. This is about average.
43.8% of residents smoked 100+ cigarettes in their lives. This is about average.
58.2% of adult residents drank alcohol in the past 30 days. This is less than average.
69.0% of residents visited a dentist within the past year. This is about average.
Average weight of males is 201 pounds. This is more than average.
Average weight of females is 162 pounds. This is about average.
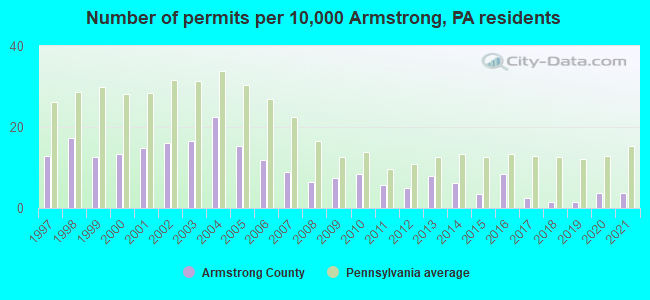
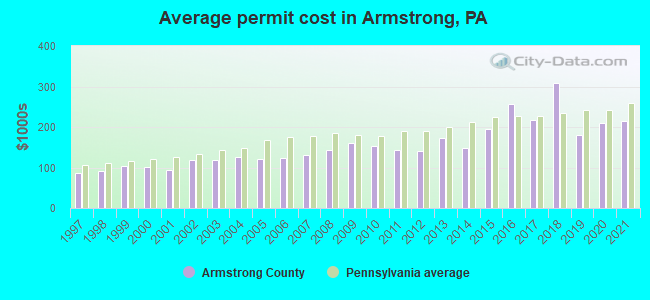
Single-family new house construction building permits:
- 2022: 44 buildings, average cost: $295,100
- 2021: 26 buildings, average cost: $216,400
- 2020: 26 buildings, average cost: $209,000
- 2019: 11 buildings, average cost: $180,800
- 2018: 11 buildings, average cost: $307,700
- 2017: 17 buildings, average cost: $218,400
- 2016: 61 buildings, average cost: $256,300
- 2015: 25 buildings, average cost: $194,200
- 2014: 45 buildings, average cost: $147,300
- 2013: 57 buildings, average cost: $173,000
- 2012: 35 buildings, average cost: $139,800
- 2011: 41 buildings, average cost: $143,000
- 2010: 60 buildings, average cost: $153,200
- 2009: 53 buildings, average cost: $160,300
- 2008: 46 buildings, average cost: $141,500
- 2007: 65 buildings, average cost: $131,800
- 2006: 85 buildings, average cost: $122,900
- 2005: 110 buildings, average cost: $120,200
- 2004: 163 buildings, average cost: $124,900
- 2003: 119 buildings, average cost: $118,100
- 2002: 117 buildings, average cost: $117,800
- 2001: 108 buildings, average cost: $95,200
- 2000: 97 buildings, average cost: $100,700
- 1999: 91 buildings, average cost: $103,300
- 1998: 125 buildings, average cost: $92,400
- 1997: 93 buildings, average cost: $86,700
Median real estate property taxes paid for housing units with mortgages in 2022: $2,282 (1.4%)
Median real estate property taxes paid for housing units with no mortgage in 2022: $1,616 (1.5%)
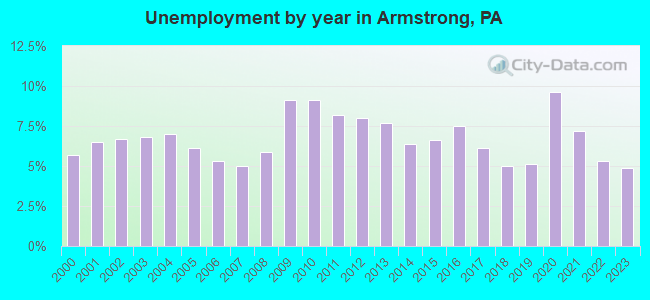
| Armstrong County: | 12.2% |
| Pennsylvania: | 11.8% |
Median age of residents in 2022: 47.1 years old
(Males: 46.0 years old, Females: 47.8 years old)
(Median age for: White residents: 48.0 years old, Black residents: 32.0 years old, American Indian residents: 50.7 years old, Asian residents: 46.1 years old, Hispanic or Latino residents: 34.1 years old, Other race residents: 34.3 years old)
Fair market rent in 2006 for a 1-bedroom apartment in Armstrong County is $457 a month.
Fair market rent for a 2-bedroom apartment is $506 a month.
Fair market rent for a 3-bedroom apartment is $648 a month.
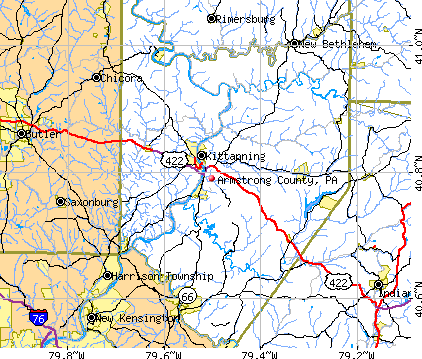
Cities in this county include: Kittanning, Ford City, Leechburg, Orchard Hills, Freeport, Apollo, North Apollo, North Vandergrift-Pleasant View, West Hills, Lenape Heights.
2023 air pollution in Armstrong County:
Ozone (1-hour): 0.037 ppm (standard limit: 0.12 ppm). Near U.S. average.
Particulate Matter (PM2.5) Annual: 10.7 µg/m3(standard limit: 15.0 µg/m3). Near U.S. average.
Neighboring counties: Allen County, Indiana  , Hudson County, New Jersey
  , Salt Lake County, Utah , Erie County, Ohio , Hancock County, Ohio , Mercer County
  , Richland County, Ohio .
| Here: | 3.6% |
| Pennsylvania: | 2.9% |
Current college students: 2,012
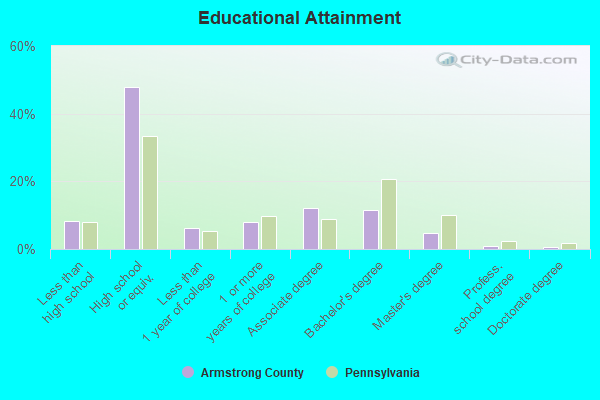
People 25 years of age or older with a high school degree or higher: 90.9%
People 25 years of age or older with a bachelor's degree or higher: 15.7%
Number of foreign born residents: 478 (36.4% naturalized citizens)
| Armstrong County: | 0.7% |
| Whole state: | 7.5% |
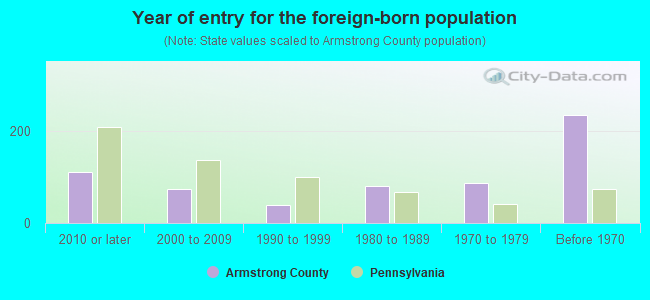
- Year of entry for the foreign-born population
- 1202010 or later
- 622000 to 2009
- 631990 to 1999
- 801980 to 1989
- 861970 to 1979
- 234Before 1970
Mean travel time to work (commute): minutes
Percentage of county residents living and working in this county: 99.4%
Housing units in structures:
- One, detached: 24,134
- One, attached: 1,234
- Two: 925
- 3 or 4: 688
- 5 to 9: 395
- 10 to 19: 241
- 20 to 49: 349
- 50 or more: 247
- Mobile homes: 3,906
- Boats, RVs, vans, etc.: 37
Housing units in Armstrong County with a mortgage: 10,802 (1,125 second mortgage, 186 home equity loan, 718 both second mortgage and home equity loan)
Houses without a mortgage: 1,044
| Here: | 90.9% with mortgage |
| State: | 93.8% with mortgage |
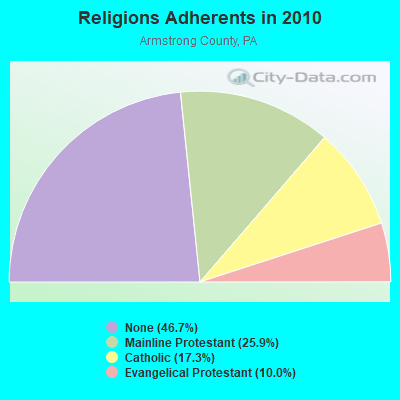
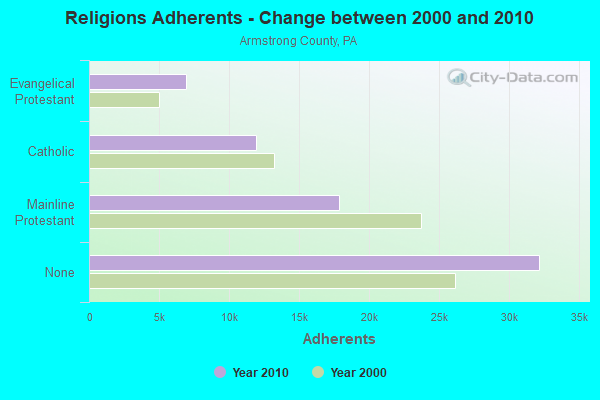
Religion statistics for Armstrong County
| Religion | Adherents | Congregations |
|---|---|---|
| Mainline Protestant | 17,886 | 78 |
| Catholic | 11,961 | 11 |
| Evangelical Protestant | 6,909 | 63 |
| Orthodox | - | - |
| Other | - | 2 |
| None | 32,185 | - |
Source: Clifford Grammich, Kirk Hadaway, Richard Houseal, Dale E.Jones, Alexei Krindatch, Richie Stanley and Richard H.Taylor. 2012. 2010 U.S.Religion Census: Religious Congregations & Membership Study. Association of Statisticians of American Religious Bodies. Jones, Dale E., et al. 2002. Congregations and Membership in the United States 2000. Nashville, TN: Glenmary Research Center.
Food Environment Statistics:
| Armstrong County: | 2.61 / 10,000 pop. |
| State: | 2.04 / 10,000 pop. |
| This county: | 0.72 / 10,000 pop. |
| Pennsylvania: | 0.88 / 10,000 pop. |
| Armstrong County: | 3.19 / 10,000 pop. |
| Pennsylvania: | 2.52 / 10,000 pop. |
| This county: | 5.80 / 10,000 pop. |
| State: | 7.12 / 10,000 pop. |
| Armstrong County: | 10.5% |
| Pennsylvania: | 9.1% |
| Armstrong County: | 29.7% |
| State: | 27.2% |
| Here: | 10.8% |
| State: | 11.5% |
Agriculture in Armstrong County:
Average size of farms: 177 acresAverage value of agricultural products sold per farm: $62,687
Average value of crops sold per acre for harvested cropland: $542.14
The value of livestock, poultry, and their products as a percentage of the total market value of agricultural products sold: 23.91%
Average total farm production expenses per farm: $60,874
Harvested cropland as a percentage of land in farms: 49.77%
Average market value of all machinery and equipment per farm: $60,428
The percentage of farms operated by a family or individual: 90.93%
Average age of principal farm operators: 56 years
Average number of cattle and calves per 100 acres of all land in farms: 11.76
Milk cows as a percentage of all cattle and calves: 21.60%
Corn for grain: 10115 harvested acres
All wheat for grain: 1647 harvested acres
Soybeans for beans: 2700 harvested acres
Vegetables: 149 harvested acres
Land in orchards: 133 acres
Earthquake activity:
Armstrong County-area historical earthquake activity is significantly above Pennsylvania state average. It is 59% smaller than the overall U.S. average.On 9/25/1998 at 19:52:52, a magnitude 5.2 (4.8 MB, 4.3 MS, 5.2 LG, 4.5 MW, Depth: 3.1 mi, Class: Moderate, Intensity: VI - VII) earthquake occurred 67.3 miles away from Armstrong County center
On 8/23/2011 at 17:51:04, a magnitude 5.8 (5.8 MW, Depth: 3.7 mi) earthquake occurred 216.0 miles away from the county center
On 1/31/1986 at 16:46:43, a magnitude 5.0 (5.0 MB) earthquake occurred 103.0 miles away from the county center
On 7/27/1980 at 18:52:21, a magnitude 5.2 (5.1 MB, 4.7 MS, 5.0 UK, 5.2 UK) earthquake occurred 296.7 miles away from the county center
On 1/16/1994 at 01:49:16, a magnitude 4.6 (4.6 MB, 4.6 LG, Depth: 3.1 mi, Class: Light, Intensity: IV - V) earthquake occurred 184.9 miles away from Armstrong County center
On 12/31/2011 at 20:05:01, a magnitude 4.0 (4.0 ML, Depth: 3.1 mi) earthquake occurred 65.9 miles away from the county center
Magnitude types: regional Lg-wave magnitude (LG), body-wave magnitude (MB), local magnitude (ML), surface-wave magnitude (MS), moment magnitude (MW)
Most recent natural disasters:
- Pennsylvania Covid-19 Pandemic, Incident Period: January 20, 2020, Major Disaster (Presidential) Declared DR-4506-PA: March 30, 2020, FEMA Id: 4506, Natural disaster type: Other
- Pennsylvania Hurricane Sandy, Incident Period: October 26, 2012 to November 08, 2012, Emergency Declared EM-3356: October 29, 2012, FEMA Id: 3356, Natural disaster type: Hurricane
- Pennsylvania Severe Winter Storms and Snowstorms, Incident Period: February 05, 2010 to February 11, 2010, Major Disaster (Presidential) Declared DR-1898: April 16, 2010, FEMA Id: 1898, Natural disaster type: Snowstorm, Winter Storm
- Pennsylvania Severe Storms, Flooding, and Mudslides, Incident Period: June 23, 2006 to July 10, 2006, Major Disaster (Presidential) Declared DR-1649: June 30, 2006, FEMA Id: 1649, Natural disaster type: Storm, Mudslide, Flood
- Pennsylvania Hurricane Katrina Evacuation, Incident Period: August 29, 2005 to October 01, 2005, Emergency Declared EM-3235: September 10, 2005, FEMA Id: 3235, Natural disaster type: Hurricane
- Pennsylvania Tropical Depression Ivan, Incident Period: September 17, 2004 to October 01, 2004, Major Disaster (Presidential) Declared DR-1557: September 19, 2004, FEMA Id: 1557, Natural disaster type: Tropical Depression
- Pennsylvania Flooding, Incident Period: July 19, 1996, Major Disaster (Presidential) Declared DR-1130: July 26, 1996, FEMA Id: 1130, Natural disaster type: Flood
- Pennsylvania Flooding, Incident Period: January 19, 1996 to February 01, 1996, Major Disaster (Presidential) Declared DR-1093: January 21, 1996, FEMA Id: 1093, Natural disaster type: Flood
- Pennsylvania Blizzard, Incident Period: January 06, 1996 to January 12, 1996, Major Disaster (Presidential) Declared DR-1085: January 13, 1996, FEMA Id: 1085, Natural disaster type: Blizzard
- Pennsylvania Winter Storm, Severe Storm, Incident Period: January 04, 1994 to February 25, 1994, Major Disaster (Presidential) Declared DR-1015: March 10, 1994, FEMA Id: 1015, Natural disaster type: Winter Storm, Storm
- 4 other natural disasters have been reported since 1953.
The number of natural disasters in Armstrong County (14) is near the US average (15).
Major Disasters (Presidential) Declared: 11
Emergencies Declared: 3
Causes of natural disasters: Floods: 5, Storms: 4, Winter Storms: 3, Hurricanes: 2, Blizzard: 1, Mudslide: 1, Snowfall: 1, Snowstorm: 1, Tropical Depression: 1, Tropical Storm: 1, Other: 1 (Note: some incidents may be assigned to more than one category).
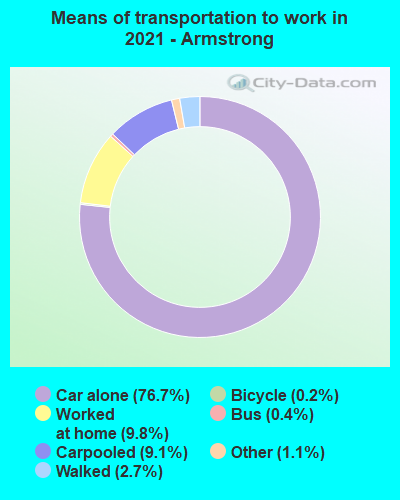
Means of transportation to work:
- Drove a car alone: 14,244 (72.6%)
- Carpooled: 1,855 (9.4%)
- Bus: 44 (0.2%)
- Light rail, streetcar or trolley: 8 (0.0%)
- Taxicab, motorcycle, or other means: 187 (1.0%)
- Bicycle: 28 (0.1%)
- Walked: 567 (2.9%)
- Worked at home: 2,752 (14.0%)
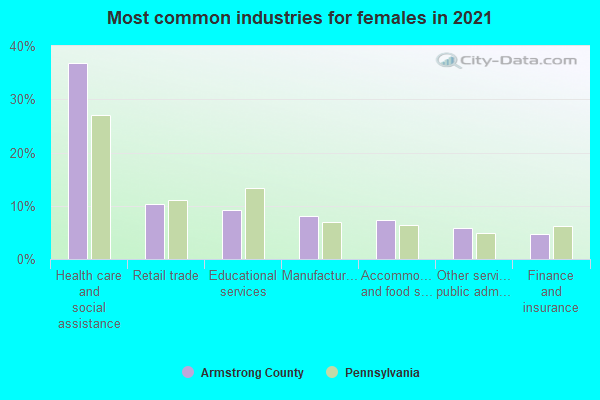
- Health care and social assistance (24%)
- Educational services (10%)
- Retail trade (10%)
- Manufacturing (7%)
- Finance and insurance (5%)
- Other services, except public administration (5%)
- Accommodation and food services (5%)
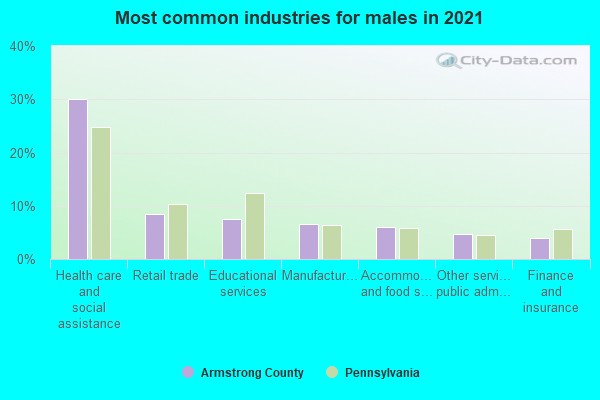
- Health care and social assistance (31%)
- Educational services (13%)
- Retail trade (13%)
- Manufacturing (8%)
- Finance and insurance (6%)
- Other services, except public administration (6%)
- Accommodation and food services (6%)
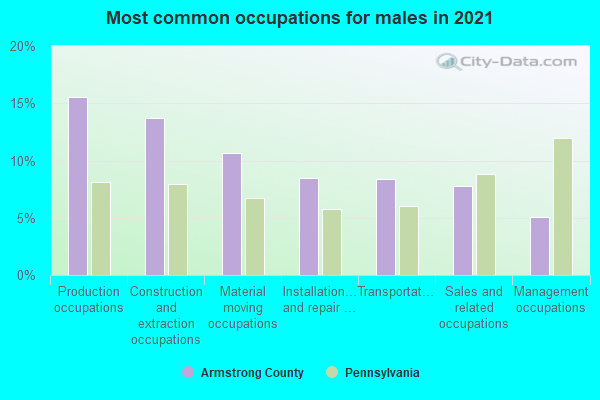
- Construction and extraction occupations (21%)
- Production occupations (16%)
- Sales and related occupations (10%)
- Management occupations (9%)
- Installation, maintenance, and repair occupations (8%)
- Material moving occupations (6%)
- Transportation occupations (5%)
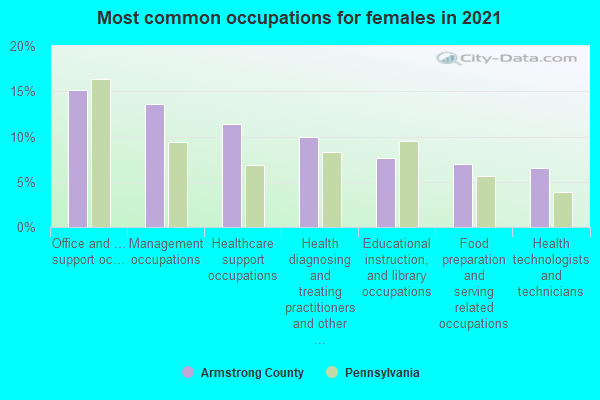
- Office and administrative support occupations (15%)
- Educational instruction, and library occupations (12%)
- Healthcare support occupations (9%)
- Health diagnosing and treating practitioners and other technical occupations (9%)
- Business and financial operations occupations (7%)
- Food preparation and serving related occupations (6%)
- Management occupations (6%)
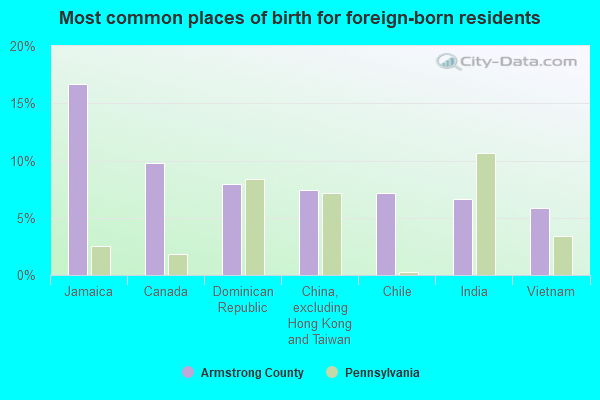
- China, excluding Hong Kong and Taiwan (14%)
- Jamaica (13%)
- Canada (11%)
- England (8%)
- Dominican Republic (8%)
- India (6%)
- Costa Rica (6%)
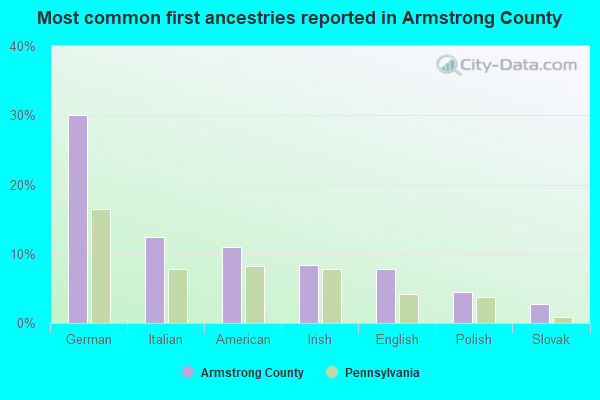
- German (30%)
- Italian (12%)
- American (11%)
- English (8%)
- Irish (8%)
- Polish (4%)
- Slovak (3%)
People in group quarters in Armstrong County, Pennsylvania in 2010:
- 324 people in nursing facilities/skilled-nursing facilities
- 159 people in local jails and other municipal confinement facilities
- 68 people in emergency and transitional shelters (with sleeping facilities) for people experiencing homelessness
- 57 people in group homes intended for adults
- 14 people in workers' group living quarters and job corps centers
- 11 people in correctional facilities intended for juveniles
- 8 people in other noninstitutional facilities
- 6 people in residential treatment centers for juveniles (non-correctional)
- 3 people in residential treatment centers for adults
People in group quarters in Armstrong County, Pennsylvania in 2000:
- 405 people in nursing homes
- 388 people in other noninstitutional group quarters
- 124 people in homes for the mentally retarded
- 95 people in college dormitories (includes college quarters off campus)
- 57 people in local jails and other confinement facilities (including police lockups)
- 57 people in homes for the mentally ill
- 31 people in other group homes
- 15 people in religious group quarters
- 3 people in homes for the physically handicapped
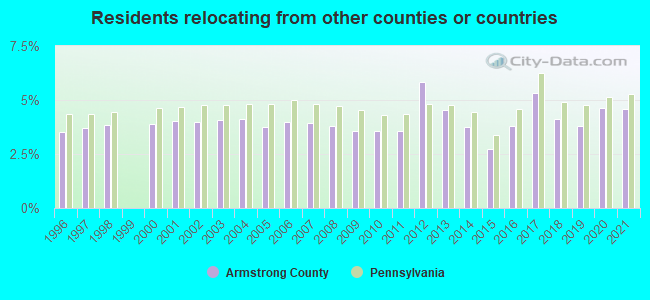
4.60% of this county's 2021 resident taxpayers lived in other counties in 2020 ($48,256 average adjusted gross income)
| Here: | 4.60% |
| Pennsylvania average: | 5.27% |
10 or fewer of this county's residents moved from foreign countries.
3.83% relocated from other counties in Pennsylvania ($39,345 average AGI)
0.77% relocated from other states ($8,911 average AGI)
Armstrong County: 0.77% Pennsylvania average: 2.30%
Top counties from which taxpayers relocated into this county between 2020 and 2021:
| from Westmoreland County, PA | |
| from Allegheny County, PA | |
| from Butler County, PA | |
| from Indiana County, PA | |
| from Clarion County, PA | |
| from Jefferson County, PA |
4.33% of this county's 2020 resident taxpayers moved to other counties in 2021 ($46,793 average adjusted gross income)
| Here: | 4.33% |
| Pennsylvania average: | 5.44% |
10 or fewer of this county's residents moved to foreign countries.
3.55% relocated to other counties in Pennsylvania ($36,377 average AGI)
0.78% relocated to other states ($10,416 average AGI)
Armstrong County: 0.78% Pennsylvania average: 2.47%

Top counties to which taxpayers relocated from this county between 2020 and 2021:
| to Westmoreland County, PA | |
| to Allegheny County, PA | |
| to Butler County, PA | |
| to Indiana County, PA | |
| to Clarion County, PA | |
| to Jefferson County, PA |
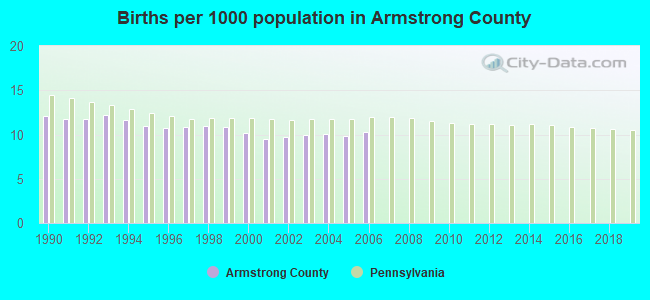
Births per 1000 population from 1990 to 1999: 11.4
Births per 1000 population from 2000 to 2006: 9.9
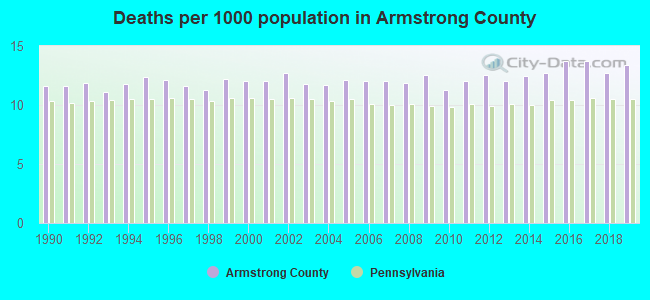
Deaths per 1000 population from 1990 to 1999: 11.8
Deaths per 1000 population from 2000 to 2009: 12.1
Deaths per 1000 population from 2010 to 2020: 12.8
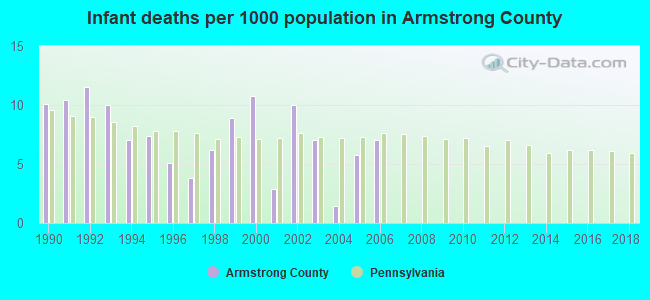
Infant deaths per 1000 live births from 1990 to 1999: 8.0
Infant deaths per 1000 live births from 2000 to 2006: 6.4
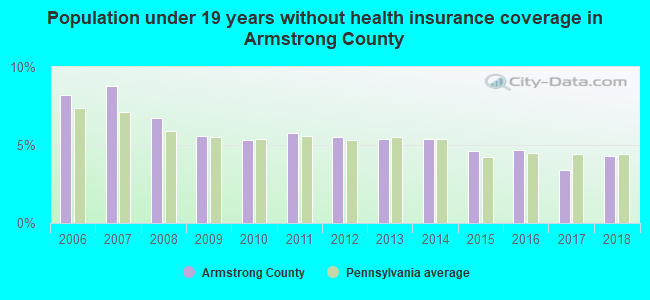
Persons under 19 years old without health insurance coverage in 2018: 4.3%

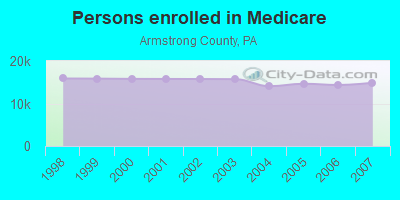
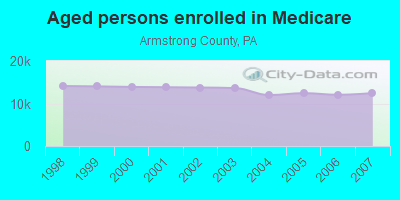
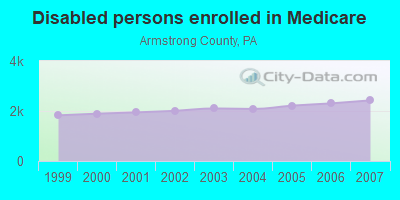
Persons enrolled in hospital insurance and/or supplemental medical insurance (Medicare) in July 1, 2007: 14,875 (12,450 aged, 2,425 disabled)
Children under 18 without health insurance coverage in 2007: 1,010 (7%)
Most common underlying causes of death in Armstrong County, Pennsylvania in 1999 - 2019:
- Atherosclerotic heart disease (1,435)
- Bronchus or lung, unspecified - Malignant neoplasms (991)
- Acute myocardial infarction, unspecified (985)
- Chronic obstructive pulmonary disease, unspecified (726)
- Unspecified dementia (633)
- Alzheimer disease, unspecified (548)
- Stroke, not specified as haemorrhage or infarction (524)
- Congestive heart failure (493)
- Pneumonia, unspecified (405)
- Heart failure, unspecified (312)
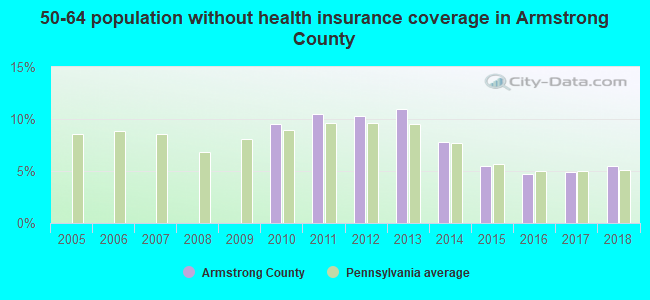
Population without health insurance coverage in 2000: 10%
Children under 18 without health insurance coverage in 2000: 8%
Short term general hospital admissions per 100,000 population in 2004: 10,223
Short term general hospital beds per 100,000 population in 2004: 206
Emergency room visits per 100,000 population in 2004: 30,379
General practice office based MDs per 100,000 population in 2005: 970
Medical specialist MDs per 100,000 population in 2005: 1,213
Dentists per 100,000 population in 1998: 24
Total births per 100,000 population, July 2005 - July 2006 : 34
Total deaths per 100,000 population, July 2005 - July 2006: 55
Limited-service eating places per 100,000 population in 2005 : 10
Beer, wine & liquor stores per 100,000 population in 2005: 1
Suicides per 1,000,000 population from 2000 to 2006: 126.9. This is more than state average.
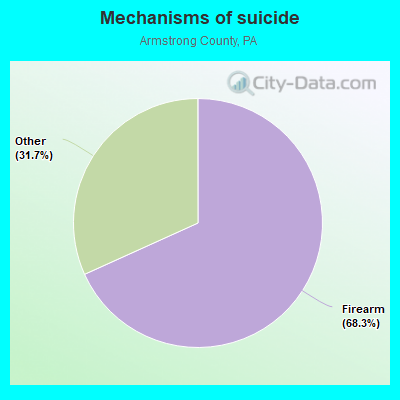
- Firearm - 86.6
- Other - 40.3
Household type by relationship:
Households: 64,747- Male householders: 14,018 (4,694 living alone), Female householders: 13,702 (3,962 living alone)
13,739 spouses (13,620 opposite-sex spouses), 2,635 unmarried partners, (2,615 opposite-sex unmarried partners), 16,070 children (14,593 natural, 106 adopted, 1,371 stepchildren), 676 grandchildren, 309 brothers or sisters, 461 parents, 0 foster children, 349 other relatives, 2,010 non-relatives
- In group quarters: 778
Size of family households: 8,658 2-persons, 3,833 3-persons, 3,241 4-persons, 1,108 5-persons, 183 6-persons, 231 7-or-more-persons.
Size of nonfamily households: 8,656 1-person, 1,458 2-persons, 279 3-persons, 21 4-persons, 52 7-or-more-persons.
8,343 married couples with children.
3,082 single-parent households (932 men, 2,150 women).
97.2% of residents of Armstrong speak English at home.
0.6% of residents speak Spanish at home (72% speak English very well, 18% speak English well, 6% speak English not well, 4% don't speak English at all).
1.4% of residents speak other Indo-European language at home (61% speak English very well, 27% speak English well, 8% speak English not well, 4% don't speak English at all).
0.4% of residents speak Asian or Pacific Island language at home (45% speak English very well, 30% speak English well, 25% speak English not well).
0.1% of residents speak other language at home (100% speak English very well).
In fiscal year 2004:
Federal Government expenditure: $486,211,000 ($6,810 per capita)
Department of Defense expenditure: $20,923,000
Federal direct payments to individuals for retirement and disability: $231,287,000
Federal other direct payments to individuals: $138,744,000
Federal direct payments not to individuals: $1,018,000
Federal grants: $82,630,000
Federal procurement contracts: $17,776,000 ($13,539,000 Department of Defense)
Federal salaries and wages: $14,756,000 ($2,515,000 Department of Defense)
Federal Government direct loans: $796,000
Federal guaranteed/insured loans: $22,863,000
Federal Government insurance: $49,655,000
Population change from April 1, 2000 to July 1, 2005:
Births: 3,666| Here: | 52 per 1000 residents |
| State: | 61 per 1000 residents |
Deaths: 4,527
| Here: | 64 per 1000 residents |
| State: | 54 per 1000 residents |
Net international migration: +24
| Here: | +0 per 1000 residents |
| State: | +8 per 1000 residents |
Net internal migration: -872
| Here: | |
| State: |
Total withdrawal of fresh water for public supply: 4.77 millions of gallons per day (34% from ground, 66% from surface)
| Here: | 6.5 |
| State: | 6.8 |
| Here: | 5.2 |
| State: | 4.3 |
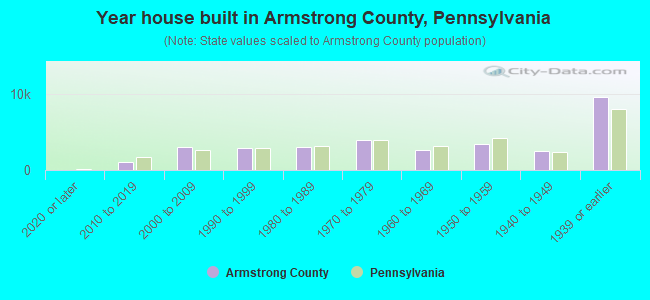
- Year house built in Armstrong County, Pennsylvania
- 1512020 or later
- 1,4722010 to 2019
- 2,3992000 to 2009
- 2,1391990 to 1999
- 2,7241980 to 1989
- 4,2351970 to 1979
- 2,5131960 to 1969
- 4,0541950 to 1959
- 3,2471940 to 1949
- 9,2221939 or earlier
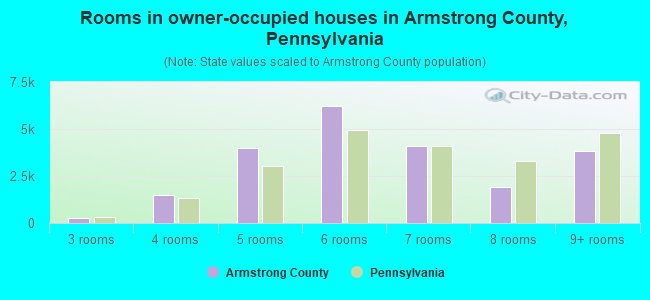
- Rooms in owner-occupied houses in Armstrong County, Pennsylvania
- 1831 room
- 962 rooms
- 4783 rooms
- 1,9174 rooms
- 4,0695 rooms
- 4,2296 rooms
- 4,3767 rooms
- 2,4738 rooms
- 3,8129+ rooms
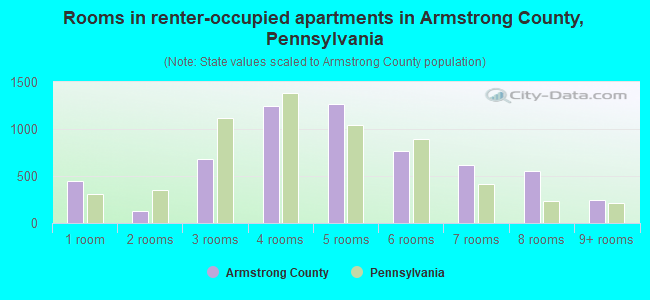
- Rooms in renter-occupied apartments in Armstrong County, Pennsylvania
- 1141 room
- 5192 rooms
- 3323 rooms
- 1,0604 rooms
- 1,3645 rooms
- 9436 rooms
- 1,0007 rooms
- 5528 rooms
- 2039+ rooms
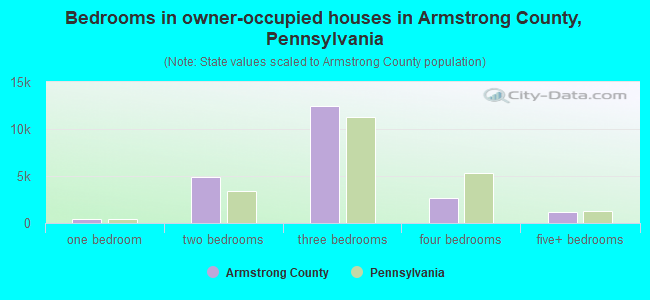
- Bedrooms in owner-occupied houses in Armstrong County, Pennsylvania
- 183no bedroom
- 6891 bedroom
- 5,8402 bedrooms
- 11,1313 bedrooms
- 2,7204 bedrooms
- 1,0705+ bedrooms
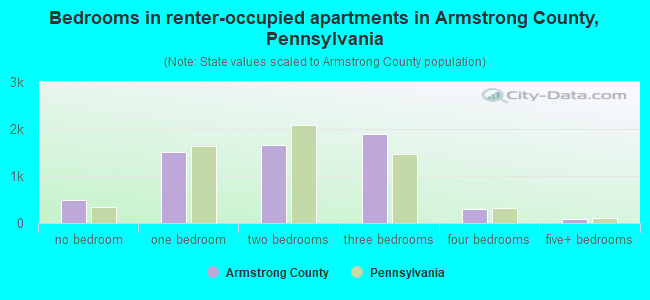
- Bedrooms in renter-occupied apartments in Armstrong County, Pennsylvania
- 310no bedroom
- 1,0161 bedroom
- 1,5212 bedrooms
- 2,6733 bedrooms
- 5674 bedrooms
- 05+ bedrooms
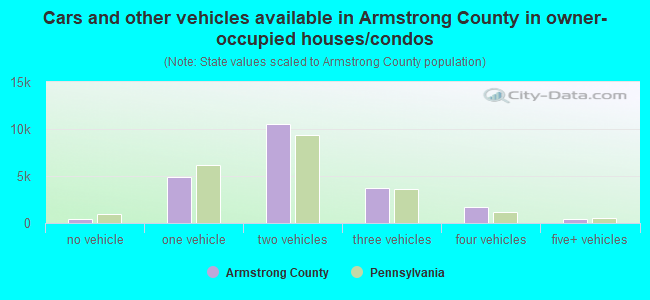
- Cars and other vehicles available in Armstrong County in owner-occupied houses/condos
- 872no vehicle
- 5,1321 vehicle
- 9,8262 vehicles
- 3,8303 vehicles
- 1,4424 vehicles
- 5315+ vehicles
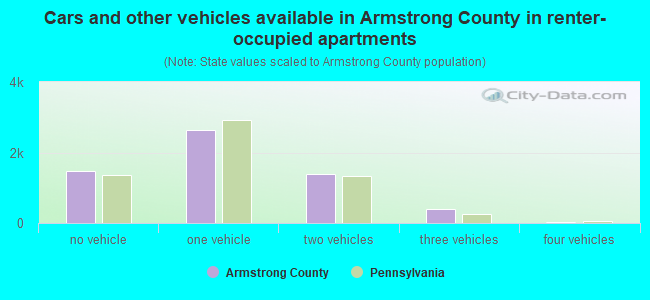
- Cars and other vehicles available in Armstrong County in renter-occupied apartments
- 1,239no vehicle
- 2,9241 vehicle
- 1,5582 vehicles
- 2433 vehicles
- 1134 vehicles
- 105+ vehicles
93.5% of Armstrong County residents lived in the same house 1 years ago.
Out of people who lived in different houses, 40% lived in this county.
Out of people who lived in different counties, 83% lived in Pennsylvania.
| Armstrong County: | 93.5% |
| State average: | 89.3% |
Place of birth for U.S.-born residents:
- This state: 58,462
- Other state: 5,639
- Northeast: 1,030
- Midwest: 838
- South: 2,728
- West: 1,043
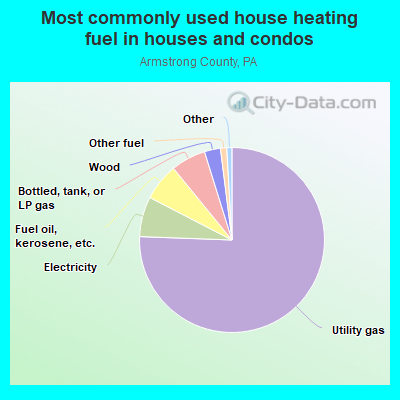
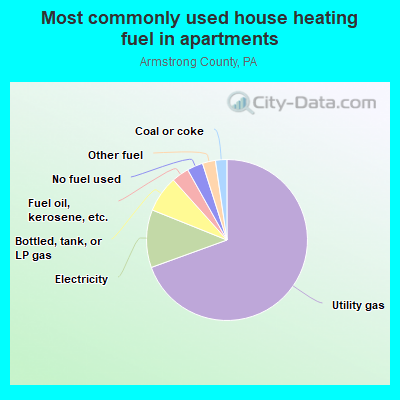
- 77.0%Utility gas
- 8.6%Electricity
- 5.7%Fuel oil, kerosene, etc.
- 4.5%Bottled, tank, or LP gas
- 2.7%Wood
- 1.2%Other fuel
- 0.1%Coal or coke
- 0.1%Solar energy
- 72.3%Utility gas
- 18.5%Electricity
- 4.9%Bottled, tank, or LP gas
- 2.4%Fuel oil, kerosene, etc.
- 0.9%Wood
- 0.7%Other fuel
- 0.4%No fuel used
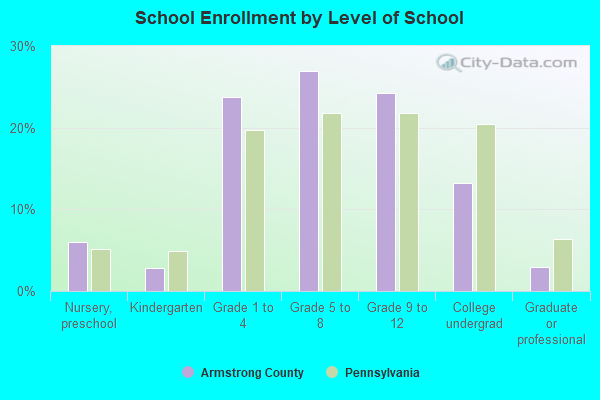
Private vs. public school enrollment:
| Here: | 5.0% |
| Pennsylvania: | 15.7% |
| Here: | 8.0% |
| Pennsylvania: | 13.4% |
| Here: | 22.5% |
| Pennsylvania: | 39.8% |

Armstrong County government finances - Expenditure in 2018:
- Charges - Other: $8,684,000
- Current Operations - Judicial and Legal Services: $6,924,000
Correctional Institutions: $5,312,000
Public Welfare - Other: $4,387,000
Health - Other: $3,690,000
Financial Administration: $2,895,000
Central Staff Services: $2,895,000
General - Other: $2,851,000
Natural Resources - Other: $2,508,000
Corrections - Other: $2,097,000
Police Protection: $1,463,000
Parks and Recreation: $890,000
Housing and Community Development: $543,000
Regular Highways: $62,000
- Federal Intergovernmental - Other: $1,246,000
Public Welfare: $1,139,000
Housing and Community Development: $603,000
General Local Government Support: $27,000
- General - Interest on Debt: $1,641,000
- Local Intergovernmental - Highways: $24,000
- Long Term Debt - Beginning Outstanding - Unspecified Public Purpose: $51,708,000
Outstanding Unspecified Public Purpose: $49,092,000
Retired Unspecified Public Purpose: $2,615,000
- Miscellaneous - General Revenue - Other: $618,000
Fines and Forfeits: $312,000
Rents: $162,000
Interest Earnings: $101,000
Donations From Private Sources: $10,000
- Other Capital Outlay - Police Protection: $330,000
Central Staff Services: $134,000
Judicial and Legal Services: $102,000
Health - Other: $49,000
- Other Funds - Cash and Securities: $11,973,000
- State Intergovernmental - Other: $2,373,000
Health and Hospitals: $2,318,000
Public Welfare: $2,229,000
General Local Government Support: $1,305,000
Housing and Community Development: $483,000
- Tax - Property: $18,439,000
Other Selective Sales: $149,000
Other License: $59,000
- Total Salaries and Wages: $13,212,000
Armstrong County government finances - Revenue in 2018:
- Charges - Other: $8,684,000
- Current Operations - Judicial and Legal Services: $6,924,000
Correctional Institutions: $5,312,000
Public Welfare - Other: $4,387,000
Health - Other: $3,690,000
Financial Administration: $2,895,000
Central Staff Services: $2,895,000
General - Other: $2,851,000
Natural Resources - Other: $2,508,000
Corrections - Other: $2,097,000
Police Protection: $1,463,000
Parks and Recreation: $890,000
Housing and Community Development: $543,000
Regular Highways: $62,000
- Federal Intergovernmental - Other: $1,246,000
Public Welfare: $1,139,000
Housing and Community Development: $603,000
General Local Government Support: $27,000
- General - Interest on Debt: $1,641,000
- Local Intergovernmental - Highways: $24,000
- Long Term Debt - Beginning Outstanding - Unspecified Public Purpose: $51,708,000
Outstanding Unspecified Public Purpose: $49,092,000
Retired Unspecified Public Purpose: $2,615,000
- Miscellaneous - General Revenue - Other: $618,000
Fines and Forfeits: $312,000
Rents: $162,000
Interest Earnings: $101,000
Donations From Private Sources: $10,000
- Other Capital Outlay - Police Protection: $330,000
Central Staff Services: $134,000
Judicial and Legal Services: $102,000
Health - Other: $49,000
- Other Funds - Cash and Securities: $11,973,000
- State Intergovernmental - Other: $2,373,000
Health and Hospitals: $2,318,000
Public Welfare: $2,229,000
General Local Government Support: $1,305,000
Housing and Community Development: $483,000
- Tax - Property: $18,439,000
Other Selective Sales: $149,000
Other License: $59,000
- Total Salaries and Wages: $13,212,000
Armstrong County government finances - Debt in 2018:
- Charges - Other: $8,684,000
- Current Operations - Judicial and Legal Services: $6,924,000
Correctional Institutions: $5,312,000
Public Welfare - Other: $4,387,000
Health - Other: $3,690,000
Financial Administration: $2,895,000
Central Staff Services: $2,895,000
General - Other: $2,851,000
Natural Resources - Other: $2,508,000
Corrections - Other: $2,097,000
Police Protection: $1,463,000
Parks and Recreation: $890,000
Housing and Community Development: $543,000
Regular Highways: $62,000
- Federal Intergovernmental - Other: $1,246,000
Public Welfare: $1,139,000
Housing and Community Development: $603,000
General Local Government Support: $27,000
- General - Interest on Debt: $1,641,000
- Local Intergovernmental - Highways: $24,000
- Long Term Debt - Beginning Outstanding - Unspecified Public Purpose: $51,708,000
Outstanding Unspecified Public Purpose: $49,092,000
Retired Unspecified Public Purpose: $2,615,000
- Miscellaneous - General Revenue - Other: $618,000
Fines and Forfeits: $312,000
Rents: $162,000
Interest Earnings: $101,000
Donations From Private Sources: $10,000
- Other Capital Outlay - Police Protection: $330,000
Central Staff Services: $134,000
Judicial and Legal Services: $102,000
Health - Other: $49,000
- Other Funds - Cash and Securities: $11,973,000
- State Intergovernmental - Other: $2,373,000
Health and Hospitals: $2,318,000
Public Welfare: $2,229,000
General Local Government Support: $1,305,000
Housing and Community Development: $483,000
- Tax - Property: $18,439,000
Other Selective Sales: $149,000
Other License: $59,000
- Total Salaries and Wages: $13,212,000
Armstrong County government finances - Cash and Securities in 2018:
- Charges - Other: $8,684,000
- Current Operations - Judicial and Legal Services: $6,924,000
Correctional Institutions: $5,312,000
Public Welfare - Other: $4,387,000
Health - Other: $3,690,000
Financial Administration: $2,895,000
Central Staff Services: $2,895,000
General - Other: $2,851,000
Natural Resources - Other: $2,508,000
Corrections - Other: $2,097,000
Police Protection: $1,463,000
Parks and Recreation: $890,000
Housing and Community Development: $543,000
Regular Highways: $62,000
- Federal Intergovernmental - Other: $1,246,000
Public Welfare: $1,139,000
Housing and Community Development: $603,000
General Local Government Support: $27,000
- General - Interest on Debt: $1,641,000
- Local Intergovernmental - Highways: $24,000
- Long Term Debt - Beginning Outstanding - Unspecified Public Purpose: $51,708,000
Outstanding Unspecified Public Purpose: $49,092,000
Retired Unspecified Public Purpose: $2,615,000
- Miscellaneous - General Revenue - Other: $618,000
Fines and Forfeits: $312,000
Rents: $162,000
Interest Earnings: $101,000
Donations From Private Sources: $10,000
- Other Capital Outlay - Police Protection: $330,000
Central Staff Services: $134,000
Judicial and Legal Services: $102,000
Health - Other: $49,000
- Other Funds - Cash and Securities: $11,973,000
- State Intergovernmental - Other: $2,373,000
Health and Hospitals: $2,318,000
Public Welfare: $2,229,000
General Local Government Support: $1,305,000
Housing and Community Development: $483,000
- Tax - Property: $18,439,000
Other Selective Sales: $149,000
Other License: $59,000
- Total Salaries and Wages: $13,212,000
Supplemental Security Income (SSI) in 2006:
- Total number of recipients: 2,133
- Number of aged recipients: 152
- Number of blind and disabled recipients: 1,981
- Number of recipients under 18: 281
- Number of recipients between 18 and 64: 1,500
- Number of recipients older than 64: 352
- Number of recipients also receiving OASDI: 766
- Amount of payments (thousands of dollars): 998
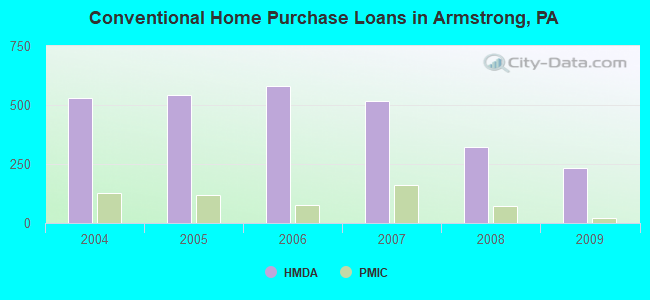
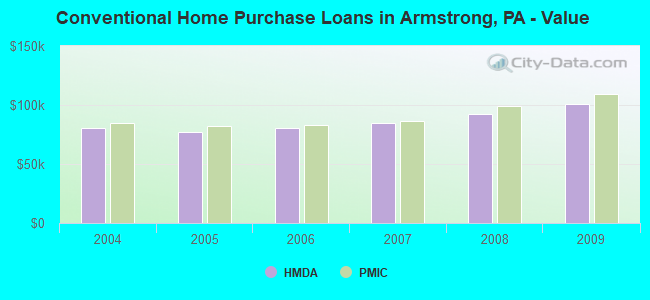
| Home Mortgage Disclosure Act Aggregated Statistics For Year 2009 (Based on 19 full tracts) | ||||||||||||
| A) FHA, FSA/RHS & VA Home Purchase Loans | B) Conventional Home Purchase Loans | C) Refinancings | D) Home Improvement Loans | F) Non-occupant Loans on < 5 Family Dwellings (A B C & D) | G) Loans On Manufactured Home Dwelling (A B C & D) | |||||||
|---|---|---|---|---|---|---|---|---|---|---|---|---|
| Number | Average Value | Number | Average Value | Number | Average Value | Number | Average Value | Number | Average Value | Number | Average Value | |
| LOANS ORIGINATED | 150 | $94,133 | 233 | $100,524 | 757 | $101,112 | 270 | $36,070 | 55 | $78,655 | 52 | $58,442 |
| APPLICATIONS APPROVED, NOT ACCEPTED | 3 | $124,333 | 11 | $101,545 | 62 | $94,661 | 22 | $26,000 | 1 | $150,000 | 12 | $62,083 |
| APPLICATIONS DENIED | 32 | $112,656 | 86 | $80,384 | 464 | $105,446 | 132 | $25,288 | 17 | $61,471 | 47 | $70,404 |
| APPLICATIONS WITHDRAWN | 14 | $137,214 | 40 | $86,375 | 240 | $113,275 | 30 | $36,967 | 11 | $68,091 | 14 | $111,000 |
| FILES CLOSED FOR INCOMPLETENESS | 4 | $88,750 | 4 | $119,000 | 35 | $125,343 | 8 | $41,250 | 3 | $116,333 | 0 | $0 |
| Private Mortgage Insurance Companies Aggregated Statistics For Year 2009 (Based on 18 full tracts) | ||||||
| A) Conventional Home Purchase Loans | B) Refinancings | C) Non-occupant Loans on < 5 Family Dwellings (A & B) | ||||
|---|---|---|---|---|---|---|
| Number | Average Value | Number | Average Value | Number | Average Value | |
| LOANS ORIGINATED | 20 | $108,900 | 10 | $143,000 | 2 | $44,500 |
| APPLICATIONS APPROVED, NOT ACCEPTED | 3 | $85,000 | 5 | $102,600 | 0 | $0 |
| APPLICATIONS DENIED | 3 | $174,000 | 5 | $214,800 | 0 | $0 |
| APPLICATIONS WITHDRAWN | 2 | $88,000 | 4 | $203,000 | 0 | $0 |
| FILES CLOSED FOR INCOMPLETENESS | 0 | $0 | 0 | $0 | 0 | $0 |
| Most common first names in Armstrong County, PA among deceased individuals | ||
| Name | Count | Lived (average) |
|---|---|---|
| John | 948 | 75.0 years |
| Mary | 933 | 81.3 years |
| William | 766 | 74.4 years |
| James | 594 | 73.5 years |
| Robert | 536 | 72.3 years |
| Charles | 480 | 75.2 years |
| Joseph | 444 | 75.8 years |
| Margaret | 394 | 80.9 years |
| Anna | 381 | 82.5 years |
| Helen | 359 | 79.3 years |
| Most common last names in Armstrong County, PA among deceased individuals | ||
| Last name | Count | Lived (average) |
|---|---|---|
| Smith | 309 | 77.0 years |
| Bowser | 287 | 77.8 years |
| Miller | 189 | 75.4 years |
| Klingensmith | 123 | 76.1 years |
| Walker | 119 | 73.5 years |
| Hill | 104 | 78.3 years |
| Baker | 102 | 78.2 years |
| Snyder | 97 | 77.6 years |
| Myers | 95 | 77.0 years |
| Wolfe | 94 | 76.8 years |
| Businesses in Armstrong County, PA | ||||
| Name | Count | Name | Count | |
|---|---|---|---|---|
| AT&T | 1 | Little Caesars Pizza | 1 | |
| Ace Hardware | 1 | Long John Silver's | 1 | |
| Advance Auto Parts | 2 | MasterBrand Cabinets | 2 | |
| Arby's | 1 | McDonald's | 2 | |
| AutoZone | 1 | Nike | 4 | |
| Chevrolet | 2 | Payless | 1 | |
| Cricket Wireless | 3 | Pizza Hut | 2 | |
| Curves | 2 | Quality | 1 | |
| Dairy Queen | 3 | RadioShack | 2 | |
| Famous Footwear | 1 | Rite Aid | 4 | |
| Fashion Bug | 1 | Rodeway Inn | 1 | |
| FedEx | 4 | Sears | 2 | |
| Ford | 2 | Subway | 5 | |
| GNC | 2 | T-Mobile | 2 | |
| GameStop | 1 | Taco Bell | 1 | |
| H&R Block | 3 | U-Haul | 8 | |
| Jones New York | 1 | UPS | 5 | |
| KFC | 1 | Walmart | 1 | |
| Kmart | 1 | Wendy's | 2 | |
| La-Z-Boy | 1 | YMCA | 2 | |
| Lane Furniture | 1 | |||
Armstrong County on our top lists:
- #41 on the list of "Top 101 counties with the lowest percentage of residents relocating from other counties between 2010 and 2011 (pop. 50,000+)"
- #57 on the list of "Top 101 counties with the lowest percentage of residents relocating to other counties in 2011 (pop. 50,000+)"
- #59 on the list of "Top 101 counties with the highest number of deaths per 1000 residents 2007-2013 (pop. 50,000+)"
- #69 on the list of "Top 101 counties with the lowest percentage of residents relocating from other counties between 2010 and 2011"
- #89 on the list of "Top 101 counties with the lowest percentage of residents relocating to other counties in 2011"