Kittanning, Pennsylvania Submit your own pictures of this borough and show them to the world
OSM Map
General Map
Google Map
MSN Map
OSM Map
General Map
Google Map
MSN Map
OSM Map
General Map
Google Map
MSN Map
OSM Map
General Map
Google Map
MSN Map
Please wait while loading the map...
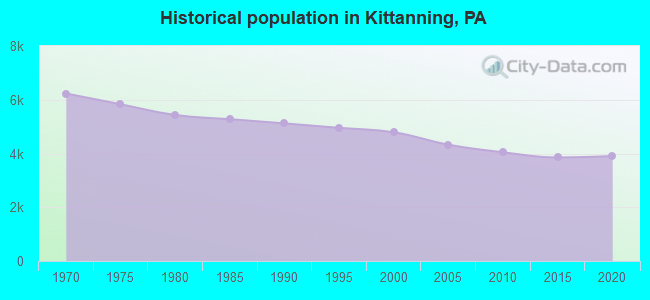
Population in 2022: 3,923 (100% urban, 0% rural). Population change since 2000: -18.0%Males: 1,969 Females: 1,954
March 2022 cost of living index in Kittanning: 88.9 (less than average, U.S. average is 100) Percentage of residents living in poverty in 2022: 20.7%for White Non-Hispanic residents , 71.0% for Black residents , 100.0% for American Indian residents )
Profiles of local businesses
Business Search - 14 Million verified businesses
Data:
Median household income ($)
Median household income (% change since 2000)
Household income diversity
Ratio of average income to average house value (%)
Ratio of average income to average rent
Median household income ($) - White
Median household income ($) - Black or African American
Median household income ($) - Asian
Median household income ($) - Hispanic or Latino
Median household income ($) - American Indian and Alaska Native
Median household income ($) - Multirace
Median household income ($) - Other Race
Median household income for houses/condos with a mortgage ($)
Median household income for apartments without a mortgage ($)
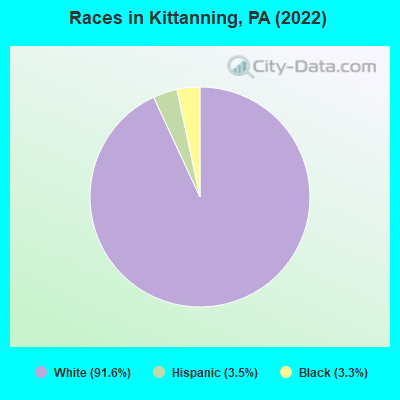
Races - White alone (%)
Races - White alone (% change since 2000)
Races - Black alone (%)
Races - Black alone (% change since 2000)
Races - American Indian alone (%)
Races - American Indian alone (% change since 2000)
Races - Asian alone (%)
Races - Asian alone (% change since 2000)
Races - Hispanic (%)
Races - Hispanic (% change since 2000)
Races - Native Hawaiian and Other Pacific Islander alone (%)
Races - Native Hawaiian and Other Pacific Islander alone (% change since 2000)
Races - Two or more races (%)
Races - Two or more races (% change since 2000)
Races - Other race alone (%)
Races - Other race alone (% change since 2000)
Racial diversity
Unemployment (%)
Unemployment (% change since 2000)
Unemployment (%) - White
Unemployment (%) - Black or African American
Unemployment (%) - Asian
Unemployment (%) - Hispanic or Latino
Unemployment (%) - American Indian and Alaska Native
Unemployment (%) - Multirace
Unemployment (%) - Other Race
Population density (people per square mile)
Population - Males (%)
Population - Females (%)
Population - Males (%) - White
Population - Males (%) - Black or African American
Population - Males (%) - Asian
Population - Males (%) - Hispanic or Latino
Population - Males (%) - American Indian and Alaska Native
Population - Males (%) - Multirace
Population - Males (%) - Other Race
Population - Females (%) - White
Population - Females (%) - Black or African American
Population - Females (%) - Asian
Population - Females (%) - Hispanic or Latino
Population - Females (%) - American Indian and Alaska Native
Population - Females (%) - Multirace
Population - Females (%) - Other Race
Coronavirus confirmed cases (May 13, 2024)
Deaths caused by coronavirus (May 13, 2024)
Coronavirus confirmed cases (per 100k population) (May 13, 2024)
Deaths caused by coronavirus (per 100k population) (May 13, 2024)
Daily increase in number of cases (May 13, 2024)
Weekly increase in number of cases (May 13, 2024)
Cases doubled (in days) (May 13, 2024)
Hospitalized patients (Apr 18, 2022)
Negative test results (Apr 18, 2022)
Total test results (Apr 18, 2022)
COVID Vaccine doses distributed (per 100k population) (Sep 19, 2023)
COVID Vaccine doses administered (per 100k population) (Sep 19, 2023)
COVID Vaccine doses distributed (Sep 19, 2023)
COVID Vaccine doses administered (Sep 19, 2023)
Likely homosexual households (%)
Likely homosexual households (% change since 2000)
Likely homosexual households - Lesbian couples (%)
Likely homosexual households - Lesbian couples (% change since 2000)
Likely homosexual households - Gay men (%)
Likely homosexual households - Gay men (% change since 2000)
Cost of living index
Median gross rent ($)
Median contract rent ($)
Median monthly housing costs ($)
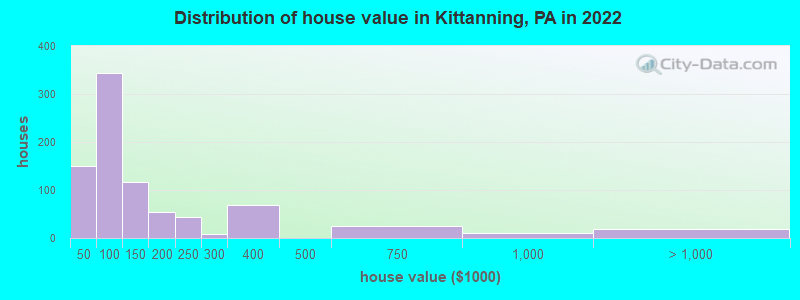
Median house or condo value ($)
Median house or condo value ($ change since 2000)
Mean house or condo value by units in structure - 1, detached ($)
Mean house or condo value by units in structure - 1, attached ($)
Mean house or condo value by units in structure - 2 ($)
Mean house or condo value by units in structure by units in structure - 3 or 4 ($)
Mean house or condo value by units in structure - 5 or more ($)
Mean house or condo value by units in structure - Boat, RV, van, etc. ($)
Mean house or condo value by units in structure - Mobile home ($)
Median house or condo value ($) - White
Median house or condo value ($) - Black or African American
Median house or condo value ($) - Asian
Median house or condo value ($) - Hispanic or Latino
Median house or condo value ($) - American Indian and Alaska Native
Median house or condo value ($) - Multirace
Median house or condo value ($) - Other Race
Median resident age
Resident age diversity
Median resident age - Males
Median resident age - Females
Median resident age - White
Median resident age - Black or African American
Median resident age - Asian
Median resident age - Hispanic or Latino
Median resident age - American Indian and Alaska Native
Median resident age - Multirace
Median resident age - Other Race
Median resident age - Males - White
Median resident age - Males - Black or African American
Median resident age - Males - Asian
Median resident age - Males - Hispanic or Latino
Median resident age - Males - American Indian and Alaska Native
Median resident age - Males - Multirace
Median resident age - Males - Other Race
Median resident age - Females - White
Median resident age - Females - Black or African American
Median resident age - Females - Asian
Median resident age - Females - Hispanic or Latino
Median resident age - Females - American Indian and Alaska Native
Median resident age - Females - Multirace
Median resident age - Females - Other Race
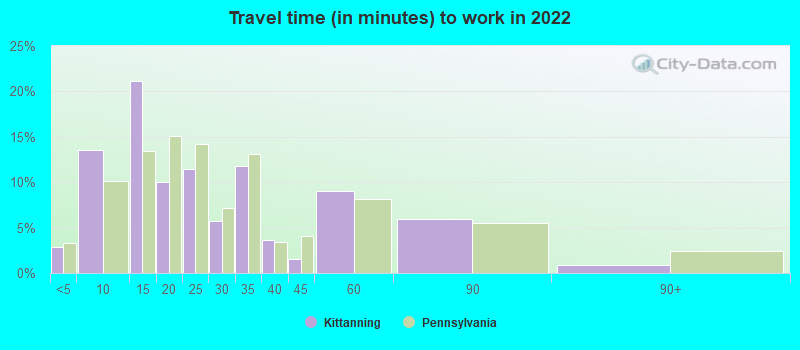
Commute - mean travel time to work (minutes)
Travel time to work - Less than 5 minutes (%)
Travel time to work - Less than 5 minutes (% change since 2000)
Travel time to work - 5 to 9 minutes (%)
Travel time to work - 5 to 9 minutes (% change since 2000)
Travel time to work - 10 to 19 minutes (%)
Travel time to work - 10 to 19 minutes (% change since 2000)
Travel time to work - 20 to 29 minutes (%)
Travel time to work - 20 to 29 minutes (% change since 2000)
Travel time to work - 30 to 39 minutes (%)
Travel time to work - 30 to 39 minutes (% change since 2000)
Travel time to work - 40 to 59 minutes (%)
Travel time to work - 40 to 59 minutes (% change since 2000)
Travel time to work - 60 to 89 minutes (%)
Travel time to work - 60 to 89 minutes (% change since 2000)
Travel time to work - 90 or more minutes (%)
Travel time to work - 90 or more minutes (% change since 2000)
Marital status - Never married (%)
Marital status - Now married (%)
Marital status - Separated (%)
Marital status - Widowed (%)
Marital status - Divorced (%)
Median family income ($)
Median family income (% change since 2000)
Median non-family income ($)
Median non-family income (% change since 2000)
Median per capita income ($)
Median per capita income (% change since 2000)
Median family income ($) - White
Median family income ($) - Black or African American
Median family income ($) - Asian
Median family income ($) - Hispanic or Latino
Median family income ($) - American Indian and Alaska Native
Median family income ($) - Multirace
Median family income ($) - Other Race
Median year house/condo built
Median year apartment built
Year house built - Built 2005 or later (%)
Year house built - Built 2000 to 2004 (%)
Year house built - Built 1990 to 1999 (%)
Year house built - Built 1980 to 1989 (%)
Year house built - Built 1970 to 1979 (%)
Year house built - Built 1960 to 1969 (%)
Year house built - Built 1950 to 1959 (%)
Year house built - Built 1940 to 1949 (%)
Year house built - Built 1939 or earlier (%)
Average household size
Household density (households per square mile)
Average household size - White
Average household size - Black or African American
Average household size - Asian
Average household size - Hispanic or Latino
Average household size - American Indian and Alaska Native
Average household size - Multirace
Average household size - Other Race
Occupied housing units (%)
Vacant housing units (%)
Owner occupied housing units (%)
Renter occupied housing units (%)
Vacancy status - For rent (%)
Vacancy status - For sale only (%)
Vacancy status - Rented or sold, not occupied (%)
Vacancy status - For seasonal, recreational, or occasional use (%)
Vacancy status - For migrant workers (%)
Vacancy status - Other vacant (%)
Residents with income below the poverty level (%)
Residents with income below 50% of the poverty level (%)
Children below poverty level (%)
Poor families by family type - Married-couple family (%)
Poor families by family type - Male, no wife present (%)
Poor families by family type - Female, no husband present (%)
Poverty status for native-born residents (%)
Poverty status for foreign-born residents (%)
Poverty among high school graduates not in families (%)
Poverty among people who did not graduate high school not in families (%)
Residents with income below the poverty level (%) - White
Residents with income below the poverty level (%) - Black or African American
Residents with income below the poverty level (%) - Asian
Residents with income below the poverty level (%) - Hispanic or Latino
Residents with income below the poverty level (%) - American Indian and Alaska Native
Residents with income below the poverty level (%) - Multirace
Residents with income below the poverty level (%) - Other Race
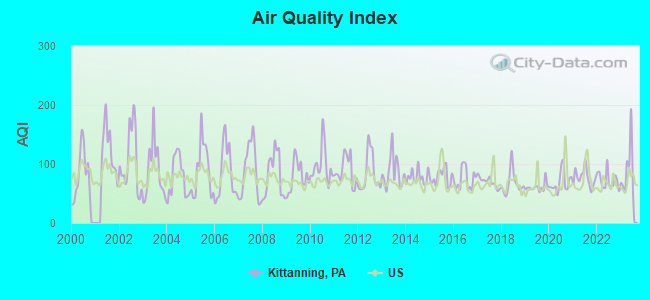
Air pollution - Air Quality Index (AQI)
Air pollution - CO
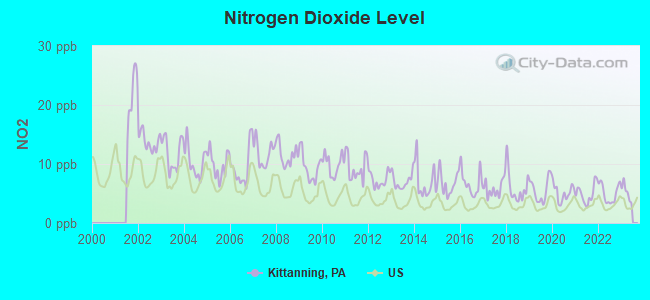
Air pollution - NO2
Air pollution - SO2
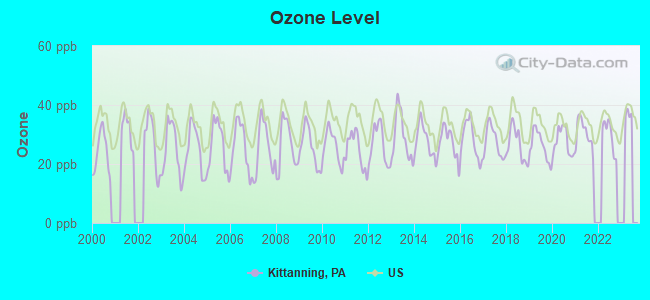
Air pollution - Ozone
Air pollution - PM10
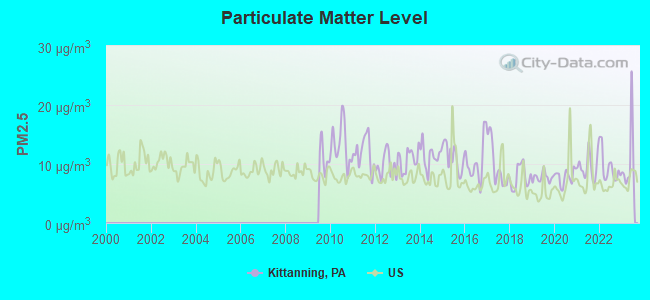
Air pollution - PM25
Air pollution - Pb
Crime - Murders per 100,000 population
Crime - Rapes per 100,000 population
Crime - Robberies per 100,000 population
Crime - Assaults per 100,000 population
Crime - Burglaries per 100,000 population
Crime - Thefts per 100,000 population
Crime - Auto thefts per 100,000 population
Crime - Arson per 100,000 population
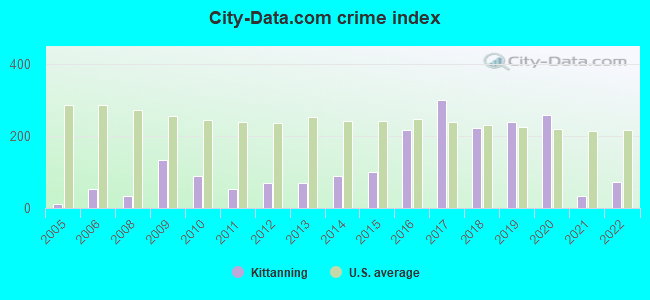
Crime - City-data.com crime index
Crime - Violent crime index
Crime - Property crime index
Crime - Murders per 100,000 population (5 year average)
Crime - Rapes per 100,000 population (5 year average)
Crime - Robberies per 100,000 population (5 year average)
Crime - Assaults per 100,000 population (5 year average)
Crime - Burglaries per 100,000 population (5 year average)
Crime - Thefts per 100,000 population (5 year average)
Crime - Auto thefts per 100,000 population (5 year average)
Crime - Arson per 100,000 population (5 year average)
Crime - City-data.com crime index (5 year average)
Crime - Violent crime index (5 year average)
Crime - Property crime index (5 year average)
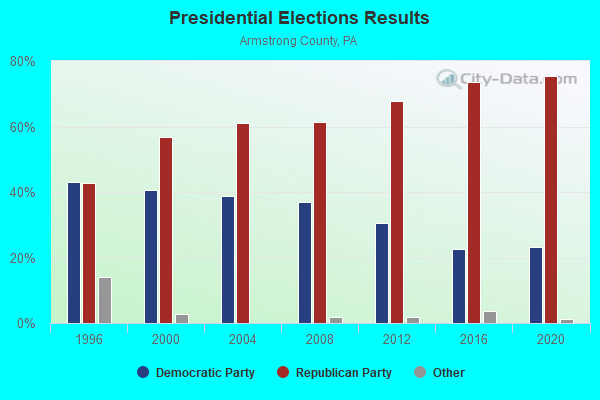
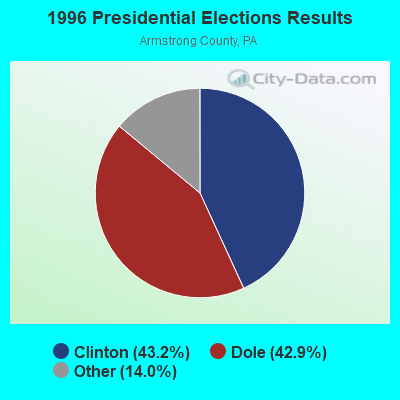
1996 Presidential Elections Results (%) - Democratic Party (Clinton)
1996 Presidential Elections Results (%) - Republican Party (Dole)
1996 Presidential Elections Results (%) - Other
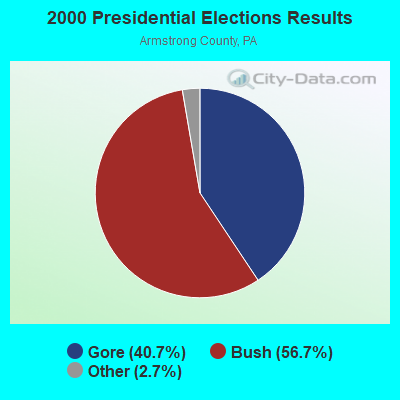
2000 Presidential Elections Results (%) - Democratic Party (Gore)
2000 Presidential Elections Results (%) - Republican Party (Bush)
2000 Presidential Elections Results (%) - Other
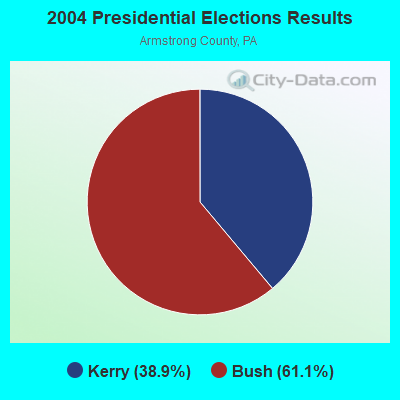
2004 Presidential Elections Results (%) - Democratic Party (Kerry)
2004 Presidential Elections Results (%) - Republican Party (Bush)
2004 Presidential Elections Results (%) - Other
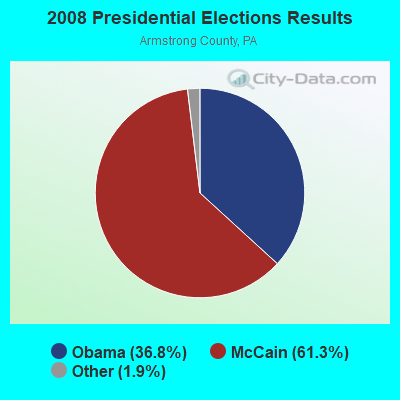
2008 Presidential Elections Results (%) - Democratic Party (Obama)
2008 Presidential Elections Results (%) - Republican Party (McCain)
2008 Presidential Elections Results (%) - Other
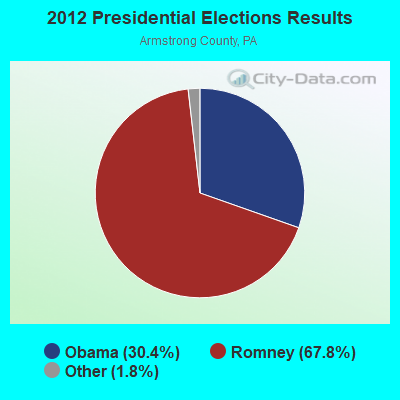
2012 Presidential Elections Results (%) - Democratic Party (Obama)
2012 Presidential Elections Results (%) - Republican Party (Romney)
2012 Presidential Elections Results (%) - Other
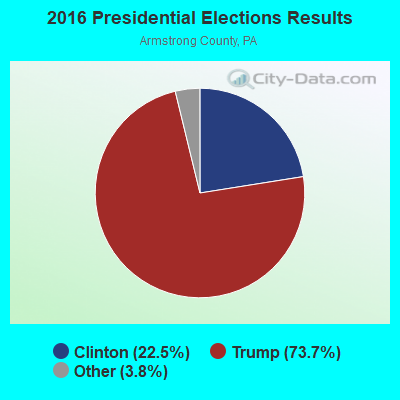
2016 Presidential Elections Results (%) - Democratic Party (Clinton)
2016 Presidential Elections Results (%) - Republican Party (Trump)
2016 Presidential Elections Results (%) - Other
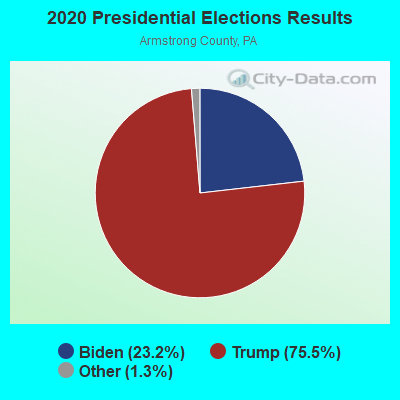
2020 Presidential Elections Results (%) - Democratic Party (Biden)
2020 Presidential Elections Results (%) - Republican Party (Trump)
2020 Presidential Elections Results (%) - Other
Ancestries Reported - Arab (%)
Ancestries Reported - Czech (%)
Ancestries Reported - Danish (%)
Ancestries Reported - Dutch (%)
Ancestries Reported - English (%)
Ancestries Reported - French (%)
Ancestries Reported - French Canadian (%)
Ancestries Reported - German (%)
Ancestries Reported - Greek (%)
Ancestries Reported - Hungarian (%)
Ancestries Reported - Irish (%)
Ancestries Reported - Italian (%)
Ancestries Reported - Lithuanian (%)
Ancestries Reported - Norwegian (%)
Ancestries Reported - Polish (%)
Ancestries Reported - Portuguese (%)
Ancestries Reported - Russian (%)
Ancestries Reported - Scotch-Irish (%)
Ancestries Reported - Scottish (%)
Ancestries Reported - Slovak (%)
Ancestries Reported - Subsaharan African (%)
Ancestries Reported - Swedish (%)
Ancestries Reported - Swiss (%)
Ancestries Reported - Ukrainian (%)
Ancestries Reported - United States (%)
Ancestries Reported - Welsh (%)
Ancestries Reported - West Indian (%)
Ancestries Reported - Other (%)
Educational Attainment - No schooling completed (%)
Educational Attainment - Less than high school (%)
Educational Attainment - High school or equivalent (%)
Educational Attainment - Less than 1 year of college (%)
Educational Attainment - 1 or more years of college (%)
Educational Attainment - Associate degree (%)
Educational Attainment - Bachelor's degree (%)
Educational Attainment - Master's degree (%)
Educational Attainment - Professional school degree (%)
Educational Attainment - Doctorate degree (%)
School Enrollment - Nursery, preschool (%)
School Enrollment - Kindergarten (%)
School Enrollment - Grade 1 to 4 (%)
School Enrollment - Grade 5 to 8 (%)
School Enrollment - Grade 9 to 12 (%)
School Enrollment - College undergrad (%)
School Enrollment - Graduate or professional (%)
School Enrollment - Not enrolled in school (%)
School enrollment - Public schools (%)
School enrollment - Private schools (%)
School enrollment - Not enrolled (%)
Median number of rooms in houses and condos
Median number of rooms in apartments
Housing units lacking complete plumbing facilities (%)
Housing units lacking complete kitchen facilities (%)
Density of houses
Urban houses (%)
Rural houses (%)
Households with people 60 years and over (%)
Households with people 65 years and over (%)
Households with people 75 years and over (%)
Households with one or more nonrelatives (%)
Households with no nonrelatives (%)
Population in households (%)
Family households (%)
Nonfamily households (%)
Population in families (%)
Family households with own children (%)
Median number of bedrooms in owner occupied houses
Mean number of bedrooms in owner occupied houses
Median number of bedrooms in renter occupied houses
Mean number of bedrooms in renter occupied houses
Median number of vehichles in owner occupied houses
Mean number of vehichles in owner occupied houses
Median number of vehichles in renter occupied houses
Mean number of vehichles in renter occupied houses
Mortgage status - with mortgage (%)
Mortgage status - with second mortgage (%)
Mortgage status - with home equity loan (%)
Mortgage status - with both second mortgage and home equity loan (%)
Mortgage status - without a mortgage (%)
Average family size
Average family size - White
Average family size - Black or African American
Average family size - Asian
Average family size - Hispanic or Latino
Average family size - American Indian and Alaska Native
Average family size - Multirace
Average family size - Other Race
Geographical mobility - Same house 1 year ago (%)
Geographical mobility - Moved within same county (%)
Geographical mobility - Moved from different county within same state (%)
Geographical mobility - Moved from different state (%)
Geographical mobility - Moved from abroad (%)
Place of birth - Born in state of residence (%)
Place of birth - Born in other state (%)
Place of birth - Native, outside of US (%)
Place of birth - Foreign born (%)
Housing units in structures - 1, detached (%)
Housing units in structures - 1, attached (%)
Housing units in structures - 2 (%)
Housing units in structures - 3 or 4 (%)
Housing units in structures - 5 to 9 (%)
Housing units in structures - 10 to 19 (%)
Housing units in structures - 20 to 49 (%)
Housing units in structures - 50 or more (%)
Housing units in structures - Mobile home (%)
Housing units in structures - Boat, RV, van, etc. (%)
House/condo owner moved in on average (years ago)
Renter moved in on average (years ago)
Year householder moved into unit - Moved in 1999 to March 2000 (%)
Year householder moved into unit - Moved in 1995 to 1998 (%)
Year householder moved into unit - Moved in 1990 to 1994 (%)
Year householder moved into unit - Moved in 1980 to 1989 (%)
Year householder moved into unit - Moved in 1970 to 1979 (%)
Year householder moved into unit - Moved in 1969 or earlier (%)
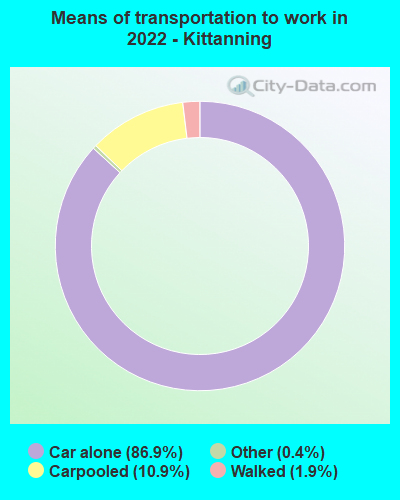
Means of transportation to work - Drove car alone (%)
Means of transportation to work - Carpooled (%)
Means of transportation to work - Public transportation (%)
Means of transportation to work - Bus or trolley bus (%)
Means of transportation to work - Streetcar or trolley car (%)
Means of transportation to work - Subway or elevated (%)
Means of transportation to work - Railroad (%)
Means of transportation to work - Ferryboat (%)
Means of transportation to work - Taxicab (%)
Means of transportation to work - Motorcycle (%)
Means of transportation to work - Bicycle (%)
Means of transportation to work - Walked (%)
Means of transportation to work - Other means (%)
Working at home (%)
Industry diversity
Most Common Industries - Agriculture, forestry, fishing and hunting, and mining (%)
Most Common Industries - Agriculture, forestry, fishing and hunting (%)
Most Common Industries - Mining, quarrying, and oil and gas extraction (%)
Most Common Industries - Construction (%)
Most Common Industries - Manufacturing (%)
Most Common Industries - Wholesale trade (%)
Most Common Industries - Retail trade (%)
Most Common Industries - Transportation and warehousing, and utilities (%)
Most Common Industries - Transportation and warehousing (%)
Most Common Industries - Utilities (%)
Most Common Industries - Information (%)
Most Common Industries - Finance and insurance, and real estate and rental and leasing (%)
Most Common Industries - Finance and insurance (%)
Most Common Industries - Real estate and rental and leasing (%)
Most Common Industries - Professional, scientific, and management, and administrative and waste management services (%)
Most Common Industries - Professional, scientific, and technical services (%)
Most Common Industries - Management of companies and enterprises (%)
Most Common Industries - Administrative and support and waste management services (%)
Most Common Industries - Educational services, and health care and social assistance (%)
Most Common Industries - Educational services (%)
Most Common Industries - Health care and social assistance (%)
Most Common Industries - Arts, entertainment, and recreation, and accommodation and food services (%)
Most Common Industries - Arts, entertainment, and recreation (%)
Most Common Industries - Accommodation and food services (%)
Most Common Industries - Other services, except public administration (%)
Most Common Industries - Public administration (%)
Occupation diversity
Most Common Occupations - Management, business, science, and arts occupations (%)
Most Common Occupations - Management, business, and financial occupations (%)
Most Common Occupations - Management occupations (%)
Most Common Occupations - Business and financial operations occupations (%)
Most Common Occupations - Computer, engineering, and science occupations (%)
Most Common Occupations - Computer and mathematical occupations (%)
Most Common Occupations - Architecture and engineering occupations (%)
Most Common Occupations - Life, physical, and social science occupations (%)
Most Common Occupations - Education, legal, community service, arts, and media occupations (%)
Most Common Occupations - Community and social service occupations (%)
Most Common Occupations - Legal occupations (%)
Most Common Occupations - Education, training, and library occupations (%)
Most Common Occupations - Arts, design, entertainment, sports, and media occupations (%)
Most Common Occupations - Healthcare practitioners and technical occupations (%)
Most Common Occupations - Health diagnosing and treating practitioners and other technical occupations (%)
Most Common Occupations - Health technologists and technicians (%)
Most Common Occupations - Service occupations (%)
Most Common Occupations - Healthcare support occupations (%)
Most Common Occupations - Protective service occupations (%)
Most Common Occupations - Fire fighting and prevention, and other protective service workers including supervisors (%)
Most Common Occupations - Law enforcement workers including supervisors (%)
Most Common Occupations - Food preparation and serving related occupations (%)
Most Common Occupations - Building and grounds cleaning and maintenance occupations (%)
Most Common Occupations - Personal care and service occupations (%)
Most Common Occupations - Sales and office occupations (%)
Most Common Occupations - Sales and related occupations (%)
Most Common Occupations - Office and administrative support occupations (%)
Most Common Occupations - Natural resources, construction, and maintenance occupations (%)
Most Common Occupations - Farming, fishing, and forestry occupations (%)
Most Common Occupations - Construction and extraction occupations (%)
Most Common Occupations - Installation, maintenance, and repair occupations (%)
Most Common Occupations - Production, transportation, and material moving occupations (%)
Most Common Occupations - Production occupations (%)
Most Common Occupations - Transportation occupations (%)
Most Common Occupations - Material moving occupations (%)
People in Group quarters - Institutionalized population (%)
People in Group quarters - Correctional institutions (%)
People in Group quarters - Federal prisons and detention centers (%)
People in Group quarters - Halfway houses (%)
People in Group quarters - Local jails and other confinement facilities (including police lockups) (%)
People in Group quarters - Military disciplinary barracks (%)
People in Group quarters - State prisons (%)
People in Group quarters - Other types of correctional institutions (%)
People in Group quarters - Nursing homes (%)
People in Group quarters - Hospitals/wards, hospices, and schools for the handicapped (%)
People in Group quarters - Hospitals/wards and hospices for chronically ill (%)
People in Group quarters - Hospices or homes for chronically ill (%)
People in Group quarters - Military hospitals or wards for chronically ill (%)
People in Group quarters - Other hospitals or wards for chronically ill (%)
People in Group quarters - Hospitals or wards for drug/alcohol abuse (%)
People in Group quarters - Mental (Psychiatric) hospitals or wards (%)
People in Group quarters - Schools, hospitals, or wards for the mentally retarded (%)
People in Group quarters - Schools, hospitals, or wards for the physically handicapped (%)
People in Group quarters - Institutions for the deaf (%)
People in Group quarters - Institutions for the blind (%)
People in Group quarters - Orthopedic wards and institutions for the physically handicapped (%)
People in Group quarters - Wards in general hospitals for patients who have no usual home elsewhere (%)
People in Group quarters - Wards in military hospitals for patients who have no usual home elsewhere (%)
People in Group quarters - Juvenile institutions (%)
People in Group quarters - Long-term care (%)
People in Group quarters - Homes for abused, dependent, and neglected children (%)
People in Group quarters - Residential treatment centers for emotionally disturbed children (%)
People in Group quarters - Training schools for juvenile delinquents (%)
People in Group quarters - Short-term care, detention or diagnostic centers for delinquent children (%)
People in Group quarters - Type of juvenile institution unknown (%)
People in Group quarters - Noninstitutionalized population (%)
People in Group quarters - College dormitories (includes college quarters off campus) (%)
People in Group quarters - Military quarters (%)
People in Group quarters - On base (%)
People in Group quarters - Barracks, unaccompanied personnel housing (UPH), (Enlisted/Officer), ;and similar group living quarters for military personnel (%)
People in Group quarters - Transient quarters for temporary residents (%)
People in Group quarters - Military ships (%)
People in Group quarters - Group homes (%)
People in Group quarters - Homes or halfway houses for drug/alcohol abuse (%)
People in Group quarters - Homes for the mentally ill (%)
People in Group quarters - Homes for the mentally retarded (%)
People in Group quarters - Homes for the physically handicapped (%)
People in Group quarters - Other group homes (%)
People in Group quarters - Religious group quarters (%)
People in Group quarters - Dormitories (%)
People in Group quarters - Agriculture workers' dormitories on farms (%)
People in Group quarters - Job Corps and vocational training facilities (%)
People in Group quarters - Other workers' dormitories (%)
People in Group quarters - Crews of maritime vessels (%)
People in Group quarters - Other nonhousehold living situations (%)
People in Group quarters - Other noninstitutional group quarters (%)
Residents speaking English at home (%)
Residents speaking English at home - Born in the United States (%)
Residents speaking English at home - Native, born elsewhere (%)
Residents speaking English at home - Foreign born (%)
Residents speaking Spanish at home (%)
Residents speaking Spanish at home - Born in the United States (%)
Residents speaking Spanish at home - Native, born elsewhere (%)
Residents speaking Spanish at home - Foreign born (%)
Residents speaking other language at home (%)
Residents speaking other language at home - Born in the United States (%)
Residents speaking other language at home - Native, born elsewhere (%)
Residents speaking other language at home - Foreign born (%)
Class of Workers - Employee of private company (%)
Class of Workers - Self-employed in own incorporated business (%)
Class of Workers - Private not-for-profit wage and salary workers (%)
Class of Workers - Local government workers (%)
Class of Workers - State government workers (%)
Class of Workers - Federal government workers (%)
Class of Workers - Self-employed workers in own not incorporated business and Unpaid family workers (%)
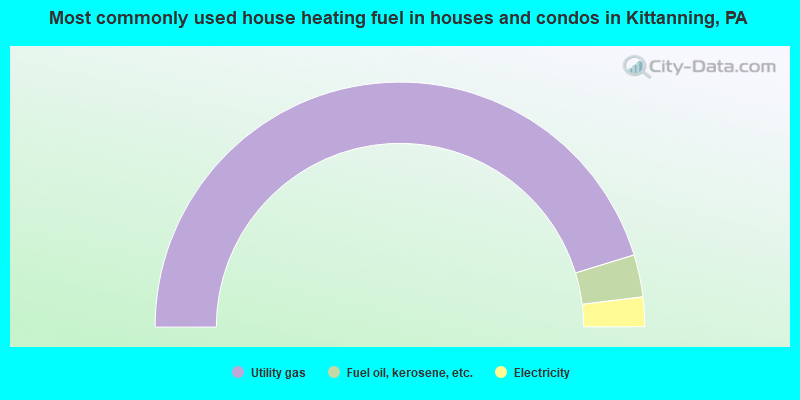
House heating fuel used in houses and condos - Utility gas (%)
House heating fuel used in houses and condos - Bottled, tank, or LP gas (%)
House heating fuel used in houses and condos - Electricity (%)
House heating fuel used in houses and condos - Fuel oil, kerosene, etc. (%)
House heating fuel used in houses and condos - Coal or coke (%)
House heating fuel used in houses and condos - Wood (%)
House heating fuel used in houses and condos - Solar energy (%)
House heating fuel used in houses and condos - Other fuel (%)
House heating fuel used in houses and condos - No fuel used (%)
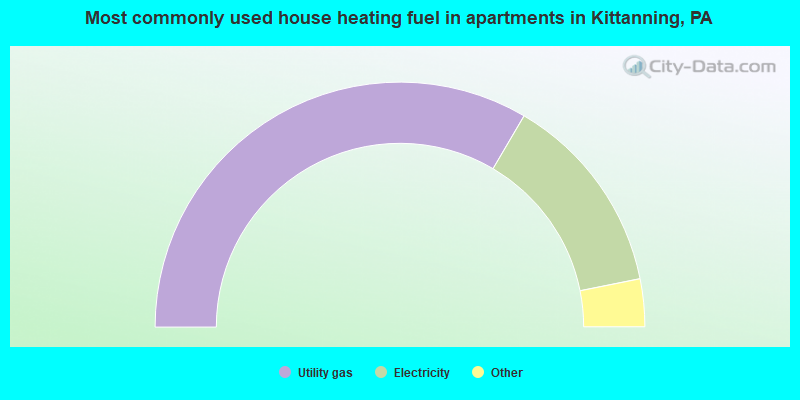
House heating fuel used in apartments - Utility gas (%)
House heating fuel used in apartments - Bottled, tank, or LP gas (%)
House heating fuel used in apartments - Electricity (%)
House heating fuel used in apartments - Fuel oil, kerosene, etc. (%)
House heating fuel used in apartments - Coal or coke (%)
House heating fuel used in apartments - Wood (%)
House heating fuel used in apartments - Solar energy (%)
House heating fuel used in apartments - Other fuel (%)
House heating fuel used in apartments - No fuel used (%)
Armed forces status - In Armed Forces (%)
Armed forces status - Civilian (%)
Armed forces status - Civilian - Veteran (%)
Armed forces status - Civilian - Nonveteran (%)
Fatal accidents locations in years 2005-2021
Fatal accidents locations in 2005
Fatal accidents locations in 2006
Fatal accidents locations in 2007
Fatal accidents locations in 2008
Fatal accidents locations in 2009
Fatal accidents locations in 2010
Fatal accidents locations in 2011
Fatal accidents locations in 2012
Fatal accidents locations in 2013
Fatal accidents locations in 2014
Fatal accidents locations in 2015
Fatal accidents locations in 2016
Fatal accidents locations in 2017
Fatal accidents locations in 2018
Fatal accidents locations in 2019
Fatal accidents locations in 2020
Fatal accidents locations in 2021
Alcohol use - People drinking some alcohol every month (%)
Alcohol use - People not drinking at all (%)
Alcohol use - Average days/month drinking alcohol
Alcohol use - Average drinks/week
Alcohol use - Average days/year people drink much
Audiometry - Average condition of hearing (%)
Audiometry - People that can hear a whisper from across a quiet room (%)
Audiometry - People that can hear normal voice from across a quiet room (%)
Audiometry - Ears ringing, roaring, buzzing (%)
Audiometry - Had a job exposure to loud noise (%)
Audiometry - Had off-work exposure to loud noise (%)
Blood Pressure & Cholesterol - Has high blood pressure (%)
Blood Pressure & Cholesterol - Checking blood pressure at home (%)
Blood Pressure & Cholesterol - Frequently checking blood cholesterol (%)
Blood Pressure & Cholesterol - Has high cholesterol level (%)
Consumer Behavior - Money monthly spent on food at supermarket/grocery store
Consumer Behavior - Money monthly spent on food at other stores
Consumer Behavior - Money monthly spent on eating out
Consumer Behavior - Money monthly spent on carryout/delivered foods
Consumer Behavior - Income spent on food at supermarket/grocery store (%)
Consumer Behavior - Income spent on food at other stores (%)
Consumer Behavior - Income spent on eating out (%)
Consumer Behavior - Income spent on carryout/delivered foods (%)
Current Health Status - General health condition (%)
Current Health Status - Blood donors (%)
Current Health Status - Has blood ever tested for HIV virus (%)
Current Health Status - Left-handed people (%)
Dermatology - People using sunscreen (%)
Diabetes - Diabetics (%)
Diabetes - Had a blood test for high blood sugar (%)
Diabetes - People taking insulin (%)
Diet Behavior & Nutrition - Diet health (%)
Diet Behavior & Nutrition - Milk product consumption (# of products/month)
Diet Behavior & Nutrition - Meals not home prepared (#/week)
Diet Behavior & Nutrition - Meals from fast food or pizza place (#/week)
Diet Behavior & Nutrition - Ready-to-eat foods (#/month)
Diet Behavior & Nutrition - Frozen meals/pizza (#/month)
Drug Use - People that ever used marijuana or hashish (%)
Drug Use - Ever used hard drugs (%)
Drug Use - Ever used any form of cocaine (%)
Drug Use - Ever used heroin (%)
Drug Use - Ever used methamphetamine (%)
Health Insurance - People covered by health insurance (%)
Kidney Conditions-Urology - Avg. # of times urinating at night
Medical Conditions - People with asthma (%)
Medical Conditions - People with anemia (%)
Medical Conditions - People with psoriasis (%)
Medical Conditions - People with overweight (%)
Medical Conditions - Elderly people having difficulties in thinking or remembering (%)
Medical Conditions - People who ever received blood transfusion (%)
Medical Conditions - People having trouble seeing even with glass/contacts (%)
Medical Conditions - People with arthritis (%)
Medical Conditions - People with gout (%)
Medical Conditions - People with congestive heart failure (%)
Medical Conditions - People with coronary heart disease (%)
Medical Conditions - People with angina pectoris (%)
Medical Conditions - People who ever had heart attack (%)
Medical Conditions - People who ever had stroke (%)
Medical Conditions - People with emphysema (%)
Medical Conditions - People with thyroid problem (%)
Medical Conditions - People with chronic bronchitis (%)
Medical Conditions - People with any liver condition (%)
Medical Conditions - People who ever had cancer or malignancy (%)
Mental Health - People who have little interest in doing things (%)
Mental Health - People feeling down, depressed, or hopeless (%)
Mental Health - People who have trouble sleeping or sleeping too much (%)
Mental Health - People feeling tired or having little energy (%)
Mental Health - People with poor appetite or overeating (%)
Mental Health - People feeling bad about themself (%)
Mental Health - People who have trouble concentrating on things (%)
Mental Health - People moving or speaking slowly or too fast (%)
Mental Health - People having thoughts they would be better off dead (%)
Oral Health - Average years since last visit a dentist
Oral Health - People embarrassed because of mouth (%)
Oral Health - People with gum disease (%)
Oral Health - General health of teeth and gums (%)
Oral Health - Average days a week using dental floss/device
Oral Health - Average days a week using mouthwash for dental problem
Oral Health - Average number of teeth
Pesticide Use - Households using pesticides to control insects (%)
Pesticide Use - Households using pesticides to kill weeds (%)
Physical Activity - People doing vigorous-intensity work activities (%)
Physical Activity - People doing moderate-intensity work activities (%)
Physical Activity - People walking or bicycling (%)
Physical Activity - People doing vigorous-intensity recreational activities (%)
Physical Activity - People doing moderate-intensity recreational activities (%)
Physical Activity - Average hours a day doing sedentary activities
Physical Activity - Average hours a day watching TV or videos
Physical Activity - Average hours a day using computer
Physical Functioning - People having limitations keeping them from working (%)
Physical Functioning - People limited in amount of work they can do (%)
Physical Functioning - People that need special equipment to walk (%)
Physical Functioning - People experiencing confusion/memory problems (%)
Physical Functioning - People requiring special healthcare equipment (%)
Prescription Medications - Average number of prescription medicines taking
Preventive Aspirin Use - Adults 40+ taking low-dose aspirin (%)
Reproductive Health - Vaginal deliveries (%)
Reproductive Health - Cesarean deliveries (%)
Reproductive Health - Deliveries resulted in a live birth (%)
Reproductive Health - Pregnancies resulted in a delivery (%)
Reproductive Health - Women breastfeeding newborns (%)
Reproductive Health - Women that had a hysterectomy (%)
Reproductive Health - Women that had both ovaries removed (%)
Reproductive Health - Women that have ever taken birth control pills (%)
Reproductive Health - Women taking birth control pills (%)
Reproductive Health - Women that have ever used Depo-Provera or injectables (%)
Reproductive Health - Women that have ever used female hormones (%)
Sexual Behavior - People 18+ that ever had sex (vaginal, anal, or oral) (%)
Sexual Behavior - Males 18+ that ever had vaginal sex with a woman (%)
Sexual Behavior - Males 18+ that ever performed oral sex on a woman (%)
Sexual Behavior - Males 18+ that ever had anal sex with a woman (%)
Sexual Behavior - Males 18+ that ever had any sex with a man (%)
Sexual Behavior - Females 18+ that ever had vaginal sex with a man (%)
Sexual Behavior - Females 18+ that ever performed oral sex on a man (%)
Sexual Behavior - Females 18+ that ever had anal sex with a man (%)
Sexual Behavior - Females 18+ that ever had any kind of sex with a woman (%)
Sexual Behavior - Average age people first had sex
Sexual Behavior - Average number of female sex partners in lifetime (males 18+)
Sexual Behavior - Average number of female vaginal sex partners in lifetime (males 18+)
Sexual Behavior - Average age people first performed oral sex on a woman (18+)
Sexual Behavior - Average number of woman performed oral sex on in lifetime (18+)
Sexual Behavior - Average number of male sex partners in lifetime (males 18+)
Sexual Behavior - Average number of male anal sex partners in lifetime (males 18+)
Sexual Behavior - Average age people first performed oral sex on a man (18+)
Sexual Behavior - Average number of male oral sex partners in lifetime (18+)
Sexual Behavior - People using protection when performing oral sex (%)
Sexual Behavior - Average number of times people have vaginal or anal sex a year
Sexual Behavior - People having sex without condom (%)
Sexual Behavior - Average number of male sex partners in lifetime (females 18+)
Sexual Behavior - Average number of male vaginal sex partners in lifetime (females 18+)
Sexual Behavior - Average number of female sex partners in lifetime (females 18+)
Sexual Behavior - Circumcised males 18+ (%)
Sleep Disorders - Average hours sleeping at night
Sleep Disorders - People that has trouble sleeping (%)
Smoking-Cigarette Use - People smoking cigarettes (%)
Taste & Smell - People 40+ having problems with smell (%)
Taste & Smell - People 40+ having problems with taste (%)
Taste & Smell - People 40+ that ever had wisdom teeth removed (%)
Taste & Smell - People 40+ that ever had tonsils teeth removed (%)
Taste & Smell - People 40+ that ever had a loss of consciousness because of a head injury (%)
Taste & Smell - People 40+ that ever had a broken nose or other serious injury to face or skull (%)
Taste & Smell - People 40+ that ever had two or more sinus infections (%)
Weight - Average height (inches)
Weight - Average weight (pounds)
Weight - Average BMI
Weight - People that are obese (%)
Weight - People that ever were obese (%)
Weight - People trying to lose weight (%)
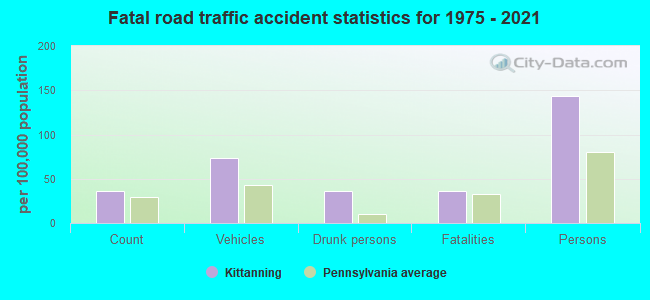
Officers per 1,000 residents here:
2.19Pennsylvania average:
2.55
Latest news from Kittanning, PA collected exclusively by city-data.com from local newspapers, TV, and radio stations
Ancestries: American (30.1%), German (28.0%), Italian (9.6%), Irish (5.8%), Jamaican (5.4%), English (4.1%).
Current Local Time:
Incorporated on 04/02/1821
Land area: 1.04 square miles.
Population density: 3,782 people per square mile (average).
59 residents are foreign born
This borough:
1.5%Pennsylvania:
7.3%
Median real estate property taxes paid for housing units with mortgages in 2022: $2,608 (1.9%)Median real estate property taxes paid for housing units with no mortgage in 2022: $1,340 (1.9%)
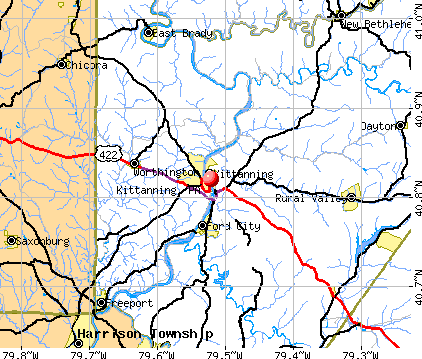
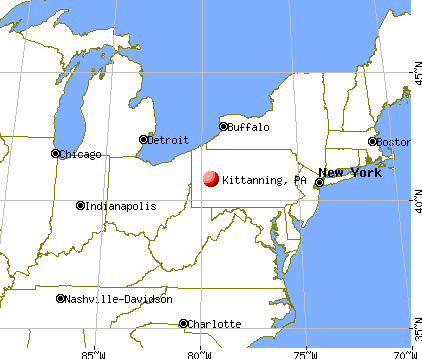
Nearest city with pop. 50,000+: Pittsburgh, PA
Nearest city with pop. 1,000,000+: Philadelphia, PA
Nearest cities:
Latitude: 40.82 N, Longitude: 79.52 W
Daytime population change due to commuting: +1,259 (+32.5%)Workers who live and work in this borough: 575 (32.5%)
Unemployment in December 2023: Here:
3.6%Pennsylvania:
2.9%
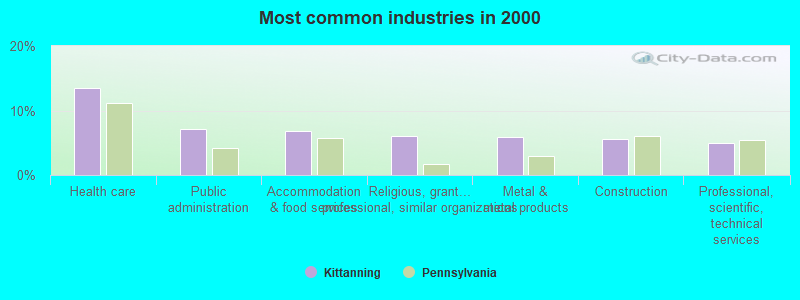
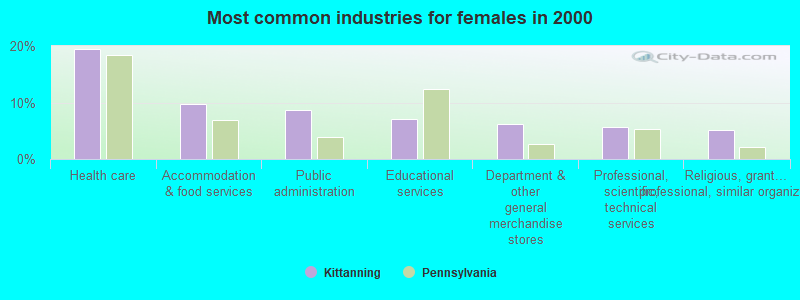
Most common industries in Kittanning, PA (%)
Both Males Females
Health care (13.5%)
Public administration (7.2%)
Accommodation & food services (6.8%)
Religious, grantmaking, civic, professional, similar organizations (6.0%)
Metal & metal products (5.9%)
Construction (5.6%)
Professional, scientific, technical services (4.9%)
Construction (11.5%)
Metal & metal products (9.8%)
Nonmetallic mineral products (7.5%)
Religious, grantmaking, civic, professional, similar organizations (7.0%)
Health care (6.5%)
Public administration (5.5%)
Professional, scientific, technical services (4.0%)
Health care (19.5%)
Accommodation & food services (9.7%)
Public administration (8.6%)
Educational services (7.1%)
Department & other general merchandise stores (6.1%)
Professional, scientific, technical services (5.7%)
Religious, grantmaking, civic, professional, similar organizations (5.2%)
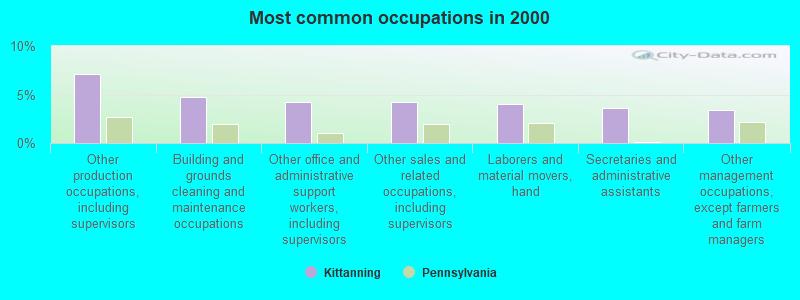
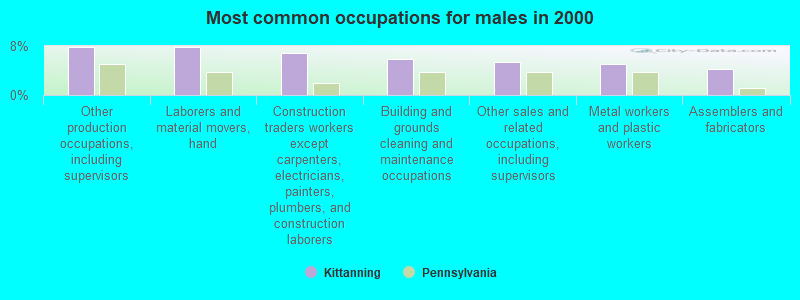
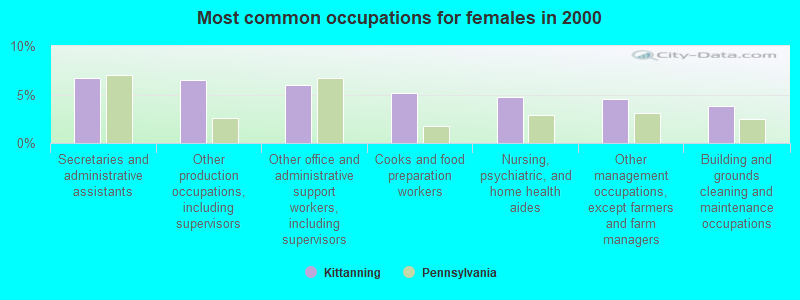
Most common occupations in Kittanning, PA (%)
Both Males Females
Other production occupations, including supervisors (7.1%)
Building and grounds cleaning and maintenance occupations (4.7%)
Other office and administrative support workers, including supervisors (4.2%)
Other sales and related occupations, including supervisors (4.2%)
Laborers and material movers, hand (4.0%)
Secretaries and administrative assistants (3.6%)
Other management occupations, except farmers and farm managers (3.4%)
Other production occupations, including supervisors (7.8%)
Laborers and material movers, hand (7.8%)
Construction traders workers except carpenters, electricians, painters, plumbers, and construction laborers (6.9%)
Building and grounds cleaning and maintenance occupations (5.8%)
Other sales and related occupations, including supervisors (5.3%)
Metal workers and plastic workers (5.1%)
Assemblers and fabricators (4.3%)
Secretaries and administrative assistants (6.7%)
Other production occupations, including supervisors (6.5%)
Other office and administrative support workers, including supervisors (6.0%)
Cooks and food preparation workers (5.1%)
Nursing, psychiatric, and home health aides (4.7%)
Other management occupations, except farmers and farm managers (4.5%)
Building and grounds cleaning and maintenance occupations (3.8%)
Tornado activity:
Kittanning-area historical tornado activity is near Pennsylvania state average. It is 16% smaller than the overall U.S. average.
On 6/3/1980, a category F4 (max. wind speeds 207-260 mph) tornado 16.1 miles away from the Kittanning borough center injured 140 people and caused between $50,000,000 and $500,000,000 in damages.
On 5/31/1985, a category F5 (max. wind speeds 261-318 mph) tornado 47.9 miles away from the borough center killed 18 people and injured 310 people and caused between $50,000,000 and $500,000,000 in damages.
Earthquake activity:
Kittanning-area historical earthquake activity is significantly above Pennsylvania state average. It is 59% smaller than the overall U.S. average. On 9/25/1998 at 19:52:52, a magnitude 5.2 (4.8 MB, 4.3 MS, 5.2 LG, 4.5 MW, Depth: 3.1 mi, Class: Moderate, Intensity: VI - VII) earthquake occurred 65.0 miles away from the city center On 8/23/2011 at 17:51:04, a magnitude 5.8 (5.8 MW, Depth: 3.7 mi) earthquake occurred 218.4 miles away from Kittanning center On 1/31/1986 at 16:46:43, a magnitude 5.0 (5.0 MB) earthquake occurred 101.0 miles away from Kittanning center On 7/27/1980 at 18:52:21, a magnitude 5.2 (5.1 MB, 4.7 MS, 5.0 UK, 5.2 UK) earthquake occurred 297.2 miles away from the city center On 12/31/2011 at 20:05:01, a magnitude 4.0 (4.0 ML, Depth: 3.1 mi, Class: Light, Intensity: IV - V) earthquake occurred 64.2 miles away from Kittanning center On 1/16/1994 at 01:49:16, a magnitude 4.6 (4.6 MB, 4.6 LG, Depth: 3.1 mi) earthquake occurred 186.2 miles away from the city center Magnitude types: regional Lg-wave magnitude (LG), body-wave magnitude (MB), local magnitude (ML), surface-wave magnitude (MS), moment magnitude (MW) Natural disasters: The number of natural disasters in Armstrong County (14) is near the US average (15).Major Disasters (Presidential) Declared: 11Emergencies Declared: 3Floods: 5, Storms: 4, Winter Storms: 3, Hurricanes: 2, Blizzard: 1, Mudslide: 1, Snowfall: 1, Snowstorm: 1, Tropical Depression: 1, Tropical Storm: 1, Other: 1 (Note: some incidents may be assigned to more than one category). Hospitals and medical centers in Kittanning: ACMH HOSPITAL (Voluntary non-profit - Private, provides emergency services, ONE NOLTE DRIVE) ARMSTRONG CO HOME (265 S MCKEAN ST)
ARMSTRONG COUNTY HEALTH CENTER (265 SOUTH MCKEAN STREET)
KITTANNING CARE CENTER (120 KITTANNING CARE DRIVE)
SNU ARMSTRONG CO MEMORIAL HOSP (ONE NOLTE DRIVE)
WESLEY MANOR HLTH CARE CNTR INC (RTE 422 EAST RD 1)
CENTRAL KITTANNING DIALYSIS CENTER, LLC (ONE NOLTE DRIVE)
ARMSTRONG CNTY MEM HOSP HH SER (ONE NOLTE DRIVE)
Colleges/Universities in Kittanning: Lenape Technical School Practical Nursing Program Full-time enrollment: 128; Location: 83 Glade Drive; Public; Website: www.lenapepnp.net)
Kittanning Beauty School Full-time enrollment: 41; Location: 120 Market St; Private, for-profit; Website: beautyacademies.net)
Colleges/universities with over 2000 students nearest to Kittanning:
Butler County Community College (about 21 miles; Butler, PA ; Full-time enrollment: 2,518)
Indiana University of Pennsylvania-Main Campus (about 24 miles; Indiana, PA ; FT enrollment: 14,471)
Clarion University of Pennsylvania (about 29 miles; Clarion, PA ; FT enrollment: 5,771)
Wyo Tech-Blairsville (about 31 miles; Blairsville, PA ; FT enrollment: 2,602)
Slippery Rock University of Pennsylvania (about 33 miles; Slippery Rock, PA ; FT enrollment: 8,424)
Carnegie Mellon University (about 35 miles; Pittsburgh, PA ; FT enrollment: 14,186)
University of Pittsburgh-Pittsburgh Campus (about 35 miles; Pittsburgh, PA ; FT enrollment: 27,137)
Public high school in Kittanning:
Private high school in Kittanning: GRACE CHRISTIAN SCHOOL Students: 58, Location: 215 ARTHUR ST, Grades: PK-10)
Public elementary/middle schools in Kittanning:
See full list of schools located in Kittanning Library in Kittanning: KITTANNING PUBLIC LIBRARY Operating income: $129,285; Location: 280 N JEFFERSON ST; 24,883 books ; 562 audio materials ; 1,468 video materials ; 41 state licensed databases ; 1 other licensed databases ; 71 print serial subscriptions )
Notable locations in Kittanning: (A) , Kittanning Fire Department Hose Company 6 (B) , Kittanning Fire Department Hose Company 1 (C) , Kittanning Fire Department Hose Company 4 (D) . Display/hide their locations on the map
Tourist attraction:
Hotels:
Court:
Birthplace of: Jack McGregor - Politician, Jason Altmire - Politician, Gus Frerotte - 2005 NFL player (Miami Dolphins, born : Jul 31, 1971), Todd Holland - Film director, Dick Starr - Baseball player, George L. Shoup - Politician, Donald C. White - Politician, Denny Harriger - Baseball player.
Armstrong County has a predicted average indoor radon screening level greater than 4 pCi/L (pico curies per liter) - Highest Potential Drinking water stations with addresses in Kittanning and their reported violations in the past:
GREENDALE TAVERN (Population served: 200, Groundwater):
Past monitoring violations:
2 regular monitoring violations
Population served: 100, Groundwater):
Past monitoring violations:
2 routine major monitoring violations
One minor monitoring violation
One regular monitoring violation
Average household size: This borough:
2.1 peoplePennsylvania:
2.5 people
Percentage of family households: This borough:
48.4%Whole state:
65.0%
Percentage of households with unmarried partners: This borough:
7.9%Whole state:
6.6%
Likely homosexual households (counted as self-reported same-sex unmarried-partner households)
Lesbian couples: 0.3% of all households Gay men: 0.1% of all households
People in group quarters in Kittanning in 2010:
92 people in nursing facilities/skilled-nursing facilities
19 people in group homes intended for adults
6 people in other noninstitutional facilities
People in group quarters in Kittanning in 2000:
127 people in nursing homes
90 people in college dormitories (includes college quarters off campus)
57 people in local jails and other confinement facilities (including police lockups)
33 people in other noninstitutional group quarters
28 people in homes for the mentally retarded
9 people in other group homes
Banks with branches in Kittanning (2011 data):
Farmers and Merchants Bank of Western Pennsylvania, National Association: Farmers And Merchants Bank Of Western Pennsylvania, National Association, Hilltop Plaza Branch, 422 East Branch, Butler Branch. Info updated 2008/04/15: Bank assets: $388.2 mil, Deposits: $347.7 mil, local headquarters , positive income , Commercial Lending Specialization, 7 total offices , Holding Company: Farmers & Merchants Bancorp Of Western Pennsylvania, Inc.
Citizens Bank of Pennsylvania: Kittanning Branch at 250 Market Street, branch established on 1952/06/30; Franklin Village Drive-In Branch at 26 Franklin Village Shopping Center, branch established on 1984/11/12. Info updated 2010/09/24: Bank assets: $32,316.9 mil, Deposits: $25,297.1 mil, headquarters in Philadelphia, PA, positive income , 396 total offices , Holding Company: Uk Financial Investments Limited
S&T Bank: Hilltop Plaza Branch at 12 Hilltop Plaza, branch established on 1992/06/28. Info updated 2012/03/14: Bank assets: $4,099.9 mil, Deposits: $3,349.5 mil, headquarters in Indiana, PA, positive income , Commercial Lending Specialization, 60 total offices , Holding Company: S & T Bancorp, Inc.
Northwest Savings Bank: Franklin Village Branch at 22 Franklin Village Mall, branch established on 1981/01/14. Info updated 2009/11/23: Bank assets: $7,975.9 mil, Deposits: $5,985.6 mil, headquarters in Warren, PA, positive income , Mortgage Lending Specialization, 172 total offices
First National Bank of Pennsylvania: Kittanning Branch at 227 Market Street, branch established on 1902/02/02. Info updated 2012/01/10: Bank assets: $9,581.0 mil, Deposits: $7,462.2 mil, headquarters in Greenville, PA, positive income , Commercial Lending Specialization, 291 total offices , Holding Company: F.N.b. Corporation
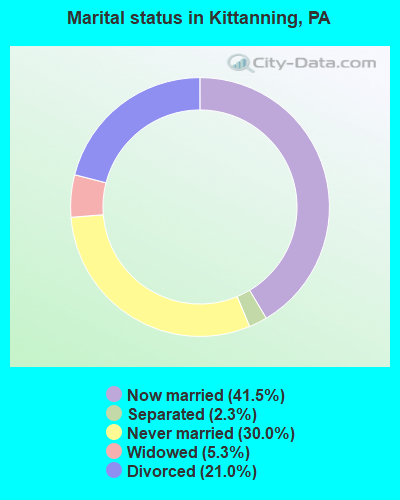
For population 15 years and over in Kittanning:
Never married: 30.0%Now married: 41.5%Separated: 2.3%Widowed: 5.3%Divorced: 21.0% For population 25 years and over in Kittanning:
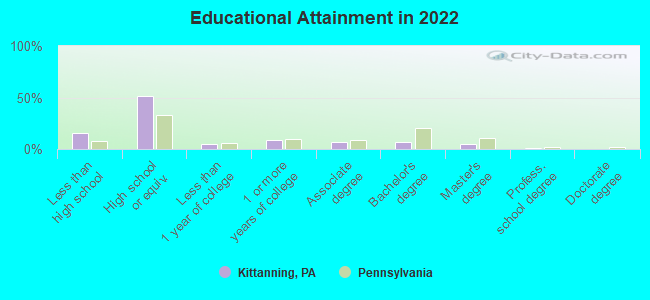
High school or higher: 85.7%Bachelor's degree or higher: 13.8%Graduate or professional degree: 5.7%Unemployed: 5.5%Mean travel time to work (commute): 24.4 minutes
Education Gini index (Inequality in education) Here:
12.2Pennsylvania average:
11.4
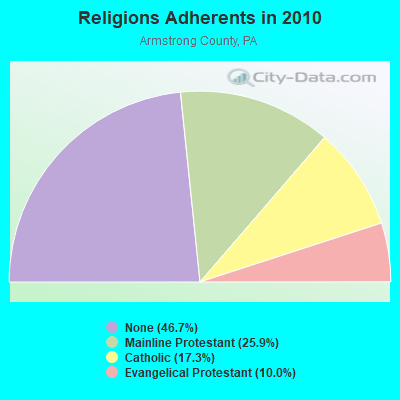
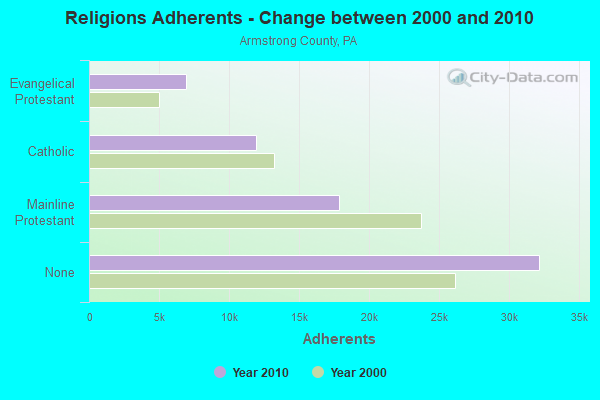
Religion statistics for Kittanning, PA (based on Armstrong County data)
Religion Adherents Congregations Mainline Protestant 17,886 78 Catholic 11,961 11 Evangelical Protestant 6,909 63 Orthodox - - Other - 2 None 32,185 -
Source: Clifford Grammich, Kirk Hadaway, Richard Houseal, Dale E.Jones, Alexei Krindatch, Richie Stanley and Richard H.Taylor. 2012. 2010 U.S.Religion Census: Religious Congregations & Membership Study. Association of Statisticians of American Religious Bodies. Jones, Dale E., et al. 2002. Congregations and Membership in the United States 2000. Nashville, TN: Glenmary Research Center. Graphs represent county-level data
Food Environment Statistics: Number of grocery stores : 18This county :
2.61 / 10,000 pop.Pennsylvania :
2.04 / 10,000 pop.
Number of convenience stores (no gas) : 5Armstrong County :
0.72 / 10,000 pop.Pennsylvania :
0.88 / 10,000 pop.
Number of convenience stores (with gas) : 22This county :
3.19 / 10,000 pop.State :
2.52 / 10,000 pop.
Number of full-service restaurants : 40Here :
5.80 / 10,000 pop.State :
7.12 / 10,000 pop.
Adult diabetes rate : This county :
10.5%State :
9.1%
Adult obesity rate : Armstrong County :
29.7%Pennsylvania :
27.2%
Low-income preschool obesity rate : Health and Nutrition: Healthy diet rate : This city:
63.8%Pennsylvania:
50.2%
Average overall health of teeth and gums : Average BMI : This city:
26.8Pennsylvania:
28.7
People feeling badly about themselves : Here:
17.8%Pennsylvania:
20.8%
People not drinking alcohol at all : This city:
9.0%Pennsylvania:
10.9%
Average hours sleeping at night : Overweight people : Kittanning:
34.8%Pennsylvania:
34.3%
General health condition : Kittanning:
68.8%Pennsylvania:
56.2%
Average condition of hearing : More about Health and Nutrition of Kittanning, PA Residents
Local government employment and payroll (March 2022)
Function
Full-time employees
Monthly full-time payroll
Average yearly full-time wage
Part-time employees
Monthly part-time payroll
Streets and Highways
5 $21,398 $51,355 2 $3,837 Police Protection - Officers
5 $37,393 $89,743 0 $0 Sewerage
3 $13,044 $52,176 0 $0 Solid Waste Management
2 $8,744 $52,464 0 $0 Local Libraries
1 $2,586 $31,032 2 $4,111 Police - Other
1 $1,659 $19,908 1 $1,901 Financial Administration
1 $6,003 $72,036 0 $0 Health
1 $2,713 $32,556 0 $0 Fire - Other
0 $0 1 $1,901 Other Government Administration
0 $0 10 $1,460
Totals for Government
19 $93,539 $59,077 16 $13,210
Kittanning government finances - Expenditure in 2017 (per resident):
Current Operations - Regular Highways: $3,424,000 ($872.80)
Police Protection: $823,000 ($209.79)Solid Waste Management: $331,000 ($84.37)Central Staff Services: $268,000 ($68.32)General - Other: $148,000 ($37.73)Libraries: $141,000 ($35.94)Parks and Recreation: $113,000 ($28.80)Local Fire Protection: $56,000 ($14.27)Protective Inspection and Regulation - Other: $37,000 ($9.43)Miscellaneous Commercial Activities - Other: $22,000 ($5.61)
Kittanning government finances - Revenue in 2017 (per resident):
Charges - Solid Waste Management: $814,000 ($207.49)
Other: $56,000 ($14.27)Parking Facilities: $26,000 ($6.63)Parks and Recreation: $7,000 ($1.78)Local Intergovernmental - Other: $17,000 ($4.33)
Miscellaneous - Fines and Forfeits: $45,000 ($11.47)
General Revenue - Other: $7,000 ($1.78)Interest Earnings: $0 ($0.00)State Intergovernmental - Other: $3,020,000 ($769.82)
Tax - Property: $990,000 ($252.36)
Individual Income: $258,000 ($65.77)Occupation and Business License - Other: $133,000 ($33.90)Documentary and Stock Transfer: $23,000 ($5.86)
Kittanning government finances - Debt in 2017 (per resident):
Long Term Debt - Issue, Unspecified Public Purpose: $1,328,000 ($338.52)
Retired Unspecified Public Purpose: $1,241,000 ($316.34)Outstanding Unspecified Public Purpose: $87,000 ($22.18)
Kittanning government finances - Cash and Securities in 2017 (per resident):
Bond Funds - Cash and Securities: $87,000 ($22.18)
Other Funds - Cash and Securities: $497,000 ($126.69)
Businesses in Kittanning, PA
Name Count Name Count
AT&T 1 McDonald's 1 Ace Hardware 1 Nike 2 Advance Auto Parts 1 Payless 1 AutoZone 1 Pizza Hut 1 Cricket Wireless 1 Quality 1 Dairy Queen 1 RadioShack 1 Famous Footwear 1 Rite Aid 2 Fashion Bug 1 Rodeway Inn 1 FedEx 3 Sears 1 Ford 1 Subway 1 GameStop 1 T-Mobile 1 H&R Block 1 Taco Bell 1 Jones New York 1 U-Haul 3 KFC 1 UPS 2 Lane Furniture 1 Walmart 1 Long John Silver's 1 Wendy's 1 MasterBrand Cabinets 2 YMCA 1
Strongest AM radio stations in Kittanning:
WTYM (1380 AM; 1 kW; KITTANNING, PA; Owner: VERNAL ENTERPRISES, INC.)
KDKA (1020 AM; 50 kW; PITTSBURGH, PA; Owner: INFINITY BROADCASTING OPERATIONS, INC.)
WAVL (910 AM; 5 kW; APOLLO, PA; Owner: EVANGEL HEIGHTS ASSEMBLY OF GOD)
WCCS (1160 AM; 10 kW; HOMER CITY, PA; Owner: RENDA RADIO, INC.)
WWVA (1170 AM; 53 kW; WHEELING, WV; Owner: CAPSTAR TX LIMITED PARTNERSHIP)
WKHB (620 AM; 6 kW; IRWIN, PA; Owner: BROADCAST COMMUNICATIONS, INC.)
WPIT (730 AM; 5 kW; PITTSBURGH, PA; Owner: PENNSYLVANIA MEDIA ASSOCIATES, INC.)
WBGG (970 AM; 5 kW; PITTSBURGH, PA; Owner: AMFM RADIO LICENSES, L.L.C.)
WECZ (1540 AM; daytime; 5 kW; PUNXSUTAWNEY, PA)
WKNR (850 AM; 50 kW; CLEVELAND, OH; Owner: CARON BROADCASTING, INC.)
WJAS (1320 AM; 6 kW; PITTSBURGH, PA; Owner: RENDA BROADCASTING CORP. OF NEVADA)
WPGR (1510 AM; 5 kW; MONROEVILLE, PA; Owner: MCL/ MCM- INC.)
WLYE (850 AM; 10 kW; JOHNSTOWN, PA; Owner: FOREVER OF JOHNSTOWN, INC.)
Strongest FM radio stations in Kittanning:
WZPT (100.7 FM; NEW KENSINGTON, PA; Owner: INFINITY RADIO SUBSIDIARY OPERATIONS INC.)
WQEJ (89.7 FM; JOHNSTOWN, PA; Owner: WQED MULTIMEDIA)
WSHH (99.7 FM; PITTSBURGH, PA; Owner: RENDA B/CING CORP. OF NEVADA)
WLTJ (92.9 FM; PITTSBURGH, PA; Owner: WPNT, INC.)
WJJJ (104.7 FM; PITTSBURGH, PA; Owner: CAPSTAR TX LIMITED PARTNERSHIP)
WDSY-FM (107.9 FM; PITTSBURGH, PA; Owner: INFINITY RADIO SUBSIDIARY OPERATIONS INC.)
WDVE (102.5 FM; PITTSBURGH, PA; Owner: CAPSTAR TX LIMITED PARTNERSHIP)
WFRJ (88.9 FM; JOHNSTOWN, PA; Owner: FAMILY STATIONS, INC.)
WKYE (95.5 FM; JOHNSTOWN, PA; Owner: FOREVER OF JOHNSTOWN, INC.)
WQKK (92.1 FM; JOHNSTOWN, PA; Owner: DAME BROADCASTING, LLC)
WWSW-FM (94.5 FM; PITTSBURGH, PA; Owner: AMFM RADIO LICENSES, L.L.C.)
WLER-FM (97.7 FM; BUTLER, PA; Owner: WBUT, INC.)
WYTR (103.3 FM; BROOKVILLE, PA; Owner: RENDA RADIO, INC.)
WQED-FM (89.3 FM; PITTSBURGH, PA; Owner: WQED MULTIMEDIA)
WQMU (92.5 FM; INDIANA, PA; Owner: RMS MEDIA MANAGEMENT, INC.)
WLCY (106.3 FM; BLAIRSVILLE, PA; Owner: LONGO MEDIA GROUP, INC.)
TV broadcast stations around Kittanning:
W25AX (Channel 25; KITTANNING, PA; Owner: TURNPIKE TELEVISION)
W60BL (Channel 60; BUTLER, PA; Owner: TURNPIKE TELEVISION)
WBOA-LP (Channel 64; KITTANNING, PA; Owner: ABACUS TELEVISION)
WLLS-LP (Channel 49; INDIANA, PA; Owner: LARRY L. SCHRECONGOST)
WCWB (Channel 22; PITTSBURGH, PA; Owner: WCWB LICENSEE, LLC)
WPXI (Channel 11; PITTSBURGH, PA; Owner: WPXI-TV HOLDINGS, INC.)
WPCB-TV (Channel 40; GREENSBURG, PA; Owner: CORNERSTONE TELEVISION, INC.)
KDKA-TV (Channel 2; PITTSBURGH, PA; Owner: CBS BROADCASTING INC.)
WBGN-LP (Channel 59; PITTSBURGH, PA; Owner: BRUNO GOODWORTH NETWORK, INC.)
WPTG-LP (Channel 69; PITTSBURGH, PA; Owner: ABACUS TELEVISION)
WTAE-TV (Channel 4; PITTSBURGH, PA; Owner: WTAE HEARST-ARGYLE TV, INC. (CA CORP.))
WQEX (Channel 16; PITTSBURGH, PA; Owner: WQED MULTIMEDIA)
W65CG (Channel 65; PITTSBURGH, PA; Owner: TRINITY BROADCASTING NETWORK)
WPGH-TV (Channel 53; PITTSBURGH, PA; Owner: WPGH LICENSEE, LLC)
Kittanning fatal accident statistics for 1975 - 2021
Kittanning fatal accident list:
Jul 4, 1982 05:99 AM, 00067, Vehicles: 2, Persons: 2, Fatalities: 1, Drunk persons involved: 1Vehicles: 2, Persons: 6, Fatalities: 1, Drunk persons involved: 1
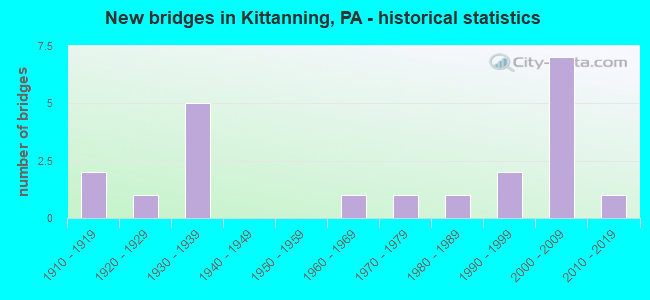
National Bridge Inventory (NBI) Statistics 21 Number of bridges341ft / 104m Total length $10,062,000 Total costs110,058 Total average daily traffic15,645 Total average daily truck traffic
New bridges - historical statistics
2 1910-1919 1 1920-1929 5 1930-1939 1 1960-1969 1 1970-1979 1 1980-1989 2 1990-1999 7 2000-2009 1 2010-2019
See full National Bridge Inventory statistics for Kittanning, PA
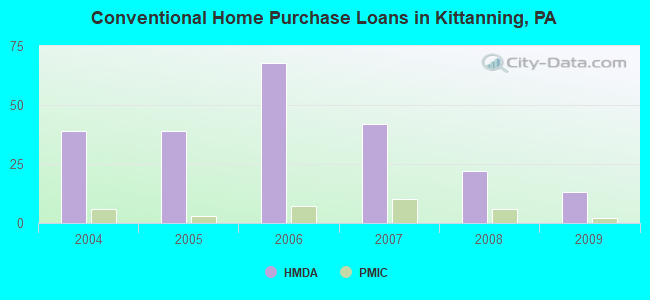
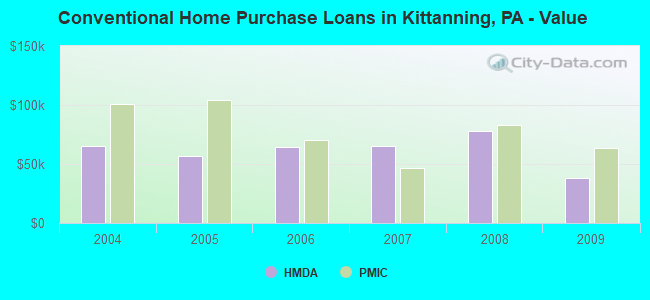
Home Mortgage Disclosure Act Aggregated Statistics For Year 2009(Based on 1 full tract) A) FHA, FSA/RHS & VA B) Conventional C) Refinancings D) Home Improvement Loans F) Non-occupant Loans on G) Loans On Manufactured Number Average Value Number Average Value Number Average Value Number Average Value Number Average Value Number Average Value
LOANS ORIGINATED 9 $60,222 13 $37,846 36 $103,056 25 $31,200 6 $124,667 2 $35,000 APPLICATIONS APPROVED, NOT ACCEPTED 1 $133,000 1 $57,000 3 $58,333 2 $25,000 0 $0 3 $82,000 APPLICATIONS DENIED 1 $97,000 5 $103,200 30 $100,733 9 $15,778 2 $135,500 3 $64,667 APPLICATIONS WITHDRAWN 1 $65,000 5 $49,600 26 $88,500 1 $13,000 0 $0 0 $0 FILES CLOSED FOR INCOMPLETENESS 0 $0 0 $0 1 $20,000 0 $0 0 $0 0 $0
Aggregated Statistics For Year 2008(Based on 1 full tract) A) FHA, FSA/RHS & VA B) Conventional C) Refinancings D) Home Improvement Loans F) Non-occupant Loans on G) Loans On Manufactured Number Average Value Number Average Value Number Average Value Number Average Value Number Average Value Number Average Value
LOANS ORIGINATED 11 $86,091 22 $78,136 36 $71,111 17 $21,471 12 $57,583 0 $0 APPLICATIONS APPROVED, NOT ACCEPTED 0 $0 2 $115,500 5 $88,600 2 $92,000 0 $0 0 $0 APPLICATIONS DENIED 3 $59,667 16 $37,250 49 $97,714 17 $24,000 5 $42,000 3 $57,667 APPLICATIONS WITHDRAWN 0 $0 2 $40,000 19 $76,895 1 $160,000 2 $40,000 0 $0 FILES CLOSED FOR INCOMPLETENESS 0 $0 1 $44,000 3 $86,667 3 $31,667 1 $67,000 0 $0
Aggregated Statistics For Year 2007(Based on 1 full tract) A) FHA, FSA/RHS & VA B) Conventional C) Refinancings D) Home Improvement Loans E) Loans on Dwellings For 5+ Families F) Non-occupant Loans on G) Loans On Manufactured Number Average Value Number Average Value Number Average Value Number Average Value Number Average Value Number Average Value Number Average Value
LOANS ORIGINATED 5 $73,000 42 $65,476 63 $72,333 38 $28,816 0 $0 10 $41,100 7 $68,571 APPLICATIONS APPROVED, NOT ACCEPTED 1 $16,000 7 $66,000 14 $54,286 7 $44,571 0 $0 0 $0 6 $63,667 APPLICATIONS DENIED 0 $0 14 $55,429 92 $79,054 29 $40,483 1 $35,000 4 $43,250 10 $58,600 APPLICATIONS WITHDRAWN 0 $0 2 $112,500 26 $99,808 2 $59,500 0 $0 0 $0 1 $74,000 FILES CLOSED FOR INCOMPLETENESS 1 $79,000 1 $50,000 2 $75,000 0 $0 0 $0 2 $60,000 0 $0
Aggregated Statistics For Year 2006(Based on 1 full tract) A) FHA, FSA/RHS & VA B) Conventional C) Refinancings D) Home Improvement Loans F) Non-occupant Loans on G) Loans On Manufactured Number Average Value Number Average Value Number Average Value Number Average Value Number Average Value Number Average Value
LOANS ORIGINATED 13 $64,538 68 $64,824 69 $49,754 36 $33,194 11 $64,545 7 $40,429 APPLICATIONS APPROVED, NOT ACCEPTED 1 $68,000 4 $38,750 28 $51,929 2 $31,500 0 $0 1 $78,000 APPLICATIONS DENIED 0 $0 19 $53,579 130 $70,800 46 $44,565 2 $31,000 7 $81,286 APPLICATIONS WITHDRAWN 2 $42,500 7 $89,143 45 $93,444 3 $22,333 1 $44,000 0 $0 FILES CLOSED FOR INCOMPLETENESS 0 $0 1 $45,000 6 $88,333 0 $0 0 $0 0 $0
Aggregated Statistics For Year 2005(Based on 1 full tract) A) FHA, FSA/RHS & VA B) Conventional C) Refinancings D) Home Improvement Loans E) Loans on Dwellings For 5+ Families F) Non-occupant Loans on G) Loans On Manufactured Number Average Value Number Average Value Number Average Value Number Average Value Number Average Value Number Average Value Number Average Value
LOANS ORIGINATED 10 $60,600 39 $56,692 64 $69,344 18 $35,722 1 $520,000 20 $56,200 0 $0 APPLICATIONS APPROVED, NOT ACCEPTED 0 $0 4 $32,750 18 $101,333 3 $12,667 0 $0 1 $65,000 2 $20,500 APPLICATIONS DENIED 2 $40,500 11 $72,000 142 $85,620 31 $20,742 0 $0 8 $36,125 8 $75,750 APPLICATIONS WITHDRAWN 0 $0 4 $50,000 73 $85,370 11 $105,273 0 $0 1 $99,000 4 $88,250 FILES CLOSED FOR INCOMPLETENESS 1 $40,000 3 $41,333 3 $82,000 0 $0 0 $0 1 $32,000 0 $0
Aggregated Statistics For Year 2004(Based on 1 full tract) A) FHA, FSA/RHS & VA B) Conventional C) Refinancings D) Home Improvement Loans F) Non-occupant Loans on G) Loans On Manufactured Number Average Value Number Average Value Number Average Value Number Average Value Number Average Value Number Average Value
LOANS ORIGINATED 10 $50,000 39 $65,051 68 $64,353 15 $16,733 17 $44,294 2 $43,000 APPLICATIONS APPROVED, NOT ACCEPTED 0 $0 4 $43,250 13 $78,308 0 $0 1 $39,000 1 $40,000 APPLICATIONS DENIED 1 $52,000 11 $54,818 89 $67,191 18 $17,667 16 $31,938 1 $48,000 APPLICATIONS WITHDRAWN 1 $69,000 2 $38,000 49 $63,245 5 $16,200 6 $34,833 0 $0 FILES CLOSED FOR INCOMPLETENESS 1 $40,000 0 $0 17 $85,706 1 $7,000 0 $0 0 $0
Detailed HMDA statistics for the following Tracts:
9811.00
Private Mortgage Insurance Companies Aggregated Statistics For Year 2009(Based on 1 full tract) A) Conventional B) Refinancings Number Average Value Number Average Value
LOANS ORIGINATED 2 $63,500 0 $0 APPLICATIONS APPROVED, NOT ACCEPTED 1 $162,000 1 $144,000 APPLICATIONS DENIED 0 $0 0 $0 APPLICATIONS WITHDRAWN 0 $0 0 $0 FILES CLOSED FOR INCOMPLETENESS 0 $0 0 $0
Aggregated Statistics For Year 2008(Based on 1 full tract) A) Conventional B) Refinancings C) Non-occupant Loans on Number Average Value Number Average Value Number Average Value
LOANS ORIGINATED 6 $83,000 2 $62,500 1 $61,000 APPLICATIONS APPROVED, NOT ACCEPTED 0 $0 1 $67,000 1 $67,000 APPLICATIONS DENIED 0 $0 0 $0 0 $0 APPLICATIONS WITHDRAWN 0 $0 0 $0 0 $0 FILES CLOSED FOR INCOMPLETENESS 0 $0 0 $0 0 $0
Aggregated Statistics For Year 2007(Based on 1 full tract) A) Conventional B) Refinancings C) Non-occupant Loans on Number Average Value Number Average Value Number Average Value
LOANS ORIGINATED 10 $46,900 4 $101,750 0 $0 APPLICATIONS APPROVED, NOT ACCEPTED 1 $50,000 0 $0 1 $50,000 APPLICATIONS DENIED 0 $0 0 $0 0 $0 APPLICATIONS WITHDRAWN 0 $0 0 $0 0 $0 FILES CLOSED FOR INCOMPLETENESS 0 $0 0 $0 0 $0
Aggregated Statistics For Year 2006(Based on 1 full tract) A) Conventional B) Refinancings C) Non-occupant Loans on Number Average Value Number Average Value Number Average Value
LOANS ORIGINATED 7 $70,714 1 $52,000 1 $41,000 APPLICATIONS APPROVED, NOT ACCEPTED 1 $27,000 0 $0 0 $0 APPLICATIONS DENIED 0 $0 0 $0 0 $0 APPLICATIONS WITHDRAWN 1 $45,000 0 $0 0 $0 FILES CLOSED FOR INCOMPLETENESS 0 $0 0 $0 0 $0
Aggregated Statistics For Year 2005(Based on 1 full tract) A) Conventional B) Refinancings C) Non-occupant Loans on Number Average Value Number Average Value Number Average Value
LOANS ORIGINATED 3 $104,000 2 $70,000 1 $51,000 APPLICATIONS APPROVED, NOT ACCEPTED 0 $0 0 $0 0 $0 APPLICATIONS DENIED 0 $0 0 $0 0 $0 APPLICATIONS WITHDRAWN 1 $36,000 1 $95,000 1 $36,000 FILES CLOSED FOR INCOMPLETENESS 0 $0 1 $40,000 0 $0
Aggregated Statistics For Year 2004(Based on 1 full tract) A) Conventional B) Refinancings C) Non-occupant Loans on Number Average Value Number Average Value Number Average Value
LOANS ORIGINATED 6 $100,500 2 $64,500 3 $53,333 APPLICATIONS APPROVED, NOT ACCEPTED 0 $0 0 $0 0 $0 APPLICATIONS DENIED 0 $0 0 $0 0 $0 APPLICATIONS WITHDRAWN 0 $0 0 $0 0 $0 FILES CLOSED FOR INCOMPLETENESS 0 $0 0 $0 0 $0
Detailed PMIC statistics for the following Tracts:
9811.00
Fire-safe hotels and motels in Kittanning, Pennsylvania:
Rodeway Inn-kittanning, Friendship Plaza RD#6, Kittanning, Pennsylvania 16201 Phone: (724) 543-1100
Holiday Inn Express & Suites, 13 Hilltop Plz, Kittanning, Pennsylvania 16201 Phone: (724) 543-5200, Fax: (724) 543-5455
All 2 fire-safe hotels and motels in Kittanning, Pennsylvania
Most common first names in Kittanning, PA among deceased individuals Name Count Lived (average)
Mary 291 81.2 years William 265 74.4 years John 222 74.6 years James 202 73.4 years Robert 165 73.1 years Charles 155 75.7 years Margaret 140 82.2 years Harry 120 76.5 years Helen 114 80.5 years Anna 114 83.2 years
Most common last names in Kittanning, PA among deceased individuals Last name Count Lived (average)
Bowser 167 78.0 years Smith 117 77.8 years Toy 56 74.5 years Miller 51 75.6 years Claypool 45 83.3 years Wolfe 44 75.9 years Mechling 43 78.8 years Schrecengost 43 79.2 years Cogley 40 79.9 years Cousins 40 71.0 years
Kittanning compared to Pennsylvania state average:
Median household income below state average. Median house value significantly below state average. Unemployed percentage below state average. Black race population percentage significantly below state average. Hispanic race population percentage significantly below state average. Foreign-born population percentage significantly below state average. Renting percentage above state average. Length of stay since moving in significantly above state average. Number of college students significantly below state average. Percentage of population with a bachelor's degree or higher below state average.
Top Patent Applicants
Bernard F. Hete (16)
Robert M. Hunia (10)
Richard W. Kerrigan (5)
Richard W. Kephart (5)
David Berry (4)
David H. Berry (3)
Bernie F. Hete (2)
Robert Hunia (2)
Maureen A. Secilia (2)
Scott D. Quinnell (2)
Total of 62 patent applications in 2008-2024.


 Recent articles from our blog. Our writers, many of them Ph.D. graduates or candidates, create easy-to-read articles on a wide variety of topics.

 (35.5 miles
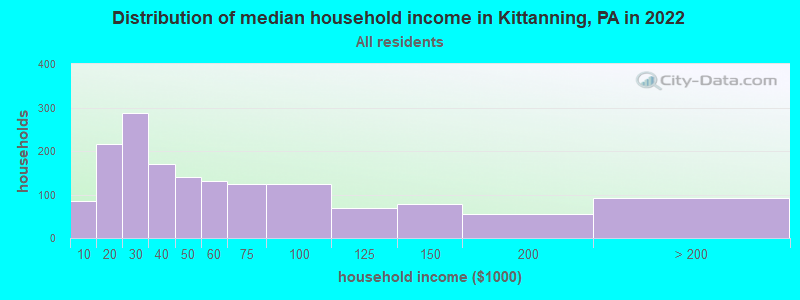


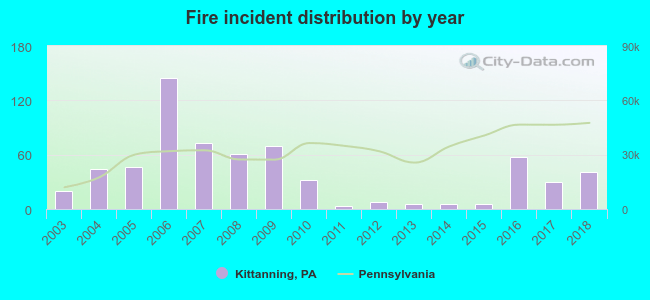 Based on the data from the years 2003 - 2018 the average number of fire incidents per year is 40. The highest number of fire incidents - 145 took place in 2006, and the least - 3 in 2011. The data has a rising trend.
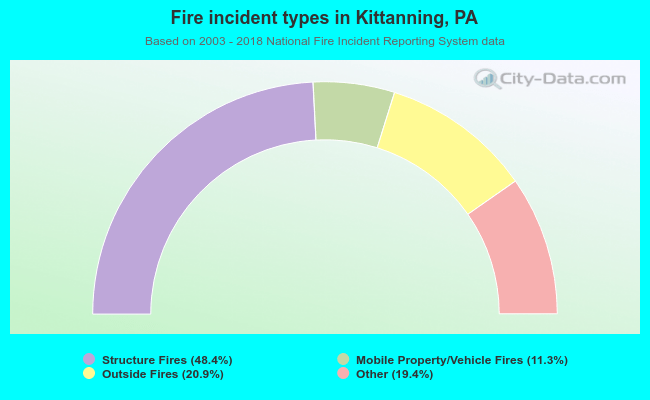 When looking into fire subcategories, the most reports belonged to: Structure Fires (48.4%), and Outside Fires (20.9%).