Estimated zip code population in 2022: 3,071 Zip code population in 2010: 2,526 Zip code population in 2000: 2,302
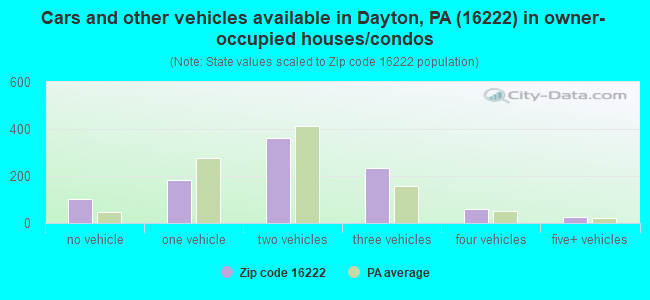
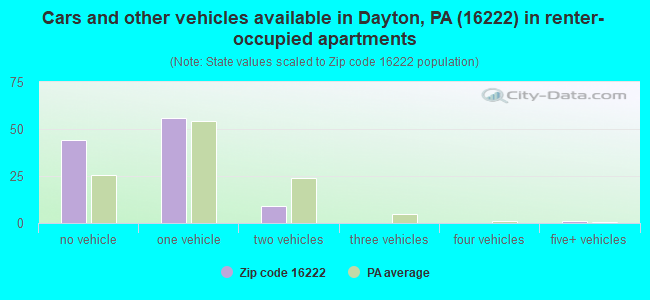
Houses and condos: 1,256 Renter-occupied apartments: 110
% of renters here:
10%
State:
31%
March 2022 cost of living index in zip code 16222: 90.3 (less than average, U.S. average is 100)
Land area: 65.8 sq. mi. Water area: 0.6 sq. mi.
Population density: 47 people per square mile
(very low).
OSM Map
General Map
Google Map
MSN Map
OSM Map
General Map
Google Map
MSN Map
OSM Map
General Map
Google Map
MSN Map
OSM Map
General Map
Google Map
MSN Map
Please wait while loading the map...
Real estate property taxes paid for housing units in 2022:
This zip code:
1.5% ($2,130)
Pennsylvania:
1.3% ($3,094)
Median real estate property taxes paid for housing units with mortgages in 2022: $2,394 (1.2%) Median real estate property taxes paid for housing units with no mortgage in 2022: $1,932 (1.8%)
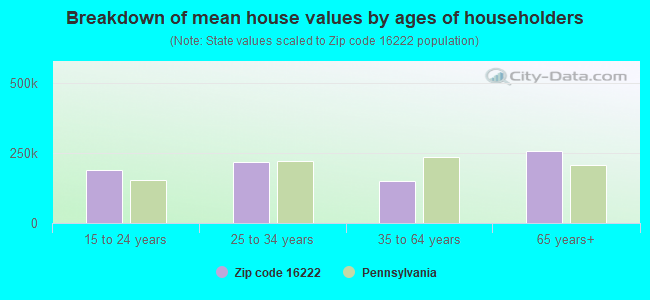
Estimated median house/condo value in 2022: $140,549
16222:
$140,549
Pennsylvania:
$245,500
According to our research of Pennsylvania and other state lists, there were 3 registered sex offenders living in 16222 zip code as of May 23, 2024. The ratio of all residents to sex offenders in zip code 16222 is 862 to 1. The ratio of registered sex offenders to all residents in this zip code is lower than the state average.
Median resident age:
This zip code:
37.5 years
Pennsylvania median age:
40.9 years
Average household size:
This zip code:
2.8 people
Pennsylvania:
2.4 people
Averages for the 2020 tax year for zip code 16222, filed in 2021:
Average Adjusted Gross Income (AGI) in 2020: $52,950 (Individual Income Tax Returns)
Here:
$52,950
State:
$75,707
Salary/wage: $49,603 (reported on 71.7% of returns)
Here:
$49,603
State:
$62,806
(% of AGI for various income ranges: 1003.9% for AGIs below $25k, 3592.9% for AGIs $25k-50k, 6443.3% for AGIs $50k-75k, 8720.0% for AGIs $75k-100k, 17753.8% for AGIs $100k-200k)
Taxable interest for individuals: $757 (reported on 34.9% of returns)
This zip code:
$757
Pennsylvania:
$1,633
(% of AGI for various income ranges: 42.2% for AGIs below $25k, 24.7% for AGIs $25k-50k, 44.2% for AGIs $50k-75k, 30.0% for AGIs $75k-100k, 102.5% for AGIs $100k-200k)
Ordinary dividends: $1,726 (reported on 17.9% of returns)
Here:
$1,726
State:
$7,382
(% of AGI for various income ranges: 25.6% for AGIs below $25k, 20.0% for AGIs $25k-50k, 57.5% for AGIs $50k-75k, 53.3% for AGIs $75k-100k, 163.8% for AGIs $100k-200k)
Net capital gain/loss in AGI: +$6,915 (reported on 12.3% of returns)
Here:
+$6,915
State:
+$23,522
(% of AGI for various income ranges: 52.2% for AGIs below $25k, 183.3% for AGIs $50k-75k, 731.2% for AGIs $100k-200k)
Profit/loss from business: +$19,683 (reported on 21.7% of returns)
Here:
+$19,683
State:
+$16,274
(% of AGI for various income ranges: 401.1% for AGIs below $25k, 979.4% for AGIs $25k-50k, 933.3% for AGIs $50k-75k, 1275.0% for AGIs $100k-200k)
Taxable individual retirement arrangement distribution: $10,536 (reported on 10.4% of returns)
16222:
$10,536
Pennsylvania:
$18,583
(% of AGI for various income ranges: 110.0% for AGIs below $25k, 145.9% for AGIs $25k-50k, 329.2% for AGIs $50k-75k, 353.3% for AGIs $75k-100k)
Total itemized deductions: $27,150 (reported on 1.9% of returns)
Here:
$27,150
State:
$34,850
(% of AGI for various income ranges: 319.4% for AGIs $25k-50k)
Taxes paid: $7,450 (reported on 1.9% of returns)
16222:
$7,450
State:
$8,200
(% of AGI for various income ranges: 87.6% for AGIs $25k-50k)
Earned income credit: $1,945 (reported on 10.4% of returns)
Here:
$1,945
State:
$2,100
(% of AGI for various income ranges: 61.1% for AGIs below $25k, 61.2% for AGIs $25k-50k)
Percentage of individuals using paid preparers for their 2020 taxes: 92.5%
Here:
92%
State:
92%
(% for various income ranges: 88.6% for AGIs below $25k, 92.6% for AGIs $25k-50k, 94.7% for AGIs $50k-75k, 91.7% for AGIs $75k-100k, 100.0% for AGIs $100k-200k)
Averages for the 2012 tax year for zip code 16222, filed in 2013:
Average Adjusted Gross Income (AGI) in 2012: $44,675 (Individual Income Tax Returns)
Here:
$44,675
State:
$61,346
Salary/wage: $40,873 (reported on 73.8% of returns)
Here:
$40,873
State:
$51,902
(% of AGI for various income ranges: 51.5% for AGIs below $25k, 69.1% for AGIs $25k-50k, 80.3% for AGIs $50k-75k, 81.3% for AGIs $75k-100k, 51.9% for AGIs $100k-200k)
Taxable interest for individuals: $700 (reported on 37.4% of returns)
This zip code:
$700
Pennsylvania:
$1,588
(% of AGI for various income ranges: 2.0% for AGIs below $25k, 0.3% for AGIs $25k-50k, 0.3% for AGIs $50k-75k, 0.3% for AGIs $75k-100k, 0.6% for AGIs $100k-200k)
Ordinary dividends: $1,360 (reported on 18.7% of returns)
Here:
$1,360
State:
$5,827
(% of AGI for various income ranges: 1.0% for AGIs below $25k, 0.6% for AGIs $25k-50k, 0.6% for AGIs $50k-75k, 0.2% for AGIs $75k-100k, 0.6% for AGIs $100k-200k)
Net capital gain/loss in AGI: +$6,190 (reported on 9.3% of returns)
Here:
+$6,190
State:
+$14,495
(% of AGI for various income ranges: 0.9% for AGIs below $25k, 0.6% for AGIs $25k-50k, 6.2% for AGIs $75k-100k)
Profit/loss from business: +$13,246 (reported on 22.4% of returns)
Here:
+$13,246
State:
+$16,268
(% of AGI for various income ranges: 20.1% for AGIs below $25k, 10.3% for AGIs $25k-50k, 2.8% for AGIs $50k-75k, 9.1% for AGIs $75k-100k)
Taxable individual retirement arrangement distribution: $8,473 (reported on 10.3% of returns)
16222:
$8,473
Pennsylvania:
$14,550
(% of AGI for various income ranges: 3.9% for AGIs below $25k, 2.7% for AGIs $25k-50k, 1.4% for AGIs $50k-75k, 3.5% for AGIs $75k-100k)
Total itemized deductions: $18,335 (19% of AGI, reported on 15.9% of returns)
Here:
$18,335
State:
$23,538
Here:
19.0% of AGI
State:
18.4% of AGI
(% of AGI for various income ranges: 6.1% for AGIs $25k-50k, 6.6% for AGIs $50k-75k, 6.6% for AGIs $75k-100k, 9.7% for AGIs $100k-200k)
Charity contributions: $3,231 (reported on 12.1% of returns)
Here:
$3,231
State:
$4,025
(% of AGI for various income ranges: 1.1% for AGIs below $25k, 0.8% for AGIs $50k-75k, 1.1% for AGIs $75k-100k, 1.4% for AGIs $100k-200k)
Taxes paid: $6,665 (reported on 15.9% of returns)
16222:
$6,665
State:
$9,982
(% of AGI for various income ranges: 1.4% for AGIs $25k-50k, 1.9% for AGIs $50k-75k, 2.2% for AGIs $75k-100k, 4.7% for AGIs $100k-200k)
Earned income credit: $1,893 (reported on 13.1% of returns)
Here:
$1,893
State:
$2,106
(% of AGI for various income ranges: 3.9% for AGIs below $25k, 0.6% for AGIs $25k-50k)
Percentage of individuals using paid preparers for their 2012 taxes: 72.9%
Here:
73%
State:
53%
(% for various income ranges: 69.8% for AGIs below $25k, 74.1% for AGIs $25k-50k, 75.0% for AGIs $50k-75k, 77.8% for AGIs $75k-100k, 75.0% for AGIs $100k-200k)
Averages for the 2004 tax year for zip code 16222, filed in 2005:
Average Adjusted Gross Income (AGI) in 2004: $33,502 (Individual Income Tax Returns)
Here:
$33,502
State:
$48,049
Salary/wage: $31,086 (reported on 76.6% of returns)
Here:
$31,086
State:
$42,646
(% of AGI for various income ranges: 117.0% for AGIs below $10k, 60.2% for AGIs $10k-25k, 75.7% for AGIs $25k-50k, 81.8% for AGIs $50k-75k, 82.3% for AGIs $75k-100k, 43.3% for AGIs over 100k)
Taxable interest for individuals: $1,184 (reported on 46.2% of returns)
This zip code:
$1,184
Pennsylvania:
$1,657
(% of AGI for various income ranges: 13.1% for AGIs below $10k, 3.3% for AGIs $10k-25k, 1.7% for AGIs $25k-50k, 0.8% for AGIs $50k-75k, 0.7% for AGIs $75k-100k, 0.9% for AGIs over 100k)
Taxable dividends: $1,291 (reported on 22.6% of returns)
Here:
$1,291
State:
$3,566
(% of AGI for various income ranges: 3.7% for AGIs below $10k, 1.1% for AGIs $10k-25k, 1.0% for AGIs $25k-50k, 0.9% for AGIs $50k-75k, 0.5% for AGIs $75k-100k, 0.5% for AGIs over 100k)
Net capital gain/loss: +$3,335 (reported on 15.3% of returns)
Here:
+$3,335
State:
+$9,716
(% of AGI for various income ranges: -3.2% for AGIs below $10k, 0.9% for AGIs $10k-25k, 1.8% for AGIs $25k-50k, 0.5% for AGIs $50k-75k, 0.6% for AGIs $75k-100k, 4.1% for AGIs over 100k)
Profit/loss from business: +$12,216 (reported on 22.4% of returns)
Here:
+$12,216
State:
+$14,267
(% of AGI for various income ranges: 23.7% for AGIs below $10k, 11.5% for AGIs $10k-25k, 6.9% for AGIs $25k-50k, 3.0% for AGIs $50k-75k, 19.2% for AGIs over 100k)
IRA payment deduction: $2,448 (reported on 2.8% of returns)
16222:
$2,448
Pennsylvania:
$2,903
Total itemized deductions: $14,198 (20% of AGI, reported on 15.7% of returns)
Here:
$14,198
State:
$18,804
Here:
19.7% of AGI
State:
19.5% of AGI
(% of AGI for various income ranges: 4.6% for AGIs $10k-25k, 5.7% for AGIs $25k-50k, 8.4% for AGIs $50k-75k, 7.7% for AGIs $75k-100k, 7.6% for AGIs over 100k)
Charity contributions deductions: $2,573 (3% of AGI, reported on 12.7% of returns)
Here:
$2,573
State:
$3,337
Here:
3.4% of AGI
State:
3.3% of AGI
(% of AGI for various income ranges: 0.7% for AGIs $10k-25k, 0.6% for AGIs $25k-50k, 1.0% for AGIs $50k-75k, 1.4% for AGIs $75k-100k, 1.7% for AGIs over 100k)
Total tax: $4,185 (reported on 71.6% of returns)
16222:
$4,185
State:
$8,008
(% of AGI for various income ranges: 4.8% for AGIs below $10k, 3.6% for AGIs $10k-25k, 6.3% for AGIs $25k-50k, 7.4% for AGIs $50k-75k, 10.7% for AGIs $75k-100k, 19.1% for AGIs over 100k)
Earned income credit: $1,684 (reported on 13.2% of returns)
Here:
$1,684
State:
$1,643
Percentage of individuals using paid preparers for their 2004 taxes: 74.7%
Here:
75%
State:
56%
(% for various income ranges: 72.0% for AGIs below $10k, 77.9% for AGIs $10k-25k, 75.1% for AGIs $25k-50k, 72.8% for AGIs $50k-75k, 66.0% for AGIs $75k-100k, 83.9% for AGIs over 100k)
Household received Food Stamps/SNAP in the past 12 months: 128 Household did not receive Food Stamps/SNAP in the past 12 months: 955
Women who had a birth in the past 12 months: 54 (38 now married, 15 unmarried) Women who did not have a birth in the past 12 months: 457 (307 now married, 146 unmarried)
Housing units in zip code 16222 with a mortgage: 455 (69 second mortgage, 69 both second mortgage and home equity loan) Houses without a mortgage: 17
Median monthly owner costs for units with a mortgage: $1,196 Median monthly owner costs for units without a mortgage: $406
Residents with income below the poverty level in 2022:
This zip code:
10.2%
Whole state:
11.8%
Residents with income below 50% of the poverty level in 2022:
This zip code:
9.3%
Whole state:
6.1%
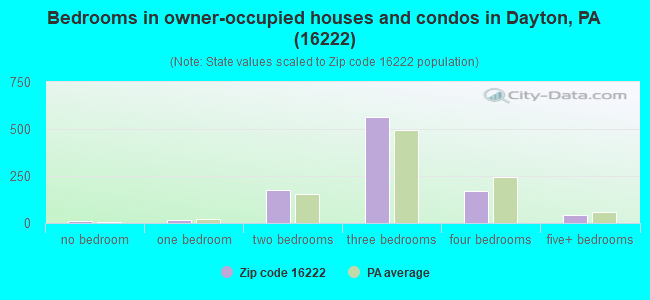
Median number of rooms in houses and condos:
Here:
6.8
State:
6.8
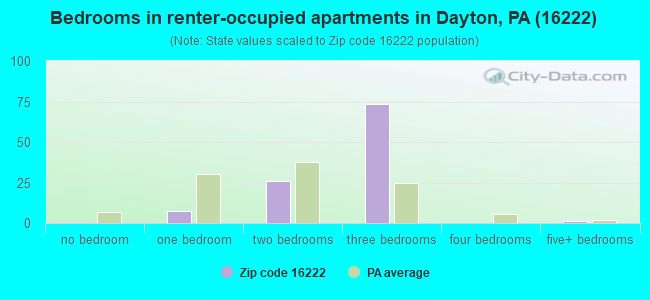
Median number of rooms in apartments:
Here:
5.1
State:
4.3
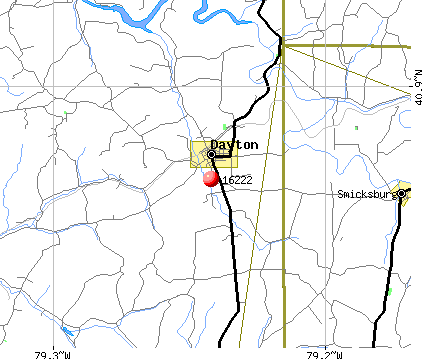
Notable locations in this zip code not listed on our city pages
Churches in zip code 16222 include: Holiness Church (A), Glade Run Church (B), Concord Church (C), Saint Michaels Church (D). Display/hide their locations on the map
Cemeteries: Dunkard Cemetery (1), Sacred Heart Cemetery (2), Saints Peter and Paul Cemetery (3), Saint Johns Cemetery (4). Display/hide their locations on the map
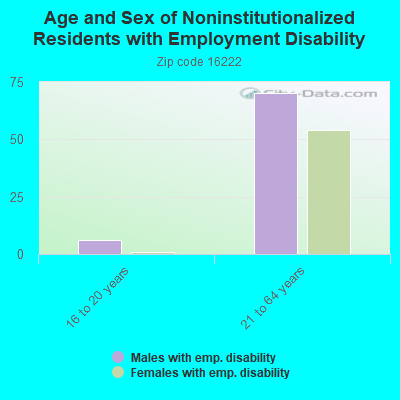
In group quarters: 1 (-1 institutionalized population)
Size of family households: 347 2-persons, 184 3-persons, 150 4-persons, 33 5-persons, 36 6-persons, 60 7-or-more-persons
Size of nonfamily households: 216 1-person, 49 2-persons, 1 4-persons
803 married couples with children.
23 single-parent households (23 women).
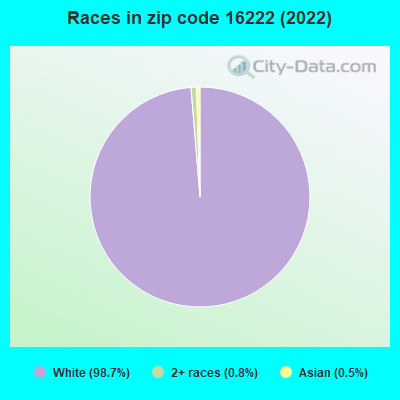
82.8% of residents of 16222 zip code speak English at home.
0.3% of residents speak Spanish at home (100% very well).
16.3% of residents speak other Indo-European language at home (38% very well, 36% well, 18% not well, 8% not at all).
0.7% of residents speak Asian or Pacific Island language at home (100% well).
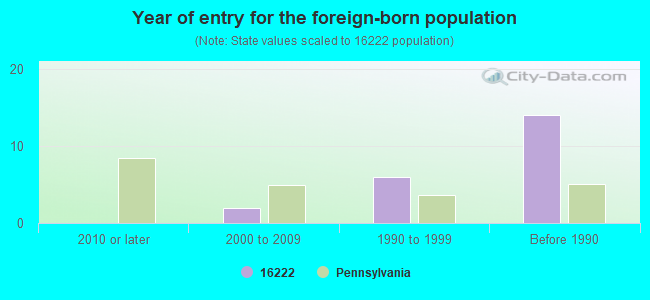
Foreign born population: 22 (0.7%) (100.0% of them are naturalized citizens)
This zip code:
0.7%
Whole state:
7.5%
76%Thailand
14%Serbia
5%Norway
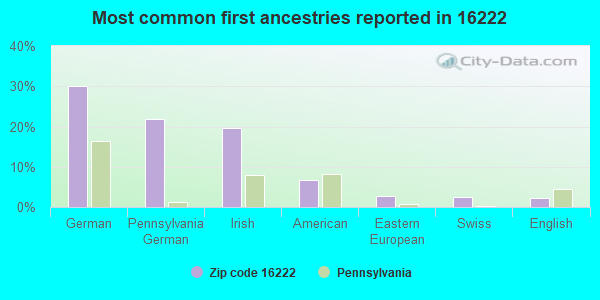
30%German
22%Pennsylvania German
20%Irish
7%American
3%Eastern European
2%Swiss
2%English
Year of entry for the foreign-born population
02010 or later
22000 to 2009
61990 to 1999
14Before 1990
Housing units lacking complete plumbing facilities: 11.1% Housing units lacking complete kitchen facilities: 14.2%
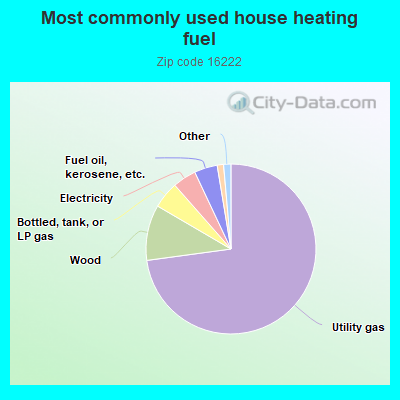
73.0%Utility gas
10.6%Wood
5.1%Bottled, tank, or LP gas
4.5%Electricity
4.4%Fuel oil, kerosene, etc.
1.2%Other fuel
0.8%Coal or coke
0.6%No fuel used
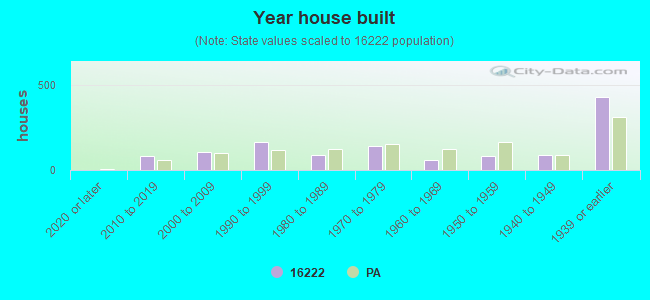
Population in 1990: 1,974. Population change in the 1990s: +328 (+16.6%).
Place of birth for U.S.-born residents:
This state: 2,880
Northeast: 36
Midwest: 41
South: 44
West: 13
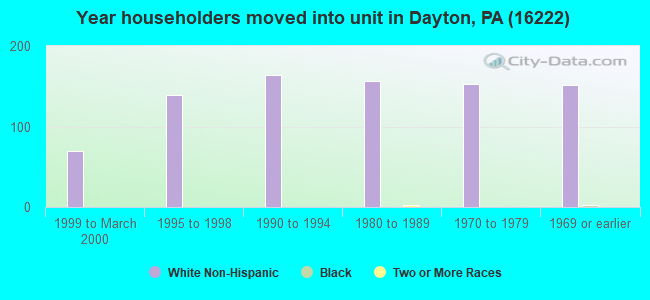
76% of the 16222 zip code residents lived in the same house 5 years ago. Out of people who lived in different houses, 49% lived in this county. Out of people who lived in different counties, 50% lived in Pennsylvania.
97% of the 16222 zip code residents lived in the same house 1 year ago. Out of people who lived in different houses, 43% moved from this county. Out of people who lived in different houses, 45% moved from different county within same state. Out of people who lived in different houses, 17% moved from different state. Out of people who lived in different houses, 4% moved from abroad.
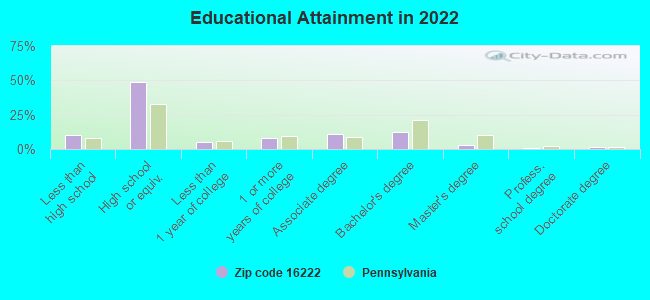
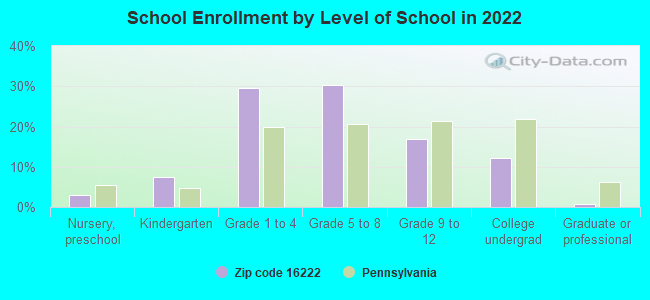
Private vs. public school enrollment:
Students in private schools in grades 1 to 8 (elementary and middle school): 101
Here:
28.6%
Pennsylvania:
15.7%
Students in private schools in grades 9 to 12 (high school): 10
Here:
10.4%
Pennsylvania:
13.4%
Students in private undergraduate colleges:
Here:
0.0%
Pennsylvania:
39.8%
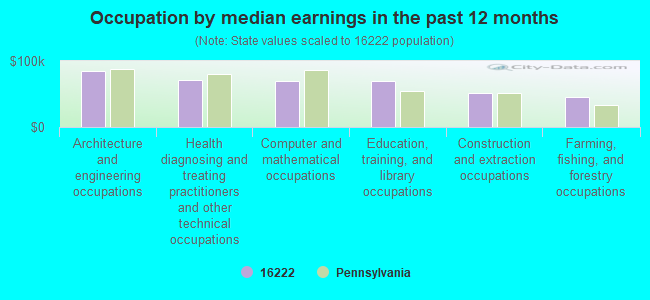
Occupation by median earnings in the past 12 months ($)
85,320Architecture and engineering occupations
71,491Health diagnosing and treating practitioners and other technical occupations
69,686Computer and mathematical occupations
69,630Education, training, and library occupations
51,450Construction and extraction occupations
46,069Farming, fishing, and forestry occupations
Top industries in this zip code by the number of employees in 2005:
Other Services (except Public Administration): Religious Organizations (5-9 employees: 2 establishments, 1-4 employees: 1 establishment)
Health Care and Social Assistance: Homes for the Elderly (5-9: 1)
Health Care and Social Assistance: Ambulance Services (5-9: 1)
Mining: Crude Petroleum and Natural Gas Extraction (5-9: 1)
Other Services (except Public Administration): Automotive Body, Paint, and Interior Repair and Maintenance (5-9: 1)
Fatal accident statistics in 2013:
Fatal accident count: 1
Vehicles involved in fatal accidents: 1
Fatal accidents caused by drunken drivers: 1
Fatalities: 1
Persons involved in fatal accidents: 1
Pedestrians involved in fatal accidents: 0
Fatal accident statistics in 2011:
Fatal accident count: 2
Vehicles involved in fatal accidents: 2
Fatal accidents caused by drunken drivers: 1
Fatalities: 4
Persons involved in fatal accidents: 5
Pedestrians involved in fatal accidents: 0
Home Mortgage Disclosure Act Aggregated Statistics For Year 2009 (Based on 4 partial tracts)
A) FHA, FSA/RHS & VA Home Purchase Loans
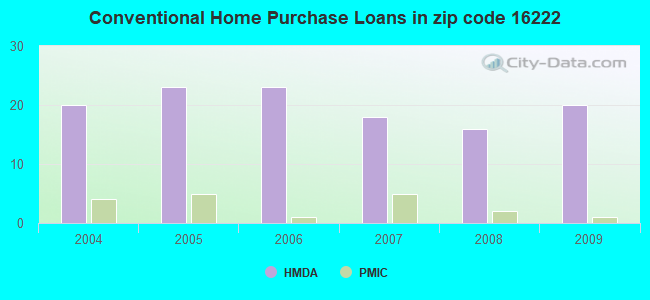
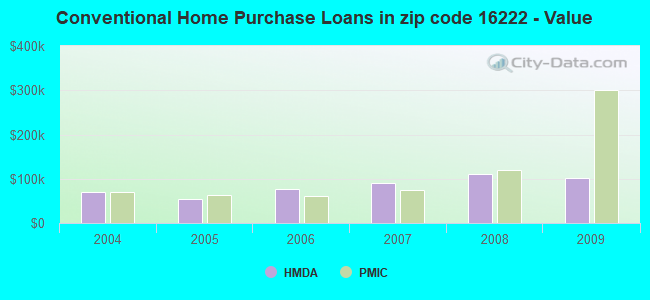
B) Conventional Home Purchase Loans
C) Refinancings
D) Home Improvement Loans
F) Non-occupant Loans on < 5 Family Dwellings (A B C & D)
G) Loans On Manufactured Home Dwelling (A B C & D)
Number
Average Value
Number
Average Value
Number
Average Value
Number
Average Value
Number
Average Value
Number
Average Value
LOANS ORIGINATED
7
$115,434
20
$102,034
42
$85,134
19
$49,789
5
$50,772
4
$43,648
APPLICATIONS APPROVED, NOT ACCEPTED
0
$0
0
$0
4
$115,268
1
$7,610
0
$0
1
$68,900
APPLICATIONS DENIED
3
$92,393
4
$54,778
29
$109,392
5
$29,168
1
$20,680
3
$104,660
APPLICATIONS WITHDRAWN
0
$0
4
$83,415
10
$108,400
1
$20,680
0
$0
1
$139,590
FILES CLOSED FOR INCOMPLETENESS
0
$0
0
$0
2
$134,625
0
$0
0
$0
0
$0
Aggregated Statistics For Year 2008 (Based on 4 partial tracts)
A) FHA, FSA/RHS & VA Home Purchase Loans
B) Conventional Home Purchase Loans
C) Refinancings
D) Home Improvement Loans
F) Non-occupant Loans on < 5 Family Dwellings (A B C & D)
G) Loans On Manufactured Home Dwelling (A B C & D)
Number
Average Value
Number
Average Value
Number
Average Value
Number
Average Value
Number
Average Value
Number
Average Value
LOANS ORIGINATED
7
$90,076
16
$110,204
37
$73,949
25
$30,776
2
$24,835
7
$68,897
APPLICATIONS APPROVED, NOT ACCEPTED
1
$34,460
5
$67,626
5
$84,624
0
$0
1
$39,280
1
$90,710
APPLICATIONS DENIED
3
$63,213
9
$73,570
41
$84,476
16
$55,401
1
$97,430
6
$56,370
APPLICATIONS WITHDRAWN
0
$0
3
$50,110
10
$105,599
2
$107,600
0
$0
2
$63,495
FILES CLOSED FOR INCOMPLETENESS
0
$0
0
$0
1
$116,770
1
$13,780
0
$0
0
$0
Aggregated Statistics For Year 2007 (Based on 4 partial tracts)
A) FHA, FSA/RHS & VA Home Purchase Loans
B) Conventional Home Purchase Loans
C) Refinancings
D) Home Improvement Loans
F) Non-occupant Loans on < 5 Family Dwellings (A B C & D)
G) Loans On Manufactured Home Dwelling (A B C & D)
Number
Average Value
Number
Average Value
Number
Average Value
Number
Average Value
Number
Average Value
Number
Average Value
LOANS ORIGINATED
2
$124,690
18
$90,579
35
$68,701
28
$41,635
2
$67,015
8
$76,389
APPLICATIONS APPROVED, NOT ACCEPTED
0
$0
3
$72,437
11
$58,923
3
$11,640
0
$0
3
$64,950
APPLICATIONS DENIED
0
$0
7
$43,383
58
$80,342
24
$35,620
2
$73,745
9
$83,309
APPLICATIONS WITHDRAWN
0
$0
4
$121,930
20
$89,441
1
$35,730
2
$88,825
1
$139,220
FILES CLOSED FOR INCOMPLETENESS
0
$0
1
$22,740
5
$100,634
0
$0
0
$0
0
$0
Aggregated Statistics For Year 2006 (Based on 4 partial tracts)
A) FHA, FSA/RHS & VA Home Purchase Loans
B) Conventional Home Purchase Loans
C) Refinancings
D) Home Improvement Loans
F) Non-occupant Loans on < 5 Family Dwellings (A B C & D)
G) Loans On Manufactured Home Dwelling (A B C & D)
Number
Average Value
Number
Average Value
Number
Average Value
Number
Average Value
Number
Average Value
Number
Average Value
LOANS ORIGINATED
3
$61,533
23
$77,751
52
$57,119
25
$26,743
3
$100,393
7
$81,921
APPLICATIONS APPROVED, NOT ACCEPTED
0
$0
5
$60,396
8
$74,340
6
$32,662
0
$0
1
$8,270
APPLICATIONS DENIED
0
$0
10
$93,207
42
$70,010
21
$38,811
2
$99,100
2
$48,245
APPLICATIONS WITHDRAWN
0
$0
4
$78,380
19
$75,683
1
$7,580
1
$105,870
1
$57,270
FILES CLOSED FOR INCOMPLETENESS
0
$0
2
$33,095
7
$79,707
0
$0
1
$88,220
1
$24,120
Aggregated Statistics For Year 2005 (Based on 4 partial tracts)
A) FHA, FSA/RHS & VA Home Purchase Loans
B) Conventional Home Purchase Loans
C) Refinancings
D) Home Improvement Loans
F) Non-occupant Loans on < 5 Family Dwellings (A B C & D)
G) Loans On Manufactured Home Dwelling (A B C & D)
Number
Average Value
Number
Average Value
Number
Average Value
Number
Average Value
Number
Average Value
Number
Average Value
LOANS ORIGINATED
1
$49,210
23
$53,122
58
$61,162
28
$34,979
4
$41,168
2
$52,095
APPLICATIONS APPROVED, NOT ACCEPTED
0
$0
1
$50,830
10
$50,956
6
$22,318
2
$34,140
0
$0
APPLICATIONS DENIED
0
$0
7
$61,514
47
$66,337
17
$30,070
3
$33,680
3
$59,187
APPLICATIONS WITHDRAWN
0
$0
2
$79,420
26
$74,230
2
$73,430
1
$80,250
1
$46,980
FILES CLOSED FOR INCOMPLETENESS
0
$0
1
$99,850
3
$67,183
1
$34,460
0
$0
0
$0
Aggregated Statistics For Year 2004 (Based on 4 partial tracts)
A) FHA, FSA/RHS & VA Home Purchase Loans
B) Conventional Home Purchase Loans
C) Refinancings
D) Home Improvement Loans
F) Non-occupant Loans on < 5 Family Dwellings (A B C & D)
G) Loans On Manufactured Home Dwelling (A B C & D)

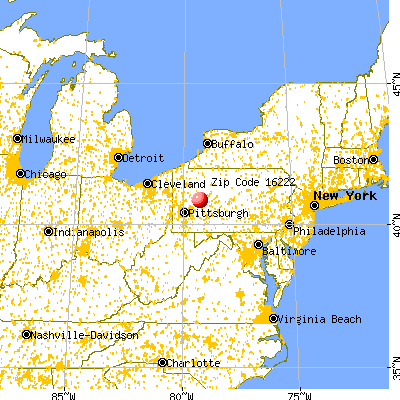


 Nearest zip codes: 16244, 16211, 16263, 16250, 16246, 15778.