Estimated zip code population in 2022: 2,311 Zip code population in 2010: 2,463 Zip code population in 2000: 2,502
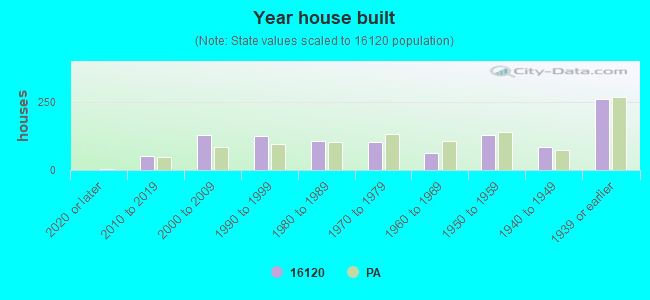
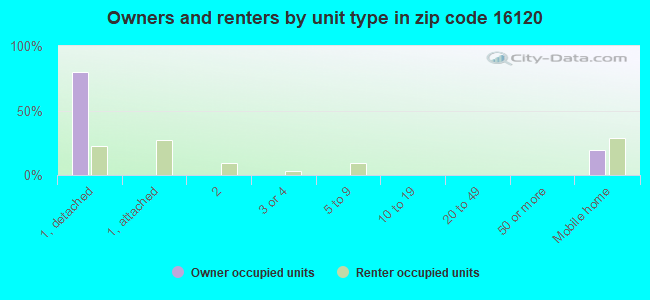
Houses and condos: 1,058 Renter-occupied apartments: 185
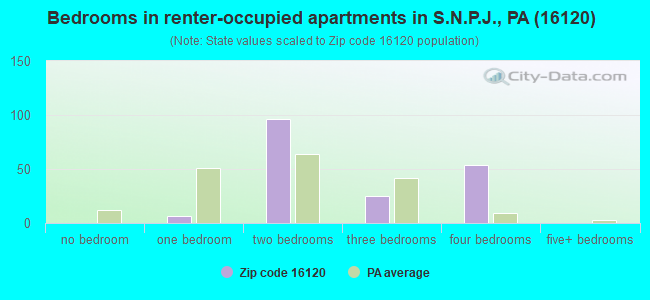
% of renters here:
19%
State:
31%
March 2022 cost of living index in zip code 16120: 90.8 (less than average, U.S. average is 100)
Land area: 33.1 sq. mi. Water area: 0.1 sq. mi.
Population density: 70 people per square mile
(very low).
OSM Map
General Map
Google Map
MSN Map
OSM Map
General Map
Google Map
MSN Map
OSM Map
General Map
Google Map
MSN Map
OSM Map
General Map
Google Map
MSN Map
Please wait while loading the map...
Real estate property taxes paid for housing units in 2022:
This zip code:
1.1% ($1,788)
Pennsylvania:
1.3% ($3,094)
Median real estate property taxes paid for housing units with mortgages in 2022: $2,023 (1.2%) Median real estate property taxes paid for housing units with no mortgage in 2022: $1,449 (1.0%)
Business Search- 14 Million verified businesses
Males: 1,067
(46.2%)
Females: 1,244
(53.8%)
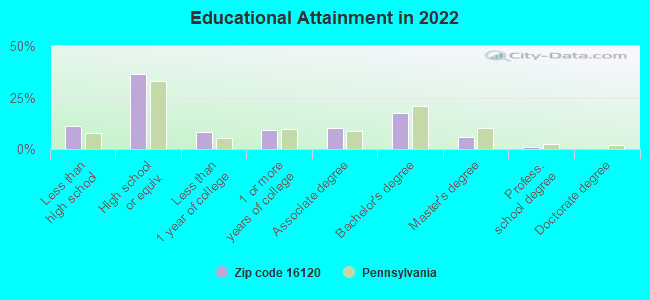
For population 25 years and over in 16120:
High school or higher: 87.4%
Bachelor's degree or higher: 24.1%
Graduate or professional degree: 6.9%
Unemployed: 10.4%
Mean travel time to work (commute): 30.8 minutes
For population 15 years and over in 16120:
Never married: 19.4%
Now married: 61.4%
Separated: 0.5%
Widowed: 7.9%
Divorced: 10.9%
Zip code 16120 compared to state average:
Unemployed percentage above state average.
Black race population percentage significantly below state average.
Hispanic race population percentage significantly below state average.
Median age significantly above state average.
Foreign-born population percentage significantly below state average.
Renting percentage below state average.
Length of stay since moving in significantly above state average.
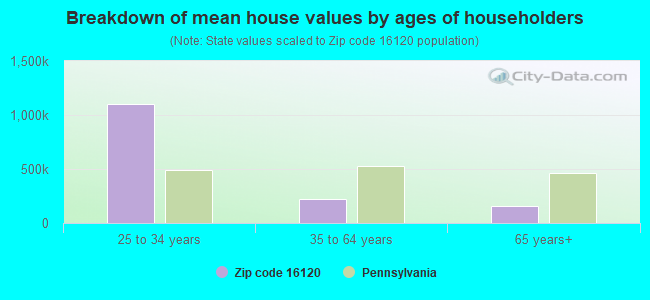
Estimated median house/condo value in 2022: $164,643
16120:
$164,643
Pennsylvania:
$245,500
According to our research of Pennsylvania and other state lists, there were 2 registered sex offenders living in 16120 zip code as of May 23, 2024. The ratio of all residents to sex offenders in zip code 16120 is 999 to 1. The ratio of registered sex offenders to all residents in this zip code is lower than the state average.
Median resident age:
This zip code:
50.1 years
Pennsylvania median age:
40.9 years
Average household size:
This zip code:
2.4 people
Pennsylvania:
2.4 people
Averages for the 2020 tax year for zip code 16120, filed in 2021:
Average Adjusted Gross Income (AGI) in 2020: $58,180 (Individual Income Tax Returns)
Here:
$58,180
State:
$75,707
Salary/wage: $52,676 (reported on 79.1% of returns)
Here:
$52,676
State:
$62,806
(% of AGI for various income ranges: 1063.8% for AGIs below $25k, 3681.6% for AGIs $25k-50k, 6045.0% for AGIs $50k-75k, 9504.3% for AGIs $75k-100k, 15747.0% for AGIs $100k-200k)
Taxable interest for individuals: $771 (reported on 28.2% of returns)
This zip code:
$771
Pennsylvania:
$1,633
(% of AGI for various income ranges: 16.2% for AGIs below $25k, 12.1% for AGIs $25k-50k, 20.0% for AGIs $50k-75k, 21.4% for AGIs $75k-100k, 78.0% for AGIs $100k-200k)
Ordinary dividends: $2,373 (reported on 20.0% of returns)
Here:
$2,373
State:
$7,382
(% of AGI for various income ranges: 34.2% for AGIs below $25k, 16.8% for AGIs $25k-50k, 34.3% for AGIs $50k-75k, 195.7% for AGIs $75k-100k, 223.0% for AGIs $100k-200k)
Net capital gain/loss in AGI: +$5,465 (reported on 15.5% of returns)
Here:
+$5,465
State:
+$23,522
(% of AGI for various income ranges: 18.8% for AGIs below $25k, 29.5% for AGIs $25k-50k, 27.9% for AGIs $50k-75k, 115.7% for AGIs $75k-100k, 708.0% for AGIs $100k-200k)
Profit/loss from business: +$11,193 (reported on 13.6% of returns)
Here:
+$11,193
State:
+$16,274
(% of AGI for various income ranges: 90.0% for AGIs below $25k, 185.8% for AGIs $25k-50k, 405.0% for AGIs $50k-75k, 543.0% for AGIs $100k-200k)
Taxable individual retirement arrangement distribution: $15,100 (reported on 10.9% of returns)
16120:
$15,100
Pennsylvania:
$18,583
(% of AGI for various income ranges: 104.2% for AGIs below $25k, 238.4% for AGIs $25k-50k, 701.4% for AGIs $75k-100k, 618.0% for AGIs $100k-200k)
Total itemized deductions: $28,233 (reported on 2.7% of returns)
Here:
$28,233
State:
$34,850
(% of AGI for various income ranges: 1210.0% for AGIs $75k-100k)
Taxes paid: $6,300 (reported on 2.7% of returns)
16120:
$6,300
State:
$8,200
(% of AGI for various income ranges: 270.0% for AGIs $75k-100k)
Earned income credit: $1,662 (reported on 11.8% of returns)
Here:
$1,662
State:
$2,100
(% of AGI for various income ranges: 50.0% for AGIs below $25k, 50.5% for AGIs $25k-50k)
Percentage of individuals using paid preparers for their 2020 taxes: 93.6%
Here:
94%
State:
92%
(% for various income ranges: 94.4% for AGIs below $25k, 92.3% for AGIs $25k-50k, 94.4% for AGIs $50k-75k, 91.7% for AGIs $75k-100k, 93.3% for AGIs $100k-200k, 100.0% for AGIs over 200k)
Averages for the 2012 tax year for zip code 16120, filed in 2013:
Average Adjusted Gross Income (AGI) in 2012: $51,504 (Individual Income Tax Returns)
Here:
$51,504
State:
$61,346
Salary/wage: $42,776 (reported on 81.4% of returns)
Here:
$42,776
State:
$51,902
(% of AGI for various income ranges: 68.6% for AGIs below $25k, 73.5% for AGIs $25k-50k, 76.3% for AGIs $50k-75k, 72.6% for AGIs $75k-100k, 71.7% for AGIs $100k-200k, 43.9% for AGIs over 200k)
Taxable interest for individuals: $685 (reported on 34.5% of returns)
This zip code:
$685
Pennsylvania:
$1,588
(% of AGI for various income ranges: 0.7% for AGIs below $25k, 0.3% for AGIs $25k-50k, 0.3% for AGIs $50k-75k, 0.5% for AGIs $75k-100k, 0.9% for AGIs $100k-200k)
Ordinary dividends: $1,846 (reported on 21.2% of returns)
Here:
$1,846
State:
$5,827
(% of AGI for various income ranges: 0.9% for AGIs below $25k, 0.2% for AGIs $25k-50k, 0.7% for AGIs $50k-75k, 1.1% for AGIs $75k-100k, 1.5% for AGIs $100k-200k)
Net capital gain/loss in AGI: +$1,331 (reported on 11.5% of returns)
Here:
+$1,331
State:
+$14,495
(% of AGI for various income ranges: 0.7% for AGIs $50k-75k, 0.9% for AGIs $100k-200k)
Profit/loss from business: +$11,200 (reported on 13.3% of returns)
Here:
+$11,200
State:
+$16,268
(% of AGI for various income ranges: 8.8% for AGIs below $25k, 4.9% for AGIs $25k-50k, 3.6% for AGIs $50k-75k, 3.9% for AGIs $75k-100k)
Taxable individual retirement arrangement distribution: $9,592 (reported on 10.6% of returns)
16120:
$9,592
Pennsylvania:
$14,550
(% of AGI for various income ranges: 4.2% for AGIs below $25k, 1.8% for AGIs $25k-50k, 2.9% for AGIs $50k-75k, 4.8% for AGIs $75k-100k)
Total itemized deductions: $21,105 (17% of AGI, reported on 19.5% of returns)
Here:
$21,105
State:
$23,538
Here:
17.1% of AGI
State:
18.4% of AGI
(% of AGI for various income ranges: 5.7% for AGIs $25k-50k, 6.1% for AGIs $50k-75k, 9.6% for AGIs $75k-100k, 11.9% for AGIs $100k-200k, 9.6% for AGIs over 200k)
Charity contributions: $4,683 (reported on 15.9% of returns)
Here:
$4,683
State:
$4,025
(% of AGI for various income ranges: 0.9% for AGIs $25k-50k, 0.7% for AGIs $50k-75k, 1.6% for AGIs $75k-100k, 4.1% for AGIs $100k-200k)
Taxes paid: $8,209 (reported on 19.5% of returns)
16120:
$8,209
State:
$9,982
(% of AGI for various income ranges: 1.5% for AGIs $25k-50k, 2.2% for AGIs $50k-75k, 3.5% for AGIs $75k-100k, 5.4% for AGIs $100k-200k, 3.9% for AGIs over 200k)
Earned income credit: $2,019 (reported on 14.2% of returns)
Here:
$2,019
State:
$2,106
(% of AGI for various income ranges: 4.5% for AGIs below $25k, 0.7% for AGIs $25k-50k)
Percentage of individuals using paid preparers for their 2012 taxes: 65.5%
Here:
65%
State:
53%
(% for various income ranges: 59.6% for AGIs below $25k, 65.4% for AGIs $25k-50k, 75.0% for AGIs $50k-75k, 72.7% for AGIs $75k-100k, 90.0% for AGIs $100k-200k)
Averages for the 2004 tax year for zip code 16120, filed in 2005:
Average Adjusted Gross Income (AGI) in 2004: $35,983 (Individual Income Tax Returns)
Here:
$35,983
State:
$48,049
Salary/wage: $34,026 (reported on 83.8% of returns)
Here:
$34,026
State:
$42,646
(% of AGI for various income ranges: 98.3% for AGIs below $10k, 70.6% for AGIs $10k-25k, 80.8% for AGIs $25k-50k, 86.3% for AGIs $50k-75k, 83.9% for AGIs $75k-100k, 67.0% for AGIs over 100k)
Taxable interest for individuals: $984 (reported on 44.8% of returns)
This zip code:
$984
Pennsylvania:
$1,657
(% of AGI for various income ranges: 4.2% for AGIs below $10k, 2.6% for AGIs $10k-25k, 1.1% for AGIs $25k-50k, 0.6% for AGIs $50k-75k, 0.3% for AGIs $75k-100k, 1.7% for AGIs over 100k)
Taxable dividends: $1,163 (reported on 23.2% of returns)
Here:
$1,163
State:
$3,566
(% of AGI for various income ranges: 2.4% for AGIs below $10k, 1.6% for AGIs $10k-25k, 0.4% for AGIs $25k-50k, 0.5% for AGIs $50k-75k, 0.2% for AGIs $75k-100k, 1.3% for AGIs over 100k)
Net capital gain/loss: +$1,225 (reported on 15.6% of returns)
Here:
+$1,225
State:
+$9,716
(% of AGI for various income ranges: -0.7% for AGIs below $10k, 0.0% for AGIs $10k-25k, 0.7% for AGIs $25k-50k, 0.8% for AGIs $50k-75k, 0.6% for AGIs $75k-100k, 0.4% for AGIs over 100k)
Profit/loss from business: +$7,802 (reported on 14.9% of returns)
Here:
+$7,802
State:
+$14,267
(% of AGI for various income ranges: 4.6% for AGIs below $10k, 5.5% for AGIs $10k-25k, 5.6% for AGIs $25k-50k, 3.1% for AGIs $50k-75k, 1.0% for AGIs over 100k)
IRA payment deduction: $2,000 (reported on 2.6% of returns)
16120:
$2,000
Pennsylvania:
$2,903
Total itemized deductions: $15,717 (21% of AGI, reported on 20.8% of returns)
Here:
$15,717
State:
$18,804
Here:
21.0% of AGI
State:
19.5% of AGI
(% of AGI for various income ranges: 6.2% for AGIs $10k-25k, 7.2% for AGIs $25k-50k, 10.3% for AGIs $50k-75k, 11.1% for AGIs $75k-100k, 11.6% for AGIs over 100k)
Charity contributions deductions: $3,547 (4% of AGI, reported on 17.7% of returns)
Here:
$3,547
State:
$3,337
Here:
4.5% of AGI
State:
3.3% of AGI
(% of AGI for various income ranges: 0.6% for AGIs $10k-25k, 1.0% for AGIs $25k-50k, 1.5% for AGIs $50k-75k, 2.2% for AGIs $75k-100k, 3.6% for AGIs over 100k)
Total tax: $4,776 (reported on 72.7% of returns)
16120:
$4,776
State:
$8,008
(% of AGI for various income ranges: 4.8% for AGIs below $10k, 4.1% for AGIs $10k-25k, 6.1% for AGIs $25k-50k, 8.1% for AGIs $50k-75k, 10.6% for AGIs $75k-100k, 20.1% for AGIs over 100k)
Earned income credit: $1,617 (reported on 14.2% of returns)
Here:
$1,617
State:
$1,643
Percentage of individuals using paid preparers for their 2004 taxes: 63.5%
Here:
64%
State:
56%
(% for various income ranges: 54.8% for AGIs below $10k, 69.8% for AGIs $10k-25k, 63.6% for AGIs $25k-50k, 65.0% for AGIs $50k-75k, 64.6% for AGIs $75k-100k, 67.5% for AGIs over 100k)
Household received Food Stamps/SNAP in the past 12 months: 107 Household did not receive Food Stamps/SNAP in the past 12 months: 865
Women who had a birth in the past 12 months: 30 (14 now married, 14 unmarried) Women who did not have a birth in the past 12 months: 363 (195 now married, 165 unmarried)
Housing units in zip code 16120 with a mortgage: 421 (58 second mortgage, 49 both second mortgage and home equity loan) Houses without a mortgage: 27
Median monthly owner costs for units with a mortgage: $1,243 Median monthly owner costs for units without a mortgage: $478
Residents with income below the poverty level in 2022:
This zip code:
10.6%
Whole state:
11.8%
Residents with income below 50% of the poverty level in 2022:
This zip code:
4.2%
Whole state:
6.1%
Median number of rooms in houses and condos:
Here:
6.6
State:
6.8
Median number of rooms in apartments:
Here:
5.3
State:
4.3
Notable locations in this zip code not listed on our city pages
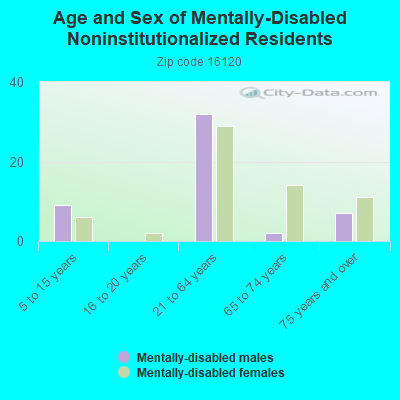
In group quarters: 6 (-1 institutionalized population)
Size of family households: 366 2-persons, 114 3-persons, 133 4-persons, 37 5-persons, 10 6-persons, 17 7-or-more-persons
Size of nonfamily households: 274 1-person, 17 2-persons
211 married couples with children.
117 single-parent households (42 men, 75 women).
96.8% of residents of 16120 zip code speak English at home.
0.1% of residents speak Spanish at home (100% not well).
2.2% of residents speak other Indo-European language at home (36% very well, 53% well, 11% not well).
0.8% of residents speak Asian or Pacific Island language at home (29% very well, 71% not well).
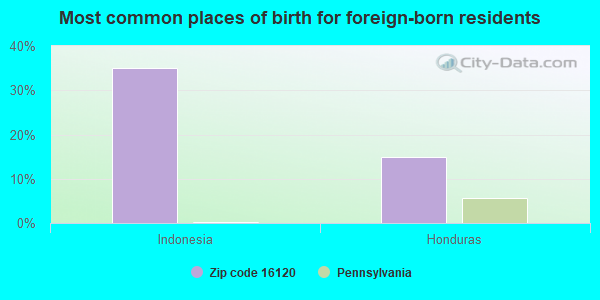
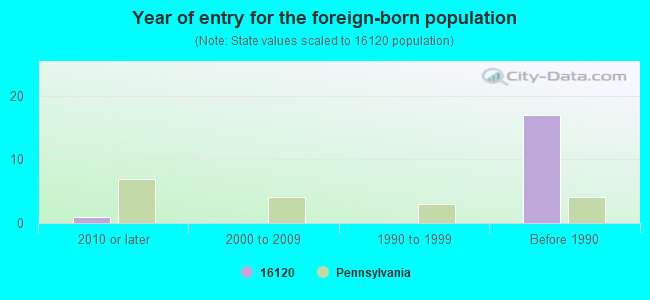
Foreign born population: 20 (0.9%) (0.0% of them are naturalized citizens)
:
0.9%
Whole state:
7.5%
35%Indonesia
15%Honduras
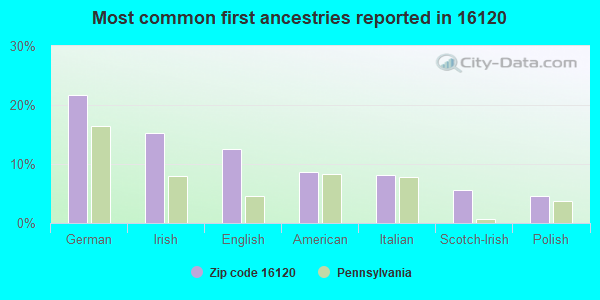
22%German
15%Irish
13%English
9%American
8%Italian
6%Scotch-Irish
5%Polish
Year of entry for the foreign-born population
12010 or later
02000 to 2009
01990 to 1999
17Before 1990
Housing units lacking complete plumbing facilities: 4.1% Housing units lacking complete kitchen facilities: 3.5%
37.9%Electricity
26.1%Utility gas
18.7%Fuel oil, kerosene, etc.
10.7%Bottled, tank, or LP gas
4.4%Wood
2.0%Other fuel
0.6%No fuel used
Population in 1990: 2,421. Population change in the 1990s: +81 (+3.3%).
Place of birth for U.S.-born residents:
This state: 1,917
Northeast: 42
Midwest: 235
South: 50
West: 34
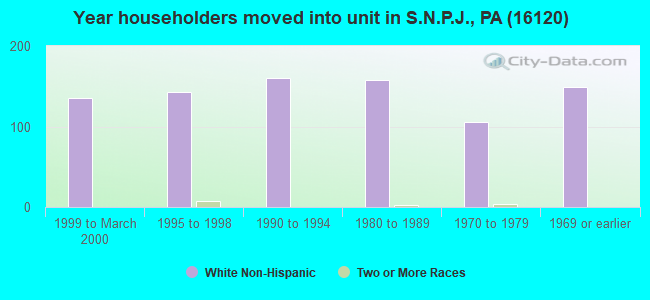
75% of the 16120 zip code residents lived in the same house 5 years ago. Out of people who lived in different houses, 39% lived in this county. Out of people who lived in different counties, 50% lived in Pennsylvania.
98% of the 16120 zip code residents lived in the same house 1 year ago. Out of people who lived in different houses, 41% moved from this county. Out of people who lived in different houses, 41% moved from different county within same state. Out of people who lived in different houses, 34% moved from different state. Out of people who lived in different houses, 3% moved from abroad.
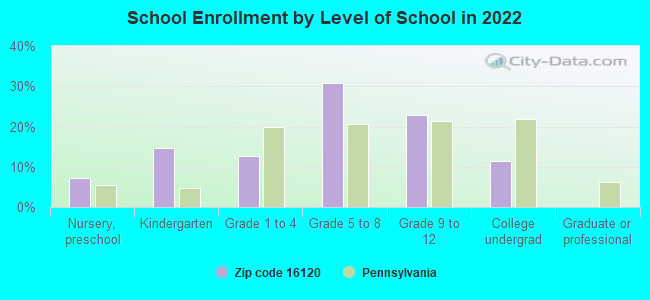
Private vs. public school enrollment:
Students in private schools in grades 1 to 8 (elementary and middle school): 24
Here:
13.1%
Pennsylvania:
15.7%
Students in private schools in grades 9 to 12 (high school): 16
Here:
16.8%
Pennsylvania:
13.4%
Students in private undergraduate colleges: 24
Here:
49.9%
Pennsylvania:
39.8%
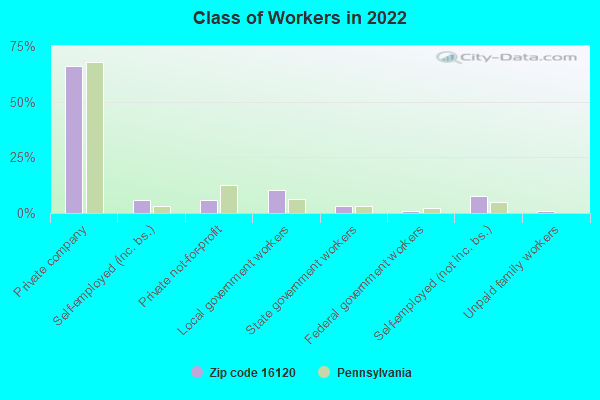
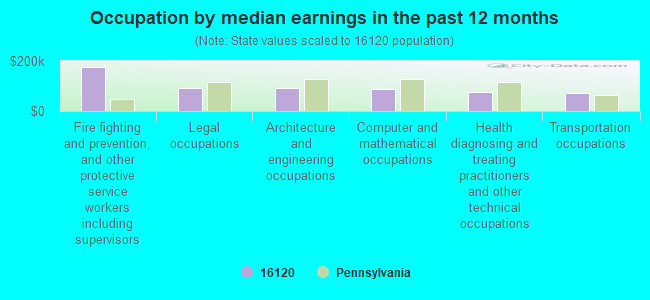
Occupation by median earnings in the past 12 months ($)
174,159Fire fighting and prevention, and other protective service workers including supervisors
93,718Legal occupations
92,353Architecture and engineering occupations
89,215Computer and mathematical occupations
75,282Health diagnosing and treating practitioners and other technical occupations
71,884Transportation occupations
Top industries in this zip code by the number of employees in 2005:
Wholesale Trade: Motor Vehicle Parts (Used) Merchant Wholesalers (20-49 employees: 1 establishment)
Arts, Entertainment, and Recreation: Fitness and Recreational Sports Centers (10-19: 1)
Construction: New Single-Family Housing Construction (except Operative Builders) (10-19: 1)
Construction: Other Building Equipment Contractors (10-19: 1)
Other Services (except Public Administration): Religious Organizations (5-9: 1, 1-4: 1)
Accommodation and Food Services: Full-Service Restaurants (5-9: 1)
Fatal accident statistics in 2011:
Fatal accident count: 2
Vehicles involved in fatal accidents: 5
Fatal accidents caused by drunken drivers: 1
Fatalities: 2
Persons involved in fatal accidents: 8
Pedestrians involved in fatal accidents: 0
Fatal accident statistics in 2010:
Fatal accident count: 1
Vehicles involved in fatal accidents: 1
Fatal accidents caused by drunken drivers: 0
Fatalities: 1
Persons involved in fatal accidents: 1
Pedestrians involved in fatal accidents: 0
Home Mortgage Disclosure Act Aggregated Statistics For Year 2009 (Based on 2 partial tracts)
A) FHA, FSA/RHS & VA Home Purchase Loans
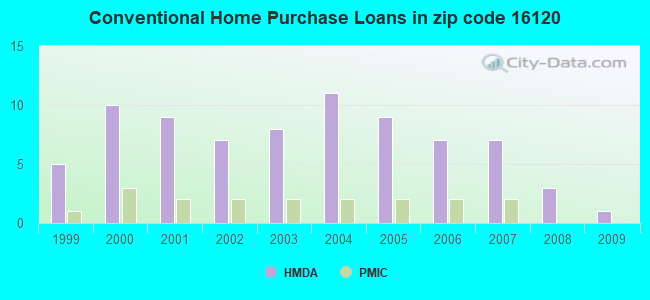
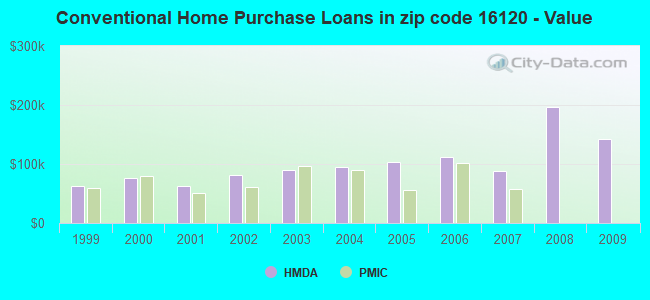
B) Conventional Home Purchase Loans
C) Refinancings
D) Home Improvement Loans
F) Non-occupant Loans on < 5 Family Dwellings (A B C & D)
G) Loans On Manufactured Home Dwelling (A B C & D)
Number
Average Value
Number
Average Value
Number
Average Value
Number
Average Value
Number
Average Value
Number
Average Value
LOANS ORIGINATED
1
$132,800
1
$141,830
13
$122,583
3
$50,160
1
$77,500
0
$0
APPLICATIONS APPROVED, NOT ACCEPTED
0
$0
0
$0
2
$162,330
0
$0
0
$0
0
$0
APPLICATIONS DENIED
0
$0
1
$60,940
8
$101,291
3
$37,747
0
$0
1
$46,270
APPLICATIONS WITHDRAWN
0
$0
1
$171,920
2
$113,610
0
$0
0
$0
0
$0
FILES CLOSED FOR INCOMPLETENESS
0
$0
0
$0
0
$0
0
$0
0
$0
0
$0
Aggregated Statistics For Year 2008 (Based on 2 partial tracts)
A) FHA, FSA/RHS & VA Home Purchase Loans
B) Conventional Home Purchase Loans
C) Refinancings
D) Home Improvement Loans
G) Loans On Manufactured Home Dwelling (A B C & D)
Number
Average Value
Number
Average Value
Number
Average Value
Number
Average Value
Number
Average Value
LOANS ORIGINATED
2
$141,075
3
$195,873
8
$80,271
3
$49,533
1
$158,380
APPLICATIONS APPROVED, NOT ACCEPTED
0
$0
0
$0
0
$0
0
$0
0
$0
APPLICATIONS DENIED
0
$0
2
$75,990
11
$126,745
2
$38,750
1
$28,970
APPLICATIONS WITHDRAWN
0
$0
0
$0
5
$146,040
0
$0
0
$0
FILES CLOSED FOR INCOMPLETENESS
0
$0
0
$0
0
$0
0
$0
0
$0
Aggregated Statistics For Year 2007 (Based on 2 partial tracts)
A) FHA, FSA/RHS & VA Home Purchase Loans
B) Conventional Home Purchase Loans
C) Refinancings
D) Home Improvement Loans
F) Non-occupant Loans on < 5 Family Dwellings (A B C & D)
G) Loans On Manufactured Home Dwelling (A B C & D)
Number
Average Value
Number
Average Value
Number
Average Value
Number
Average Value
Number
Average Value
Number
Average Value
LOANS ORIGINATED
1
$117,000
7
$88,569
10
$87,015
8
$38,514
0
$0
3
$50,660
APPLICATIONS APPROVED, NOT ACCEPTED
0
$0
1
$115,490
2
$56,805
1
$14,300
0
$0
1
$37,620
APPLICATIONS DENIED
0
$0
3
$46,773
22
$102,840
4
$33,670
0
$0
2
$54,735
APPLICATIONS WITHDRAWN
1
$49,280
1
$30,470
6
$164,713
1
$61,700
1
$66,960
0
$0
FILES CLOSED FOR INCOMPLETENESS
0
$0
0
$0
0
$0
0
$0
0
$0
0
$0
Aggregated Statistics For Year 2006 (Based on 2 partial tracts)
B) Conventional Home Purchase Loans
C) Refinancings
D) Home Improvement Loans
F) Non-occupant Loans on < 5 Family Dwellings (A B C & D)
G) Loans On Manufactured Home Dwelling (A B C & D)
Number
Average Value
Number
Average Value
Number
Average Value
Number
Average Value
Number
Average Value
LOANS ORIGINATED
7
$111,463
20
$78,852
5
$39,426
2
$53,045
1
$70,350
APPLICATIONS APPROVED, NOT ACCEPTED
1
$65,460
6
$70,287
0
$0
0
$0
0
$0
APPLICATIONS DENIED
4
$104,772
21
$98,475
6
$35,865
0
$0
2
$17,495
APPLICATIONS WITHDRAWN
2
$63,765
7
$96,414
0
$0
1
$41,380
0
$0
FILES CLOSED FOR INCOMPLETENESS
0
$0
2
$123,960
0
$0
0
$0
0
$0
Aggregated Statistics For Year 2005 (Based on 2 partial tracts)
A) FHA, FSA/RHS & VA Home Purchase Loans
B) Conventional Home Purchase Loans
C) Refinancings
D) Home Improvement Loans
F) Non-occupant Loans on < 5 Family Dwellings (A B C & D)
G) Loans On Manufactured Home Dwelling (A B C & D)
Number
Average Value
Number
Average Value
Number
Average Value
Number
Average Value
Number
Average Value
Number
Average Value
LOANS ORIGINATED
1
$84,270
9
$103,831
16
$71,642
6
$36,868
2
$71,290
5
$61,998
APPLICATIONS APPROVED, NOT ACCEPTED
0
$0
2
$97,625
1
$117,000
0
$0
0
$0
1
$97,810
APPLICATIONS DENIED
0
$0
4
$62,732
21
$95,340
7
$26,979
2
$44,955
3
$63,077
APPLICATIONS WITHDRAWN
0
$0
2
$56,995
8
$99,788
1
$46,650
0
$0
1
$43,260
FILES CLOSED FOR INCOMPLETENESS
0
$0
0
$0
2
$127,530
0
$0
0
$0
0
$0
Aggregated Statistics For Year 2004 (Based on 2 partial tracts)
A) FHA, FSA/RHS & VA Home Purchase Loans
B) Conventional Home Purchase Loans
C) Refinancings
D) Home Improvement Loans
F) Non-occupant Loans on < 5 Family Dwellings (A B C & D)
G) Loans On Manufactured Home Dwelling (A B C & D)
Number
Average Value
Number
Average Value
Number
Average Value
Number
Average Value
Number
Average Value
Number
Average Value
LOANS ORIGINATED
2
$108,720
11
$95,384
20
$83,535
6
$49,345
1
$122,640
2
$73,360
APPLICATIONS APPROVED, NOT ACCEPTED
0
$0
2
$68,655
4
$107,875
2
$33,670
0
$0
1
$68,470
APPLICATIONS DENIED
0
$0
5
$48,078
22
$96,273
6
$22,635
1
$29,720
4
$71,290
APPLICATIONS WITHDRAWN
0
$0
1
$80,880
8
$84,832
2
$46,650
0
$0
0
$0
FILES CLOSED FOR INCOMPLETENESS
0
$0
0
$0
5
$125,124
0
$0
0
$0
0
$0
Aggregated Statistics For Year 2003 (Based on 2 partial tracts)
B) Conventional Home Purchase Loans
C) Refinancings
D) Home Improvement Loans
F) Non-occupant Loans on < 5 Family Dwellings (A B C & D)
Number
Average Value
Number
Average Value
Number
Average Value
Number
Average Value
LOANS ORIGINATED
8
$89,959
27
$82,708
6
$30,158
1
$67,340
APPLICATIONS APPROVED, NOT ACCEPTED
0
$0
8
$65,317
1
$44,020
0
$0
APPLICATIONS DENIED
2
$54,175
18
$97,039
3
$13,167
0
$0
APPLICATIONS WITHDRAWN
2
$85,585
9
$81,343
2
$5,080
0
$0
FILES CLOSED FOR INCOMPLETENESS
0
$0
2
$71,665
0
$0
0
$0
Aggregated Statistics For Year 2002 (Based on 2 partial tracts)
A) FHA, FSA/RHS & VA Home Purchase Loans
B) Conventional Home Purchase Loans
C) Refinancings
D) Home Improvement Loans
Number
Average Value
Number
Average Value
Number
Average Value
Number
Average Value
LOANS ORIGINATED
1
$49,660
7
$81,743
26
$73,475
6
$23,325
APPLICATIONS APPROVED, NOT ACCEPTED
1
$62,450
2
$52,290
6
$91,855
0
$0
APPLICATIONS DENIED
0
$0
3
$31,727
12
$84,175
1
$13,540
APPLICATIONS WITHDRAWN
0
$0
0
$0
6
$77,998
1
$15,050
FILES CLOSED FOR INCOMPLETENESS
0
$0
0
$0
2
$100,820
0
$0
Aggregated Statistics For Year 2001 (Based on 2 partial tracts)
A) FHA, FSA/RHS & VA Home Purchase Loans
B) Conventional Home Purchase Loans
C) Refinancings
D) Home Improvement Loans
F) Non-occupant Loans on < 5 Family Dwellings (A B C & D)
Number
Average Value
Number
Average Value
Number
Average Value
Number
Average Value
Number
Average Value
LOANS ORIGINATED
2
$59,250
9
$63,411
26
$74,488
6
$36,115
2
$66,585
APPLICATIONS APPROVED, NOT ACCEPTED
0
$0
2
$52,105
7
$84,484
2
$39,500
1
$129,790
APPLICATIONS DENIED
0
$0
5
$64,180
14
$74,299
3
$35,237
1
$69,600
APPLICATIONS WITHDRAWN
0
$0
3
$74,237
11
$72,641
3
$12,040
1
$62,450
FILES CLOSED FOR INCOMPLETENESS
0
$0
0
$0
3
$78,750
0
$0
0
$0
Aggregated Statistics For Year 2000 (Based on 2 partial tracts)
A) FHA, FSA/RHS & VA Home Purchase Loans
B) Conventional Home Purchase Loans
C) Refinancings
D) Home Improvement Loans
F) Non-occupant Loans on < 5 Family Dwellings (A B C & D)
Number
Average Value
Number
Average Value
Number
Average Value
Number
Average Value
Number
Average Value
LOANS ORIGINATED
2
$57,935
10
$75,503
12
$64,832
8
$20,598
1
$16,180
APPLICATIONS APPROVED, NOT ACCEPTED
0
$0
3
$66,963
6
$74,927
2
$14,295
0
$0
APPLICATIONS DENIED
0
$0
5
$42,886
9
$66,169
5
$17,982
0
$0
APPLICATIONS WITHDRAWN
0
$0
1
$72,610
8
$63,484
1
$17,310
0
$0
FILES CLOSED FOR INCOMPLETENESS
0
$0
0
$0
3
$86,150
0
$0
0
$0
Aggregated Statistics For Year 1999 (Based on 1 partial tract)
A) FHA, FSA/RHS & VA Home Purchase Loans
B) Conventional Home Purchase Loans
C) Refinancings
D) Home Improvement Loans
F) Non-occupant Loans on < 5 Family Dwellings (A B C & D)


 Nearest zip codes: 16112, 44454, 44413, 16141, 16115, 16102.