Estimated zip code population in 2022: 3,496 Zip code population in 2010: 3,287 Zip code population in 2000: 3,459
Houses and condos: 1,510 Renter-occupied apartments: 255
% of renters here:
18%
State:
31%
March 2022 cost of living index in zip code 16115: 87.8 (less than average, U.S. average is 100)
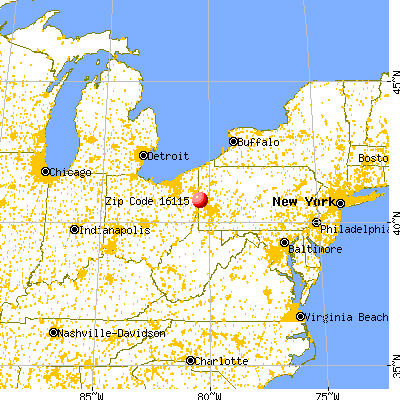
Land area: 40.2 sq. mi. Water area: 0.1 sq. mi.
Population density: 87 people per square mile
(very low).
OSM Map
General Map
Google Map
MSN Map
OSM Map
General Map
Google Map
MSN Map
OSM Map
General Map
Google Map
MSN Map
OSM Map
General Map
Google Map
MSN Map
Please wait while loading the map...
Real estate property taxes paid for housing units in 2022:
This zip code:
1.3% ($2,390)
Pennsylvania:
1.3% ($3,094)
Median real estate property taxes paid for housing units with mortgages in 2022: $2,736 (1.4%) Median real estate property taxes paid for housing units with no mortgage in 2022: $1,830 (1.1%)
Business Search- 14 Million verified businesses
Males: 1,711
(48.9%)
Females: 1,785
(51.1%)
For population 25 years and over in 16115:
High school or higher: 95.3%
Bachelor's degree or higher: 22.1%
Graduate or professional degree: 3.5%
Unemployed: 5.9%
Mean travel time to work (commute): 27.3 minutes
For population 15 years and over in 16115:
Never married: 28.8%
Now married: 52.5%
Separated: 0.3%
Widowed: 6.5%
Divorced: 11.9%
Zip code 16115 compared to state average:
Black race population percentage significantly below state average.
Hispanic race population percentage significantly below state average.
Median age above state average.
Foreign-born population percentage significantly below state average.
Renting percentage below state average.
Length of stay since moving in significantly above state average.
Percentage of population with a bachelor's degree or higher below state average.
Estimated median house/condo value in 2022: $180,923
16115:
$180,923
Pennsylvania:
$245,500
According to our research of Pennsylvania and other state lists, there were 3 registered sex offenders living in 16115 zip code as of May 26, 2024. The ratio of all residents to sex offenders in zip code 16115 is 1,040 to 1. The ratio of registered sex offenders to all residents in this zip code is lower than the state average.
Median resident age:
This zip code:
46.3 years
Pennsylvania median age:
40.9 years
Average household size:
This zip code:
2.4 people
Pennsylvania:
2.4 people
Averages for the 2020 tax year for zip code 16115, filed in 2021:
Average Adjusted Gross Income (AGI) in 2020: $63,938 (Individual Income Tax Returns)
Here:
$63,938
State:
$75,707
Salary/wage: $51,427 (reported on 81.0% of returns)
Here:
$51,427
State:
$62,806
(% of AGI for various income ranges: 967.6% for AGIs below $25k, 3186.7% for AGIs $25k-50k, 5351.8% for AGIs $50k-75k, 7812.7% for AGIs $75k-100k, 13942.9% for AGIs $100k-200k)
Taxable interest for individuals: $579 (reported on 28.8% of returns)
This zip code:
$579
Pennsylvania:
$1,633
(% of AGI for various income ranges: 8.5% for AGIs below $25k, 21.2% for AGIs $25k-50k, 17.7% for AGIs $50k-75k, 13.3% for AGIs $75k-100k, 29.4% for AGIs $100k-200k)
Ordinary dividends: $2,709 (reported on 19.6% of returns)
Here:
$2,709
State:
$7,382
(% of AGI for various income ranges: 37.3% for AGIs below $25k, 36.4% for AGIs $25k-50k, 41.8% for AGIs $50k-75k, 72.7% for AGIs $75k-100k, 189.4% for AGIs $100k-200k)
Net capital gain/loss in AGI: +$5,812 (reported on 15.3% of returns)
Here:
+$5,812
State:
+$23,522
(% of AGI for various income ranges: 7.6% for AGIs below $25k, 17.9% for AGIs $25k-50k, 77.7% for AGIs $50k-75k, 56.7% for AGIs $75k-100k, 370.6% for AGIs $100k-200k)
Profit/loss from business: +$10,516 (reported on 11.7% of returns)
Here:
+$10,516
State:
+$16,274
(% of AGI for various income ranges: 154.5% for AGIs below $25k, 123.6% for AGIs $25k-50k, 208.6% for AGIs $50k-75k, 365.3% for AGIs $100k-200k)
Taxable individual retirement arrangement distribution: $14,082 (reported on 13.5% of returns)
16115:
$14,082
Pennsylvania:
$18,583
(% of AGI for various income ranges: 114.5% for AGIs below $25k, 130.3% for AGIs $25k-50k, 190.9% for AGIs $50k-75k, 490.0% for AGIs $75k-100k, 667.6% for AGIs $100k-200k)
Total itemized deductions: $28,280 (reported on 3.1% of returns)
Here:
$28,280
State:
$34,850
(% of AGI for various income ranges: 177.6% for AGIs $25k-50k, 487.1% for AGIs $100k-200k)
Charity contributions: $7,000 (reported on 1.8% of returns)
Here:
$7,000
State:
$12,392
(% of AGI for various income ranges: 123.5% for AGIs $100k-200k)
Taxes paid: $7,000 (reported on 3.1% of returns)
16115:
$7,000
State:
$8,200
(% of AGI for various income ranges: 205.9% for AGIs $100k-200k)
Earned income credit: $1,982 (reported on 10.4% of returns)
Here:
$1,982
State:
$2,100
(% of AGI for various income ranges: 64.5% for AGIs below $25k, 37.6% for AGIs $25k-50k)
Percentage of individuals using paid preparers for their 2020 taxes: 94.5%
Here:
94%
State:
92%
(% for various income ranges: 91.7% for AGIs below $25k, 92.7% for AGIs $25k-50k, 96.3% for AGIs $50k-75k, 100.0% for AGIs $75k-100k, 95.8% for AGIs $100k-200k, 100.0% for AGIs over 200k)
Averages for the 2012 tax year for zip code 16115, filed in 2013:
Average Adjusted Gross Income (AGI) in 2012: $49,914 (Individual Income Tax Returns)
Here:
$49,914
State:
$61,346
Salary/wage: $42,651 (reported on 84.4% of returns)
Here:
$42,651
State:
$51,902
(% of AGI for various income ranges: 71.4% for AGIs below $25k, 75.5% for AGIs $25k-50k, 77.0% for AGIs $50k-75k, 79.6% for AGIs $75k-100k, 88.3% for AGIs $100k-200k)
Taxable interest for individuals: $615 (reported on 31.1% of returns)
This zip code:
$615
Pennsylvania:
$1,588
(% of AGI for various income ranges: 0.9% for AGIs below $25k, 0.4% for AGIs $25k-50k, 0.3% for AGIs $50k-75k, 0.3% for AGIs $75k-100k, 0.4% for AGIs $100k-200k)
Ordinary dividends: $1,712 (reported on 19.2% of returns)
Here:
$1,712
State:
$5,827
(% of AGI for various income ranges: 1.0% for AGIs below $25k, 0.5% for AGIs $25k-50k, 0.7% for AGIs $50k-75k, 0.4% for AGIs $75k-100k, 1.1% for AGIs $100k-200k)
Net capital gain/loss in AGI: +$548 (reported on 12.6% of returns)
Here:
+$548
State:
+$14,495
(% of AGI for various income ranges: 0.7% for AGIs $100k-200k)
Profit/loss from business: +$8,563 (reported on 11.4% of returns)
Here:
+$8,563
State:
+$16,268
(% of AGI for various income ranges: 3.9% for AGIs below $25k, 2.9% for AGIs $25k-50k, 2.8% for AGIs $50k-75k, 1.8% for AGIs $100k-200k)
Taxable individual retirement arrangement distribution: $9,826 (reported on 11.4% of returns)
16115:
$9,826
Pennsylvania:
$14,550
(% of AGI for various income ranges: 3.1% for AGIs below $25k, 3.0% for AGIs $25k-50k, 3.6% for AGIs $50k-75k, 2.5% for AGIs $100k-200k)
Total itemized deductions: $18,520 (18% of AGI, reported on 21.0% of returns)
Here:
$18,520
State:
$23,538
Here:
18.3% of AGI
State:
18.4% of AGI
(% of AGI for various income ranges: 4.0% for AGIs below $25k, 5.0% for AGIs $25k-50k, 6.5% for AGIs $50k-75k, 8.4% for AGIs $75k-100k, 14.9% for AGIs $100k-200k)
Charity contributions: $3,488 (reported on 15.6% of returns)
Here:
$3,488
State:
$4,025
(% of AGI for various income ranges: 0.8% for AGIs $25k-50k, 0.6% for AGIs $50k-75k, 0.7% for AGIs $75k-100k, 2.8% for AGIs $100k-200k)
Taxes paid: $7,291 (reported on 21.0% of returns)
16115:
$7,291
State:
$9,982
(% of AGI for various income ranges: 0.9% for AGIs below $25k, 1.4% for AGIs $25k-50k, 2.1% for AGIs $50k-75k, 3.4% for AGIs $75k-100k, 6.9% for AGIs $100k-200k)
Earned income credit: $1,996 (reported on 13.8% of returns)
Here:
$1,996
State:
$2,106
(% of AGI for various income ranges: 4.5% for AGIs below $25k, 0.8% for AGIs $25k-50k)
Percentage of individuals using paid preparers for their 2012 taxes: 62.9%
Here:
63%
State:
53%
(% for various income ranges: 57.4% for AGIs below $25k, 59.5% for AGIs $25k-50k, 63.3% for AGIs $50k-75k, 75.0% for AGIs $75k-100k, 87.5% for AGIs $100k-200k)
Averages for the 2004 tax year for zip code 16115, filed in 2005:
Average Adjusted Gross Income (AGI) in 2004: $37,026 (Individual Income Tax Returns)
Here:
$37,026
State:
$48,049
Salary/wage: $34,900 (reported on 84.5% of returns)
Here:
$34,900
State:
$42,646
(% of AGI for various income ranges: 91.7% for AGIs below $10k, 69.5% for AGIs $10k-25k, 80.9% for AGIs $25k-50k, 84.1% for AGIs $50k-75k, 81.1% for AGIs $75k-100k, 73.3% for AGIs over 100k)
Taxable interest for individuals: $1,035 (reported on 44.0% of returns)
This zip code:
$1,035
Pennsylvania:
$1,657
(% of AGI for various income ranges: 2.7% for AGIs below $10k, 2.1% for AGIs $10k-25k, 1.1% for AGIs $25k-50k, 1.4% for AGIs $50k-75k, 0.6% for AGIs $75k-100k, 1.0% for AGIs over 100k)
Taxable dividends: $1,228 (reported on 22.7% of returns)
Here:
$1,228
State:
$3,566
(% of AGI for various income ranges: 2.2% for AGIs below $10k, 1.1% for AGIs $10k-25k, 0.6% for AGIs $25k-50k, 0.4% for AGIs $50k-75k, 0.6% for AGIs $75k-100k, 1.3% for AGIs over 100k)
Net capital gain/loss: +$935 (reported on 15.9% of returns)
Here:
+$935
State:
+$9,716
(% of AGI for various income ranges: -1.5% for AGIs below $10k, -0.2% for AGIs $10k-25k, -0.1% for AGIs $25k-50k, 1.2% for AGIs $50k-75k, 0.2% for AGIs $75k-100k, 0.7% for AGIs over 100k)
Profit/loss from business: +$11,216 (reported on 14.1% of returns)
Here:
+$11,216
State:
+$14,267
(% of AGI for various income ranges: 10.3% for AGIs below $10k, 7.6% for AGIs $10k-25k, 3.2% for AGIs $25k-50k, 2.9% for AGIs $50k-75k, -0.0% for AGIs $75k-100k, 9.4% for AGIs over 100k)
IRA payment deduction: $2,847 (reported on 3.6% of returns)
16115:
$2,847
Pennsylvania:
$2,903
(% of AGI for various income ranges: 0.5% for AGIs $10k-25k, 0.4% for AGIs $25k-50k, 0.2% for AGIs $50k-75k, 0.4% for AGIs $75k-100k)
Total itemized deductions: $15,003 (22% of AGI, reported on 23.7% of returns)
Here:
$15,003
State:
$18,804
Here:
22.2% of AGI
State:
19.5% of AGI
(% of AGI for various income ranges: 14.3% for AGIs below $10k, 8.4% for AGIs $10k-25k, 6.1% for AGIs $25k-50k, 10.2% for AGIs $50k-75k, 10.8% for AGIs $75k-100k, 13.1% for AGIs over 100k)
Charity contributions deductions: $2,191 (3% of AGI, reported on 20.0% of returns)
Here:
$2,191
State:
$3,337
Here:
3.0% of AGI
State:
3.3% of AGI
(% of AGI for various income ranges: 1.1% for AGIs $10k-25k, 0.5% for AGIs $25k-50k, 1.2% for AGIs $50k-75k, 1.4% for AGIs $75k-100k, 2.2% for AGIs over 100k)
Total tax: $4,550 (reported on 74.9% of returns)
16115:
$4,550
State:
$8,008
(% of AGI for various income ranges: 2.8% for AGIs below $10k, 4.6% for AGIs $10k-25k, 6.9% for AGIs $25k-50k, 8.7% for AGIs $50k-75k, 10.3% for AGIs $75k-100k, 17.0% for AGIs over 100k)
Earned income credit: $1,488 (reported on 12.7% of returns)
Here:
$1,488
State:
$1,643
Percentage of individuals using paid preparers for their 2004 taxes: 62.3%
Here:
62%
State:
56%
(% for various income ranges: 52.4% for AGIs below $10k, 62.8% for AGIs $10k-25k, 66.8% for AGIs $25k-50k, 64.6% for AGIs $50k-75k, 67.5% for AGIs $75k-100k, 65.7% for AGIs over 100k)
Likely homosexual households (counted as self-reported same-sex unmarried-partner households)
Lesbian couples: 1.1% of all households
Gay men: 0.0% of all households
Household received Food Stamps/SNAP in the past 12 months: 190 Household did not receive Food Stamps/SNAP in the past 12 months: 1,242
Women who had a birth in the past 12 months: 24 (18 now married, 6 unmarried) Women who did not have a birth in the past 12 months: 736 (230 now married, 507 unmarried)
Housing units in zip code 16115 with a mortgage: 549 (52 second mortgage, 2 home equity loan, 46 both second mortgage and home equity loan) Houses without a mortgage: 104
Median monthly owner costs for units with a mortgage: $1,273 Median monthly owner costs for units without a mortgage: $581
Residents with income below the poverty level in 2022:
This zip code:
5.0%
Whole state:
11.8%
Residents with income below 50% of the poverty level in 2022:
This zip code:
3.4%
Whole state:
6.1%
Median number of rooms in houses and condos:
Here:
5.9
State:
6.8
Median number of rooms in apartments:
Here:
5.5
State:
4.3
Notable locations in this zip code not listed on our city pages
Notable locations in zip code 16115: Walt Mills (A), South Beaver Township Volunteer Fire Company 1 Station 61 (B), Big Beaver Volunteer Fire Company (C), Darlington Township Volunteer Fire Department (D). Display/hide their locations on the map
In group quarters: 17 (-1 institutionalized population)
Size of family households: 472 2-persons, 239 3-persons, 151 4-persons, 81 5-persons, 16 6-persons, 11 7-or-more-persons
Size of nonfamily households: 371 1-person, 79 2-persons, 7 3-persons
479 married couples with children.
144 single-parent households (80 men, 64 women).
98.0% of residents of 16115 zip code speak English at home.
0.4% of residents speak Spanish at home (100% very well).
0.7% of residents speak other Indo-European language at home (83% very well, 17% not well).
0.3% of residents speak Asian or Pacific Island language at home (70% very well, 30% well).
0.1% of residents speak other language at home (100% very well).
Foreign born population: 26 (0.8%) (88.4% of them are naturalized citizens)
This zip code:
0.8%
Whole state:
7.5%
36%Greece
28%Bhutan
8%Barbados
19%German
18%Irish
10%Italian
8%English
7%American
6%Polish
6%European
Year of entry for the foreign-born population
32010 or later
02000 to 2009
01990 to 1999
50Before 1990
Facilities with environmental interests located in this zip code:
BFI MEDICAL WASTE SYS STEEL INC (ROUTE 51 & LITTLE BEAVER RD in DARLINGTON, PA)
AGHOG PITTSBURGH CO INC (RD 2 PO BOX 76 ASHWOOD RD in DARLINGTON, PA)
TRANSPORTER (Resource Conservation and Recovery Act (tracking hazardous waste)) Business NAICS classification: PRIMARY SMELTING AND REFINING OF NONFERROUS METAL (EXCEPT COPPER AND ALUMINUM). Organizations: OPERNAME (CONTACT/OPERATOR)
AUTO BODY WORKS (170 STATE RT 168 in DARLINGTON, PA)
Small Quantity Generators, between 100 kg and 1000 kg of hazardous waste/month (Resource Conservation and Recovery Act (tracking hazardous waste)) - notification Organizations: OPERNAME (CONTACT/OPERATOR)
, BIRNESSER, PAUL JR & SHAFFER, WILLIAM (CONTACT/OWNER)
Housing units lacking complete plumbing facilities: 0.3% Housing units lacking complete kitchen facilities: 2.1%
35.3%Utility gas
26.3%Fuel oil, kerosene, etc.
18.3%Electricity
12.5%Bottled, tank, or LP gas
6.8%Wood
1.0%Other fuel
Population in 1990: 3,397. Population change in the 1990s: +62 (+1.8%).
Place of birth for U.S.-born residents:
This state: 2,971
Northeast: 62
Midwest: 252
South: 117
West: 10
78% of the 16115 zip code residents lived in the same house 5 years ago. Out of people who lived in different houses, 68% lived in this county. Out of people who lived in different counties, 50% lived in Pennsylvania.
97% of the 16115 zip code residents lived in the same house 1 year ago. Out of people who lived in different houses, 67% moved from this county. Out of people who lived in different houses, 18% moved from different county within same state. Out of people who lived in different houses, 25% moved from different state.
Private vs. public school enrollment:
Students in private schools in grades 1 to 8 (elementary and middle school): 47
Here:
16.6%
Pennsylvania:
15.7%
Students in private schools in grades 9 to 12 (high school): 32
Here:
20.7%
Pennsylvania:
13.4%
Students in private undergraduate colleges: 25
Here:
20.4%
Pennsylvania:
39.8%
Occupation by median earnings in the past 12 months ($)
88,627Architecture and engineering occupations
82,307Management occupations
69,540Transportation occupations
64,445Health diagnosing and treating practitioners and other technical occupations
63,975Personal care and service occupations
63,123Fire fighting and prevention, and other protective service workers including supervisors
Top industries in this zip code by the number of employees in 2005:
Other Services (except Public Administration): Automotive Body, Paint, and Interior Repair and Maintenance (20-49 employees: 1 establishment, 1-4 employees: 1 establishment)
Professional, Scientific, and Technical Services: Computer Systems Design Services (20-49: 1)
Wholesale Trade: Transportation Equipment and Supplies (except Motor Vehicle) Merchant Wholesalers (20-49: 1)
People in group quarters in 2010:
7 people in emergency and transitional shelters (with sleeping facilities) for people experiencing homelessness
People in group quarters in 2000:
78 people in nursing homes
4 people in other nonhousehold living situations
Fatal accident statistics in 2013:
Fatal accident count: 1
Vehicles involved in fatal accidents: 1
Fatal accidents caused by drunken drivers: 0
Fatalities: 1
Persons involved in fatal accidents: 1
Pedestrians involved in fatal accidents: 0
Fatal accident statistics in 2012:
Fatal accident count: 2
Vehicles involved in fatal accidents: 3
Fatal accidents caused by drunken drivers: 1
Fatalities: 2
Persons involved in fatal accidents: 3
Pedestrians involved in fatal accidents: 0
Home Mortgage Disclosure Act Aggregated Statistics For Year 2009 (Based on 6 partial tracts)
A) FHA, FSA/RHS & VA Home Purchase Loans
B) Conventional Home Purchase Loans
C) Refinancings
D) Home Improvement Loans
F) Non-occupant Loans on < 5 Family Dwellings (A B C & D)
G) Loans On Manufactured Home Dwelling (A B C & D)
Number
Average Value
Number
Average Value
Number
Average Value
Number
Average Value
Number
Average Value
Number
Average Value
LOANS ORIGINATED
12
$116,265
16
$117,540
104
$120,671
22
$42,482
5
$114,926
5
$71,340
APPLICATIONS APPROVED, NOT ACCEPTED
0
$0
2
$32,525
22
$133,856
1
$175,010
0
$0
1
$28,190
APPLICATIONS DENIED
0
$0
5
$64,444
74
$126,339
18
$42,650
3
$17,007
6
$62,040
APPLICATIONS WITHDRAWN
1
$127,440
6
$129,315
23
$110,070
4
$36,305
0
$0
2
$37,900
FILES CLOSED FOR INCOMPLETENESS
0
$0
0
$0
4
$156,532
2
$73,455
0
$0
0
$0
Aggregated Statistics For Year 2008 (Based on 6 partial tracts)
A) FHA, FSA/RHS & VA Home Purchase Loans
B) Conventional Home Purchase Loans
C) Refinancings
D) Home Improvement Loans
F) Non-occupant Loans on < 5 Family Dwellings (A B C & D)
G) Loans On Manufactured Home Dwelling (A B C & D)
Number
Average Value
Number
Average Value
Number
Average Value
Number
Average Value
Number
Average Value
Number
Average Value
LOANS ORIGINATED
15
$127,374
31
$141,451
68
$98,403
22
$45,660
3
$326,670
8
$97,049
APPLICATIONS APPROVED, NOT ACCEPTED
0
$0
2
$59,170
8
$75,482
2
$10,300
0
$0
1
$68,540
APPLICATIONS DENIED
3
$81,763
14
$94,174
96
$143,499
18
$47,529
0
$0
10
$31,511
APPLICATIONS WITHDRAWN
0
$0
3
$96,020
24
$145,003
4
$22,050
0
$0
0
$0
FILES CLOSED FOR INCOMPLETENESS
0
$0
0
$0
6
$150,220
0
$0
0
$0
1
$118,130
Aggregated Statistics For Year 2007 (Based on 6 partial tracts)
A) FHA, FSA/RHS & VA Home Purchase Loans
B) Conventional Home Purchase Loans
C) Refinancings
D) Home Improvement Loans
E) Loans on Dwellings For 5+ Families
F) Non-occupant Loans on < 5 Family Dwellings (A B C & D)
G) Loans On Manufactured Home Dwelling (A B C & D)
Number
Average Value
Number
Average Value
Number
Average Value
Number
Average Value
Number
Average Value
Number
Average Value
Number
Average Value
LOANS ORIGINATED
13
$105,988
71
$106,377
108
$89,849
58
$36,155
0
$0
5
$115,724
22
$59,164
APPLICATIONS APPROVED, NOT ACCEPTED
0
$0
8
$91,698
15
$96,060
9
$45,574
0
$0
0
$0
4
$57,375
APPLICATIONS DENIED
1
$90,640
20
$61,660
149
$105,302
25
$44,578
1
$193,980
0
$0
12
$60,298
APPLICATIONS WITHDRAWN
4
$84,135
7
$57,851
40
$152,193
9
$59,438
0
$0
3
$86,533
1
$173,550
FILES CLOSED FOR INCOMPLETENESS
0
$0
3
$85,690
8
$111,054
0
$0
0
$0
1
$32,710
0
$0
Aggregated Statistics For Year 2006 (Based on 6 partial tracts)
A) FHA, FSA/RHS & VA Home Purchase Loans
B) Conventional Home Purchase Loans
C) Refinancings
D) Home Improvement Loans
F) Non-occupant Loans on < 5 Family Dwellings (A B C & D)
G) Loans On Manufactured Home Dwelling (A B C & D)
Number
Average Value
Number
Average Value
Number
Average Value
Number
Average Value
Number
Average Value
Number
Average Value
LOANS ORIGINATED
3
$129,300
71
$104,205
157
$87,702
52
$32,804
9
$69,158
18
$53,147
APPLICATIONS APPROVED, NOT ACCEPTED
1
$120,670
12
$77,089
39
$65,575
5
$33,890
1
$91,880
3
$42,543
APPLICATIONS DENIED
0
$0
25
$97,579
153
$104,207
32
$42,826
6
$114,963
13
$54,646
APPLICATIONS WITHDRAWN
0
$0
14
$92,756
51
$95,400
1
$117,030
4
$52,308
1
$110,840
FILES CLOSED FOR INCOMPLETENESS
0
$0
3
$100,467
17
$111,854
0
$0
0
$0
0
$0
Aggregated Statistics For Year 2005 (Based on 6 partial tracts)
A) FHA, FSA/RHS & VA Home Purchase Loans
B) Conventional Home Purchase Loans
C) Refinancings
D) Home Improvement Loans
F) Non-occupant Loans on < 5 Family Dwellings (A B C & D)
G) Loans On Manufactured Home Dwelling (A B C & D)
Number
Average Value
Number
Average Value
Number
Average Value
Number
Average Value
Number
Average Value
Number
Average Value
LOANS ORIGINATED
8
$92,731
73
$115,347
142
$81,747
43
$43,747
7
$87,784
26
$68,250
APPLICATIONS APPROVED, NOT ACCEPTED
0
$0
14
$86,463
26
$91,473
6
$24,887
0
$0
8
$56,968
APPLICATIONS DENIED
0
$0
27
$57,809
141
$96,184
38
$35,351
9
$40,092
28
$59,576
APPLICATIONS WITHDRAWN
0
$0
13
$87,405
70
$102,118
4
$70,608
2
$55,900
7
$62,914
FILES CLOSED FOR INCOMPLETENESS
1
$119,590
1
$50,750
9
$136,149
0
$0
0
$0
0
$0
Aggregated Statistics For Year 2004 (Based on 6 partial tracts)
A) FHA, FSA/RHS & VA Home Purchase Loans
B) Conventional Home Purchase Loans
C) Refinancings
D) Home Improvement Loans
F) Non-occupant Loans on < 5 Family Dwellings (A B C & D)
G) Loans On Manufactured Home Dwelling (A B C & D)
Number
Average Value
Number
Average Value
Number
Average Value
Number
Average Value
Number
Average Value
Number
Average Value
LOANS ORIGINATED
10
$127,744
91
$99,939
178
$90,465
62
$35,703
11
$85,670
16
$61,014
APPLICATIONS APPROVED, NOT ACCEPTED
0
$0
15
$65,146
40
$98,091
15
$43,685
0
$0
9
$45,120
APPLICATIONS DENIED
3
$160,223
33
$53,838
142
$104,207
50
$24,764
14
$24,126
26
$60,697
APPLICATIONS WITHDRAWN
0
$0
10
$85,641
73
$89,646
14
$45,008
1
$109,380
1
$58,760
FILES CLOSED FOR INCOMPLETENESS
0
$0
3
$69,187
41
$116,952
4
$16,480
2
$77,305
0
$0
Aggregated Statistics For Year 2003 (Based on 6 partial tracts)
A) FHA, FSA/RHS & VA Home Purchase Loans
B) Conventional Home Purchase Loans
C) Refinancings
D) Home Improvement Loans
F) Non-occupant Loans on < 5 Family Dwellings (A B C & D)
Number
Average Value
Number
Average Value
Number
Average Value
Number
Average Value
Number
Average Value
LOANS ORIGINATED
2
$165,600
82
$93,504
300
$88,199
63
$35,417
9
$62,956
APPLICATIONS APPROVED, NOT ACCEPTED
0
$0
14
$85,771
63
$86,784
10
$48,088
0
$0
APPLICATIONS DENIED
0
$0
23
$86,444
150
$100,303
23
$22,604
3
$118,660
APPLICATIONS WITHDRAWN
1
$134,210
12
$92,612
69
$86,376
15
$36,878
0
$0
FILES CLOSED FOR INCOMPLETENESS
0
$0
1
$267,290
15
$103,616
3
$70,263
1
$68,800
Aggregated Statistics For Year 2002 (Based on 6 partial tracts)
A) FHA, FSA/RHS & VA Home Purchase Loans
B) Conventional Home Purchase Loans
C) Refinancings
D) Home Improvement Loans
F) Non-occupant Loans on < 5 Family Dwellings (A B C & D)
Number
Average Value
Number
Average Value
Number
Average Value
Number
Average Value
Number
Average Value
LOANS ORIGINATED
6
$81,860
69
$83,329
249
$82,735
42
$24,199
3
$54,467
APPLICATIONS APPROVED, NOT ACCEPTED
5
$85,936
12
$58,375
51
$87,438
4
$50,738
3
$73,287
APPLICATIONS DENIED
4
$101,912
31
$36,636
114
$82,858
13
$14,851
4
$64,995
APPLICATIONS WITHDRAWN
0
$0
7
$89,849
62
$93,088
8
$19,434
2
$90,225
FILES CLOSED FOR INCOMPLETENESS
1
$91,880
6
$82,318
20
$108,712
0
$0
1
$69,920
Aggregated Statistics For Year 2001 (Based on 6 partial tracts)
A) FHA, FSA/RHS & VA Home Purchase Loans
B) Conventional Home Purchase Loans
C) Refinancings
D) Home Improvement Loans
F) Non-occupant Loans on < 5 Family Dwellings (A B C & D)
Number
Average Value
Number
Average Value
Number
Average Value
Number
Average Value
Number
Average Value
LOANS ORIGINATED
11
$80,561
64
$65,128
211
$76,166
54
$28,071
14
$50,659
APPLICATIONS APPROVED, NOT ACCEPTED
0
$0
21
$50,957
47
$77,582
12
$36,348
4
$125,788
APPLICATIONS DENIED
0
$0
38
$57,448
119
$81,611
26
$30,904
3
$89,933
APPLICATIONS WITHDRAWN
0
$0
16
$79,707
72
$82,719
13
$21,010
4
$60,522
FILES CLOSED FOR INCOMPLETENESS
0
$0
1
$58,340
24
$86,778
1
$126,880
0
$0
Aggregated Statistics For Year 2000 (Based on 6 partial tracts)
A) FHA, FSA/RHS & VA Home Purchase Loans
B) Conventional Home Purchase Loans
C) Refinancings
D) Home Improvement Loans
F) Non-occupant Loans on < 5 Family Dwellings (A B C & D)
Number
Average Value
Number
Average Value
Number
Average Value
Number
Average Value
Number
Average Value
LOANS ORIGINATED
15
$62,331
77
$80,332
87
$69,392
53
$21,190
5
$56,566
APPLICATIONS APPROVED, NOT ACCEPTED
4
$99,755
22
$67,200
47
$77,242
14
$13,796
2
$14,850
APPLICATIONS DENIED
2
$74,060
39
$40,566
71
$67,027
23
$19,048
1
$63,160
APPLICATIONS WITHDRAWN
1
$40,340
7
$72,680
48
$76,182
8
$20,372
3
$12,930
FILES CLOSED FOR INCOMPLETENESS
0
$0
0
$0
21
$74,732
0
$0
0
$0
Aggregated Statistics For Year 1999 (Based on 3 partial tracts)
A) FHA, FSA/RHS & VA Home Purchase Loans
B) Conventional Home Purchase Loans
C) Refinancings
D) Home Improvement Loans
F) Non-occupant Loans on < 5 Family Dwellings (A B C & D)
2004 - 2018 National Fire Incident Reporting System (NFIRS) incidents
According to the data from the years 2004 - 2018 the average number of fires per year is 10. The highest number of reported fires - 18 took place in 2008, and the least - 1 in 2009. The data has a constant trend.
When looking into fire subcategories, the most reports belonged to: Structure Fires (41.2%), and Outside Fires (39.2%).
Fire incident types reported to NFIRS in Zip Code 16115


 Nearest zip codes: 16120, 16141, 44441, 44413, 15010, 15059.


 According to the data from the years 2004 - 2018 the average number of fires per year is 10. The highest number of reported fires - 18 took place in 2008, and the least - 1 in 2009. The data has a constant trend.
 When looking into fire subcategories, the most reports belonged to: Structure Fires (41.2%), and Outside Fires (39.2%).